Chapter 12 – Strategy and the Analysis of Capital Investments
12–91
12–58 MACRS Depreciation and Capital-Budgeting Analysis; Sensitivity Analysis;
Spreadsheet Application (60 minutes)
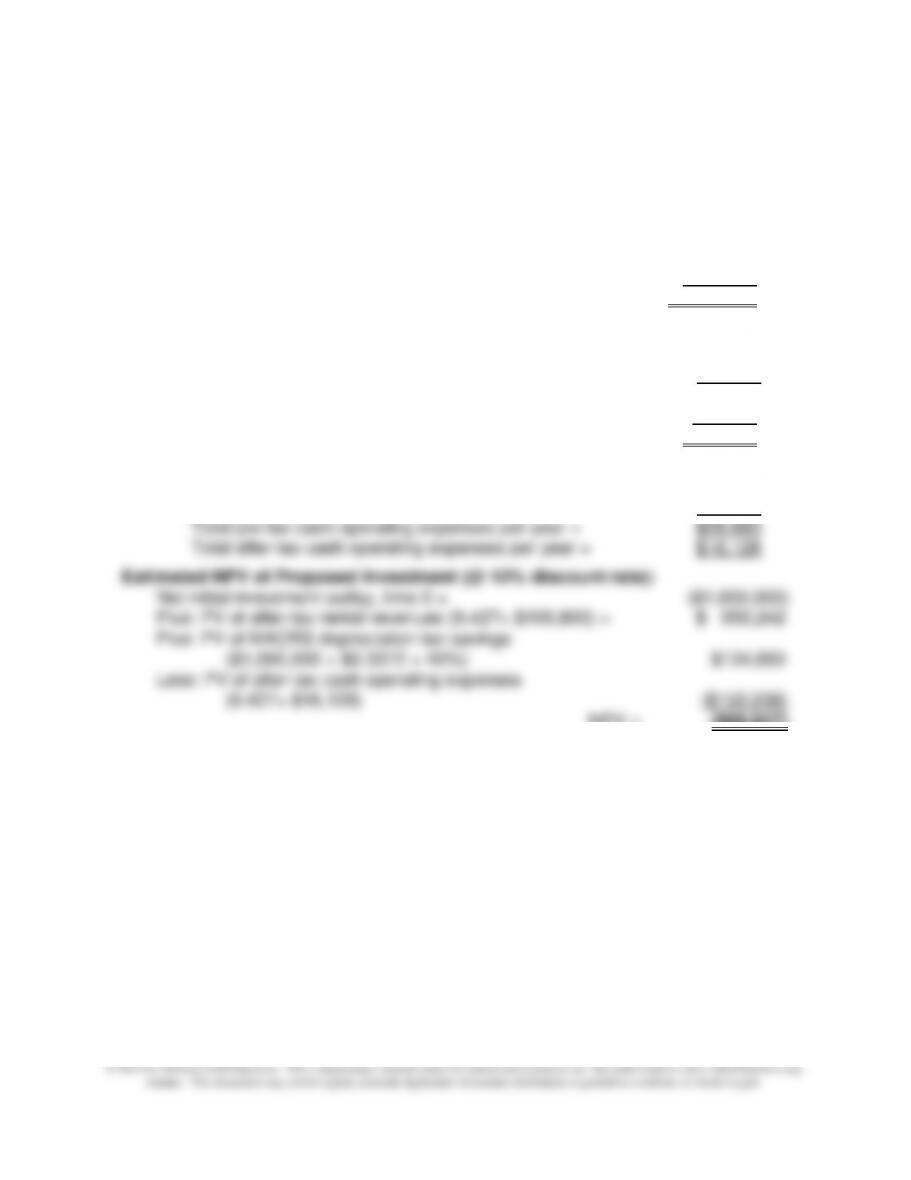
1. The estimated after-tax NPV of this proposed investment is ($66,917), as follows:
Net investment outlay, time 0:
Purchase cost $500,000
Remodeling cost (25 units × $20,000 per unit) $500,000
Net investment outlay $1,000,000
After-tax cash inflow per year:
Pre-tax rental revenue, $500 units = 15 units × $500 × 12 = $90,000
Pre-tax rental revenue, $650 units = 10 units × $650 × 12 = $78,000
$168,000
Less: Income taxes (@ 40%) = $67,200
After-tax rental revenue = $100,800
After-tax Cash Operating Expenses per Year:
Pre-tax expenses, $500 units ($90,000 × 0.16) = $14,400
Pre-tax expenses, $650 units ($78,000 × 0.16) = $12,480
NPV = ($66,917)
Note: the PV factor of 0.3372for 27.5-year residential rental property is given in the
problem, but can be calculated as follows:
PV27YR = [ (t * Dep%i)÷(1+r)i]÷100, where t = tax rate, Dep% = MACRS
depreciation rate (e.g., Exhibit 12.4), r = WACC (discount rate), and i = 1,
28.The MACRS depreciation rates for 27.5-year property must be
obtained outside the text (they are not disclosed in Exhibit 12.4.)
2. Sensitivity analysis:
a. If the discount rate were 8% (rather than 10%), the estimated NPV of the project is
now positive, as follows:
MACRS depreciation rates÷12-month period=100% ÷ 27.5 periods = 3.636%
MACRS depreciation per year, first 27 years = 3.636%
12–92
12–58 (Continued-1)
Tax Savings
MACRS annual depreciation, first 27 years = $36,364 $14,545
MACRS depreciation deduction, year 28 = $18,182 $7,273
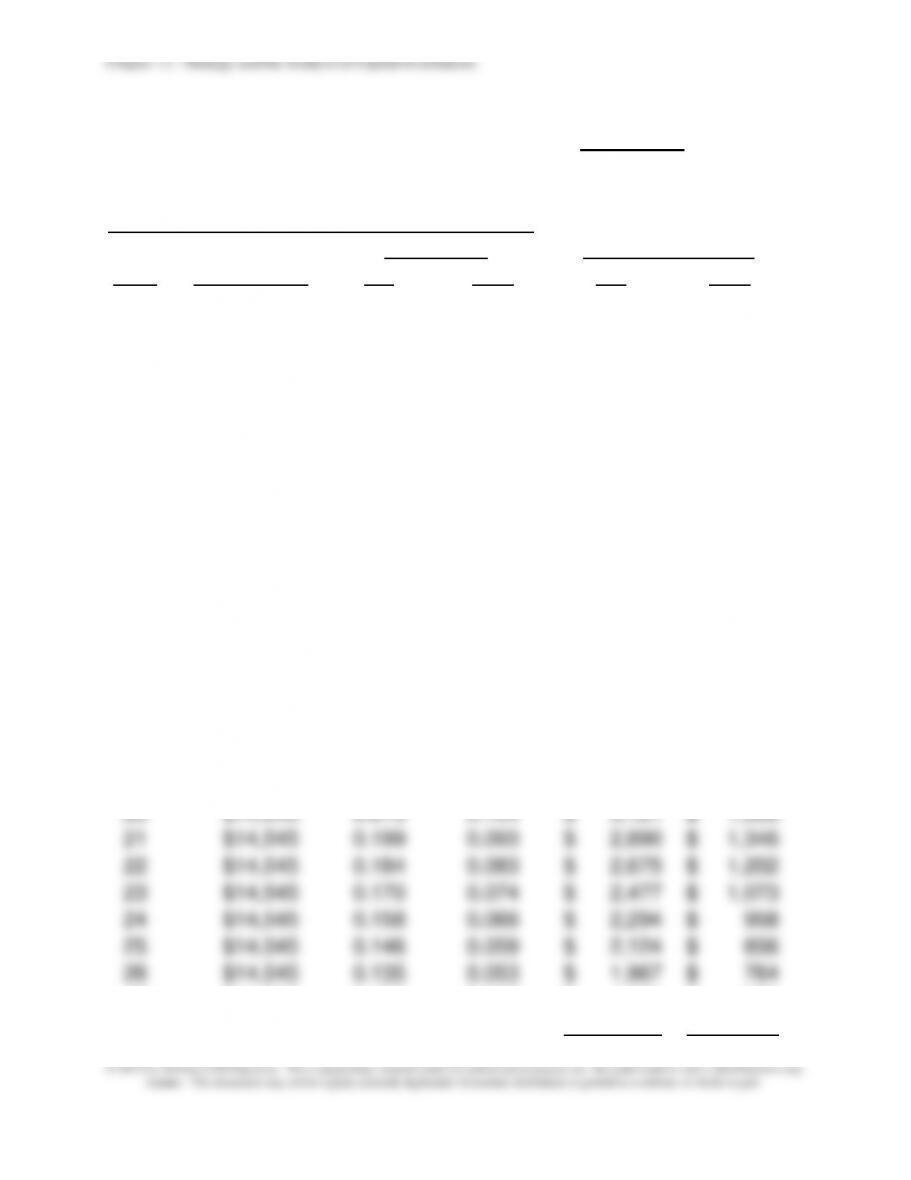
Present Value of MACRS Depreciation Deductions
PV Factors
PV of Tax Savings
Year
Tax Savings
8%
12%
8%
12%
1
$14,545
0.926
0.893
$ 13,468
$ 12,987
2
$14,545
0.857
0.797
$ 12,470
$ 11,596
3
$14,545
0.794
0.712
$ 11,547
$ 10,353
4
$14,545
0.735
0.636
$ 10,691
$ 9,244
5
$14,545
0.681
0.567
$ 9,899
$ 8,253
6
$14,545
0.630
0.507
$ 9,166
$ 7,369
7
$14,545
0.583
0.452
$ 8,487
$ 6,580
8
$14,545
0.540
0.404
$ 7,858
$ 5,875
9
$14,545
0.500
0.361
$ 7,276
$ 5,245
10
$14,545
0.463
0.322
$ 6,737
$ 4,683
11
$14,545
0.429
0.287
$ 6,238
$ 4,181
12
$14,545
0.397
0.257
$ 5,776
$ 3,733
13
$14,545
0.368
0.229
$ 5,348
$ 3,333
14
$14,545
0.340
0.205
$ 4,952
$ 2,976
15
$14,545
0.315
0.183
$ 4,585
$ 2,657
16
$14,545
0.292
0.163
$ 4,246
$ 2,373
17
$14,545
0.270
0.146
$ 3,931
$ 2,118
18
$14,545
0.250
0.130
$ 3,640
$ 1,891
19
$14,545
0.232
0.116
$ 3,370
$ 1,689
20
$14,545
0.215
0.104
$ 3,121
$ 1,508
21
$14,545
0.199
0.093
$ 2,890
$ 1,346
22
$14,545
0.184
0.083
$ 2,675
$ 1,202
23
$14,545
0.170
0.074
$ 2,477
$ 1,073
24
$14,545
0.158
0.066
$ 2,294
$ 958
25
$14,545
0.146
0.059
$ 2,124
$ 856
26
$14,545
0.135
0.053
$ 1,967
$ 764
27
$14,545
0.125
0.047
$ 1,821
$ 682
28
$7,273
0.116
0.042
$ 843
$ 305
12–93
© 2013 by McGraw-Hill Education. This is proprietary material solely for authorized instructor use. Not authorized for sale or distribution in any
manner. This document may not be copied, scanned, duplicated, forwarded, distributed, or posted on a website, in whole or part.
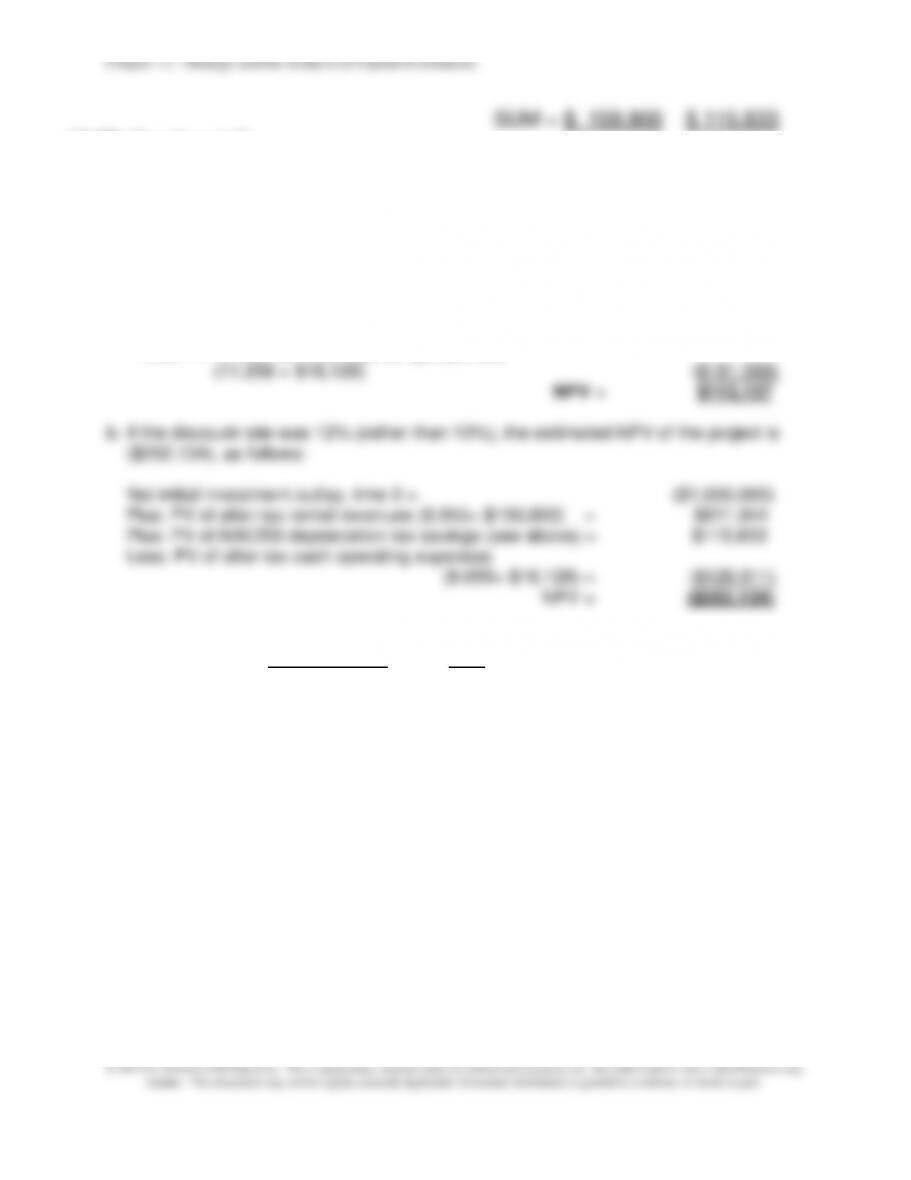
SUM = $ 159,900 $ 115,833
12–58 (Continued-2)
Alternatively:
a) For 8%: ($14,545 × 10.935) + (0.116 × $7,273) = $159,900
b) For 12%: ($14,545 × 7.943) + (0.042 × $7,273) = $115,833
Estimated NPV of Proposed Investment (@ 8% discount rate):
Net initial investment outlay, time 0 = ($1,000,000)
Plus: PV of after-tax rental revenues (11.258 × $100,800) = $1,134,806
Plus: PV of MACRS depreciation tax savings (see above) = $159,900
Less: PV of after-tax cash operating expenses
Summary:
Discount Rate NPV
8.00% $113,137
10.00% ($66,917)
12.00% ($202,134)
Chapter 12 – Strategy and the Analysis of Capital Investments
12–94
3. Additional factors to be considered before investing in the apartment complex:
• Alternative investment opportunities (rather than the proposed investment)?
• Sensitivity of investment decision (i.e., accept or reject) with respect to:
o Volume (occupancy) assumption?
12–95
12-59 Environmental Cost Management (60 minutes)
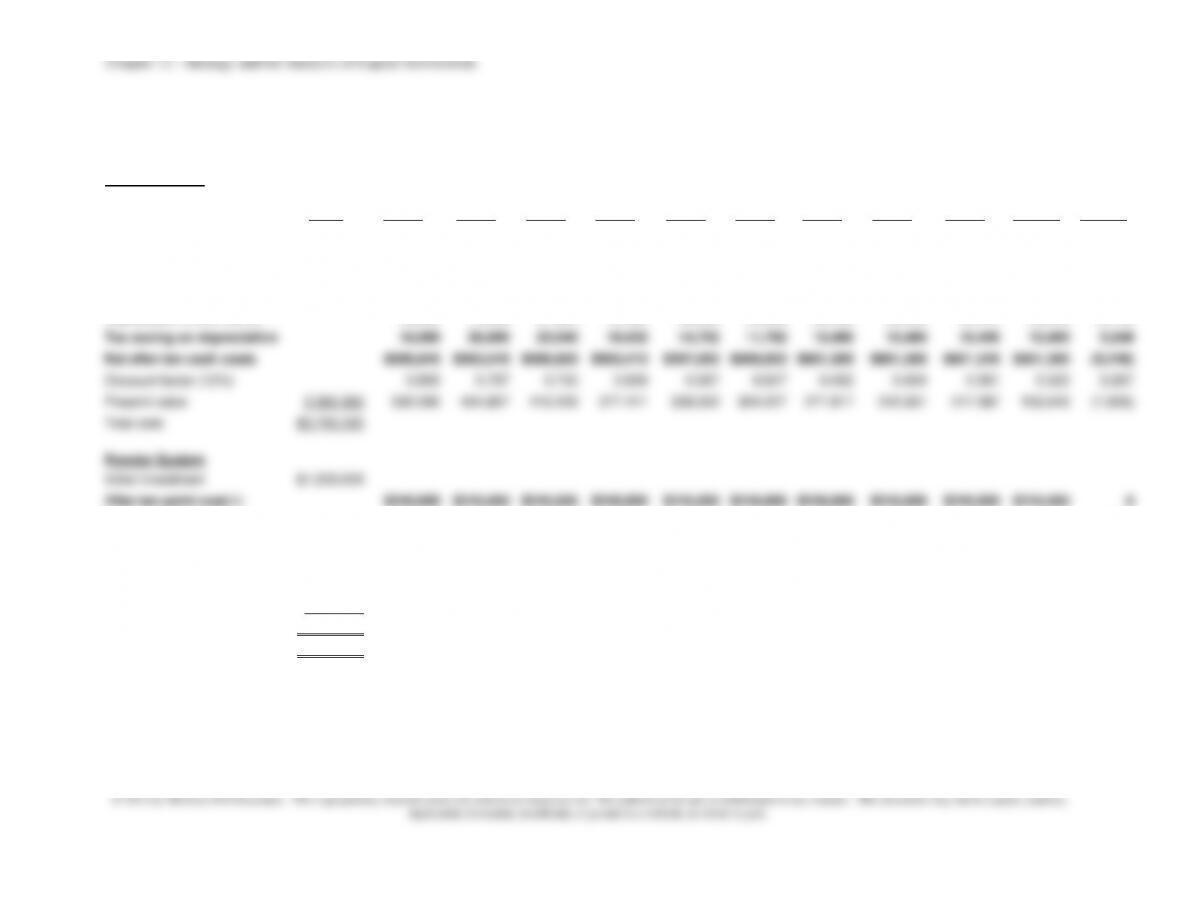
1.
Solvent System
Present
Value
Year 1
Year 2
Year 3
Year 4
Year 5
Year 6
Year 7
Year 8
Year 9
Year 10
Year 11
Initial investment
$400,000
After-tax paint cost (1)
$228,000
$228,000
$228,000
$228,000
$228,000
$228,000
$228,000
$228,000
$228,000
$228,000
0
After-tax environ. costs (3)
$383,845
$383,845
$383,845
$383,845
$383,845
$383,845
$383,845
$383,845
$383,845
$383,845
Total after-tax cash costs
$611,845
$611,845
$611,845
$611,845
$611,845
$611,845
$611,845
$611,845
$611,845
$611,845
Depreciation (MACRS) (2)
40,000
72,000
57,600
46,080
36,880
29,480
26,200
26,200
26,240
26,200
13,120
Tax saving on depreciation
16,000
28,800
23,040
18,432
14,752
11,792
10,480
10,480
10,496
10,480
5,248
Net after-tax cash costs
$595,845
$583,045
$588,805
$593,413
$597,093
$600,053
$601,365
$601,365
$601,349
$601,365
(5,248)
Discount factor (12%)
0.893
0.797
0.712
0.636
0.567
0.507
0.452
0.404
0.361
0.322
0.287
Present value
3,360,365
532,090
464,867
419,229
377,411
338,552
304,227
271,817
242,951
217,087
193,640
(1,506)
Total cost
$3,760,365
Powder System
Initial investment
$1,200,000
After-tax paint cost(4)
$240,000
$240,000
$240,000
$240,000
$240,000
$240,000
$240,000
$240,000
$240,000
$240,000
0
Depreciation (MACRS)
120,000
216,000
172,800
138,240
110,640
88,440
78,600
78,600
78,720
78,600
39,360
Tax saving on depreciation
48,000
86,400
69,120
55,296
44,256
35,376
31,440
31,440
31,488
31,440
15,744
Net after-tax cash costs
192,000
153,600
170,880
184,704
195,744
204,624
208,560
208,560
208,512
208,560
(15,744)
Discount factor (12%)
0.893
0.797
0.712
0.636
0.567
0.507
0.452
0.404
0.361
0.322
0.287
PV
1,064,182
171,456
122,419
121,667
117,472
110,987
103,744
94,269
84,258
75,273
67,156
(4,519)
Total cost
$2,264,182
Difference in total cost
$1,496,183
Chapter 12 – Strategy and the Analysis of Capital Investments
12–96
12–59 (Continued)
Notes:
(1) Annual after-tax paint cost, solvent system = $0.19/unit × 2,000,000 units/year
× (1 − 0.40) = $228,000.
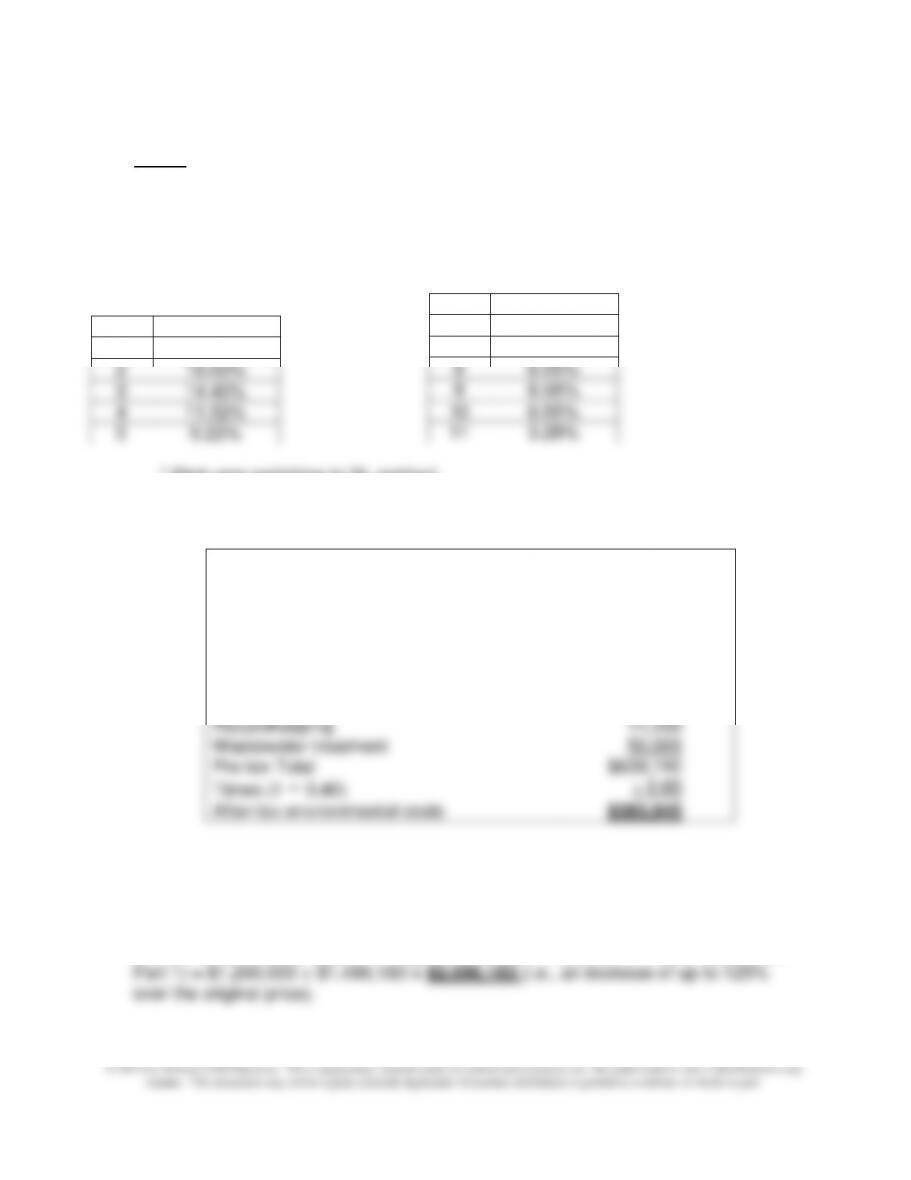
(2) MACRS depreciation rates, 10-year property (from text Exhibit 12.4):
Year
Rate
1
10.00%
2
18.00%
3
14.40%
4
11.52%
5
9.22%
* First year switching to SL method
(3) Additional environmental costs, Solvent Paint System:
Wastewater treatment
50,000
Pre-tax Total
After-tax environmental costs
(4) Annual after-tax paint cost, Powder Paint System = $0.20/unit × 2,000,000
units/year × (1 − 0.40) = $240,000.
2. Based solely on financial considerations, the maximum the company should spend
on the Powder-Based System = original estimate + difference in PVs of costs (from
Year
Rate
6
7.37%
7
6.55%*
8
6.55%
9
6.56%
10
6.55%
11
3.28%
Item
Annual Cost
Pit cleaning
$12,000
Waste disposal
549,000
Superfund Fee
3,177
Worker training
3,000
Insurance
10,000
Amortization of air-emission permit
200
Air-emission fee
1,115
Recordkeeping
11,250
Chapter 12 – Strategy and the Analysis of Capital Investments
12–97
12-60 Research Assignment, Strategy (50-60 Minutes)
This assignment pertains to the following article: Clayton M. Christensen, Stephen P.
Kaufman, and Willy C. Shih, “Innovation Killers: How Financial Tools Destroy Your
Capacity to Do New Things,” Harvard Business Review (January 2008), pp. 98-105.
The article focuses on bias against innovation that is attributable to the misuse of
certain financial tools. In fact, they conclude (p. 104) that “managers in established
corporations use analytical methods that make innovation investments extremely
difficult to justify.” The authors point to the following three “misguided applications” of
financial tools: (1) discounted cash flow (DCF) and net present value (NPV) to evaluate
away from investments whose payoff lies beyond the immediate horizon.
1. According to the authors of the article, how does the use of DCF tools by
managers in practice bias against innovation? What solution do the authors
propose to counter this problem?
While not disputing the underlying mathematics of the discounting process that lies at
the heart of DCF methods such as NPV, the authors assert two implementation errors
on the part of decision-makers:
(1) The “DCF Trap:” some analysts (erroneously) assume a status quo competitive
position in their analysis of an investment project. That is, they extrapolate the
current market share and profitability of the company, without recognizing the
potential for erosion of both over time as competitors invest. As the authors state,
“In most situations, competitors’ sustaining and disruptive investments over time
Answering this question entails assessing the projected value of the innovation
against a range of scenarios, the most realistic of which is often a deteriorating
competitive and financial future.
Chapter 12 – Strategy and the Analysis of Capital Investments
12–98
12–60 (Continued-1)
(2) Errors of estimation. The authors assert that in practice many managers, as a
way to recognize the inherent uncertainties associated with distant cash flows,
simply assume a terminal value at a certain point in the project’s life. That is, all
cash flows beyond this (near-term) point in a project’s life is embodied in a single
amount, called the project’s “terminal value.” (This terminal value is often
estimated as the present value, at the terminal point, of the stream of future cash
cash inflows (because the future stream, to infinity, is a function of the assumed
near-term cash inflows), and (2) the method fails to incorporate the declining
competitive situation discussed above in point #1.
2. Define the terms “fixed costs” and “sunk costs.” According to the authors of
this article, what is the bias against innovation that is created by how some
decision-makers view such costs? What remedies do the authors recommend
for dealing with this problem?
(a) “Fixed costs” are defined as those costs that in the short run do not vary in
response to an underlying activity variable or cost driver. These costs are also
referred to as “capacity–related” costs, since they provide a certain amount of
(b) In terms of assessing “innovation projects,” the authors suggest that in practice
some managers err by assuming that the current levels of fixed costs are adequate to
support the new investment. In their words, these managers assume that “capabilities
required for yesterday’s success are adequate for tomorrow’s as well.” The example
of Nucor and USX steel companies can be used here to more forcefully illustrate the
underlying error of logic regarding the adequacy of current levels of investment in