Chapter 11 – Decision Making with a Strategic Emphasis
11–88
11–46 (continued-5)
7. Student answers will likely differ. Below are representative considerations.
Qualitative Considerations
a. safety record—does this differ between the two models?
b. reliability—does this differ between the two models? (in some cases, the
reliability of new models is considerably less than the reliability of older,
more established models)
the relatively high energy consumption needed to build the hybrid
model that, depending on total miles driven, its carbon footprint might
be larger than it is for a related gasoline-powered model.
e. relationship between mpg and lifetime miles driven: ignored thus far in
the analysis is the fact that the latter might be a function of the former.
Our analysis has, in fact, assumed that these two variables are
unrelated (i.e., we assumed in the base case that for both decision
drive more.
Additional Quantitative Considerations
a. what is the estimated useful life for each vehicle? (this would be
important if the buyer intended to use the vehicle beyond the four-year
planning horizon)
b. related to the above point, what is the estimated salvage/disposal value
of each vehicle at the end of the four-year decision horizon?
Chapter 11 – Decision Making with a Strategic Emphasis
11–89
c. related to point b above, what is the estimated salvage value at the end
of each of years 1 through 3? (important as a potential “bail–out”
consideration)
11–46 (continued-6)
d. other operating expenses associated with use of each vehicle (e.g.,
insurance, repairs/maintenance)—how do these compare? In addition,
for the hybrid under consideration, what is the estimated life of the
battery? What is the likelihood that the battery would have to be
driving is done in the city, this is a distinct advantage for the hybrid,
since electric propulsion would be used more frequently in this context.
On the other hand, if most of the driving will be highway driving, the fuel
efficiency of the hybrid relative to the gasoline-powered engine
decreases significantly. Once the hybrid gets to highway speed it is
being propelled mostly by the gasoline engine.
Chapter 11 – Decision Making with a Strategic Emphasis
11–90
11–47 Decision-Making (Cognitive) Biases (40-45 min)
1. The term “cognitive bias” refers to factors that distort reasoning in
business, that is, that diminish the quality of decisions. Such biases, it is
maintained, result from the fact that in the real world managers often rely
errors and biases, of the sort discussed in this article.
2. The decision-making context used as the basis of discussion in this
article is a manager/executive who must make a decision based on
recommendations to him/her from a decision-making team. The article
checklist is designed to allow the manager/executive to detect 12 different
cognitive biases.
3. The three major categories comprising the checklist are:
4. Specific questions within each of the three major categories on the
checklist:
Chapter 11 – Decision Making with a Strategic Emphasis
11–91
© 2013 by McGraw-Hill Education. This is proprietary material solely for authorized instructor use. Not authorized for sale or distribution in any
manner. This document may not be copied, scanned, duplicated, forwarded, distributed, or posted on a website, in whole or part.
b. Has the team “fallen in love with” its own proposal? Check for what is
called an “affect heuristic” (that is, the tendency of the decision team
to minimize the risks and costs of a proposed course of action that it
11-47 (Continued-1)
favors, and to do the opposite for a proposal it does not favor).
Essentially, this bias is rooted in emotional effects.
c. Check for “groupthink,” that is, the tendency of a team to minimize
conflict by converging on a decision/recommendation because it
appears to be gathering support. Thus, it is appropriate to ask: “Were
there dissenting opinions within the team?”
Questions to be asked of the team making the recommendation
a. Is the proposal/recommendation subject to “saliency bias” (i.e., undue
reliance on an analogy to a memorable success—a salient analogy)?
As the authors note (p. 55), the use of a single or just a few analogies
almost always leads to faulty inferences!
b. Confirmation bias (did the team seek out only evidence that helped
support its recommendation and/or ignore or underweight evidence
of sensitivity analysis.
e. Halo effect (“guilt by association” or false inferences based on
reputational effects).
Chapter 11 – Decision Making with a Strategic Emphasis
11–92
11-47 (Continued-2)
f. Sunk-Cost Fallacy/Endowment Effect (people have a tendency to
become committed to a previously selected course of action or
project beyond the point prescribed by a rational/optimal model). This
“escalation of commitment“).
Evaluating the Proposal Itself
a. Is the base-case scenario overly optimistic? Does the proposal
include potential competitor reactions?
b. The “disaster effect”: is the worst-case scenario overly optimistic (i.e.,
Source: D. Kahneman, D. Lovallo, and O. Sibony, “Before You Make
That Big Decision…,” Harvard Business Review, June 2011, pp.
51–60.
Chapter 11 – Decision Making with a Strategic Emphasis
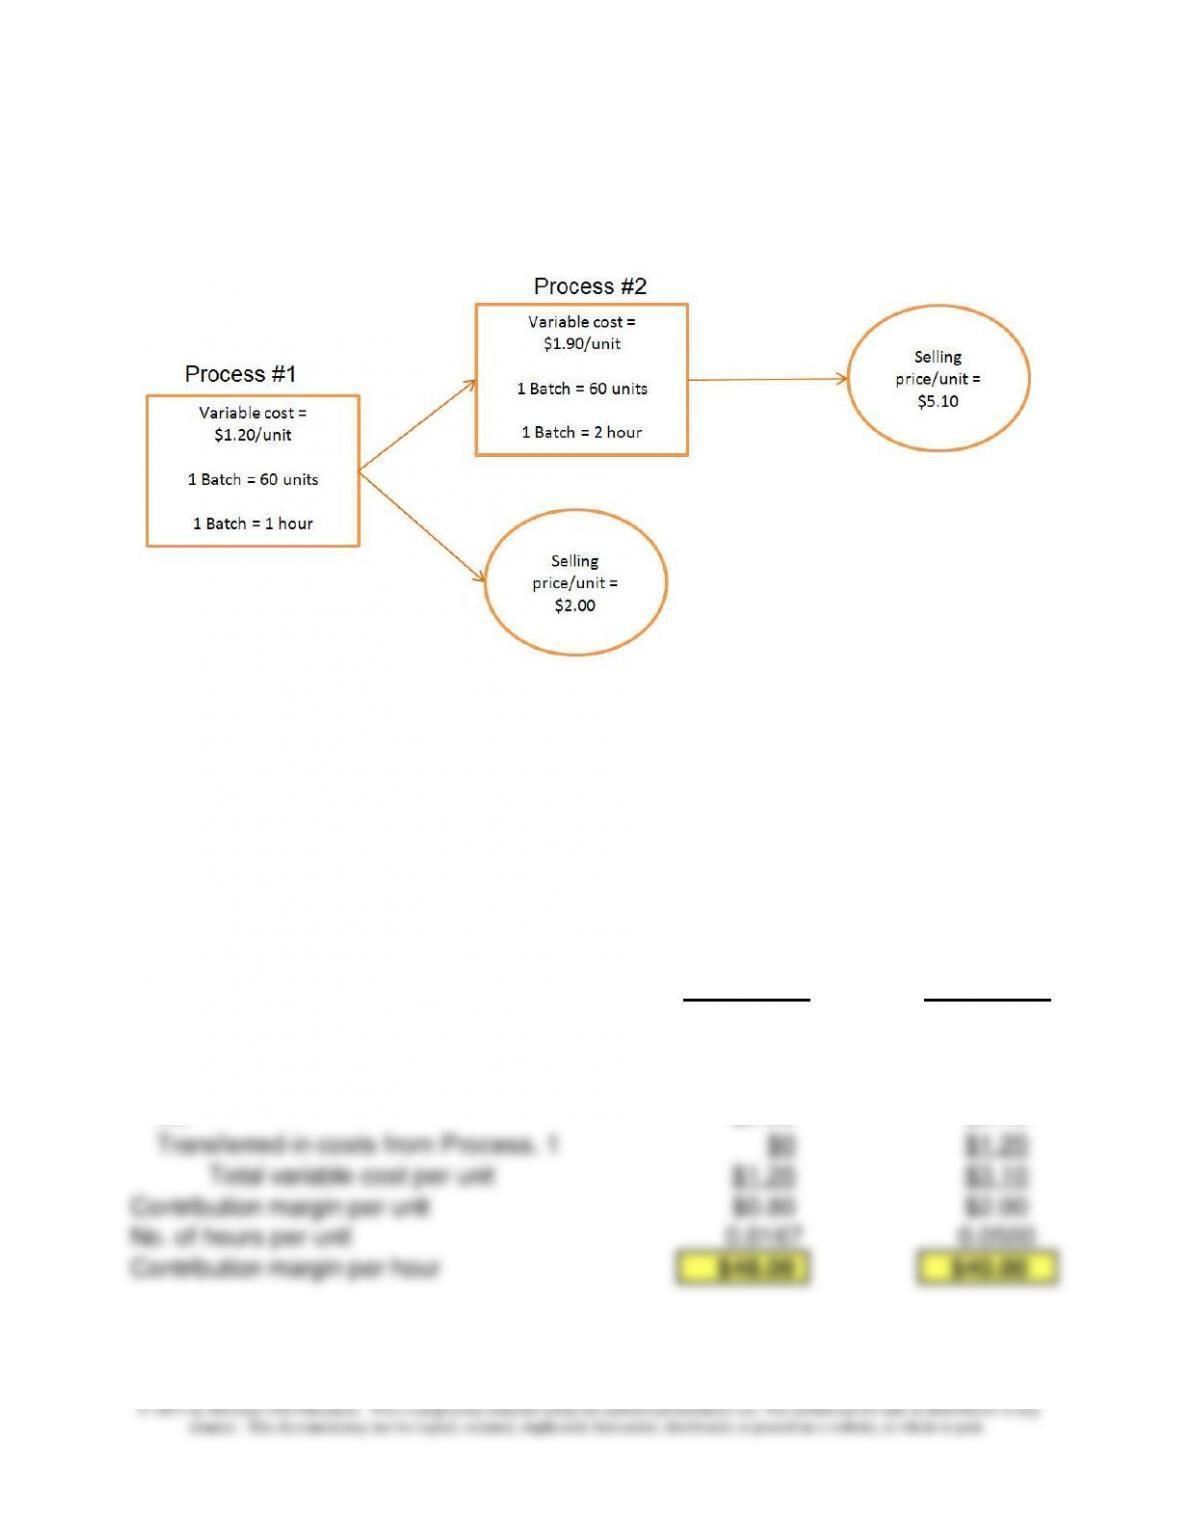
Process. 1 Process. 2
Net selling price per unit $2.00 $5.10
Less: Variable costs:
DM $1.00 $1.50
DL $0.20 $0.40
Transferred-in costs from Process. 1 $0 $1.20
Contribution margin per unit $0.80 $2.00
No. of hours per unit 0.0167 0.0500
Contribution margin per hour $48.00 $40.00
11–48 Sell-or-Process-Further Decision (50-60 min)
1. Schematic Diagram: Two-Stage Process
Note: The problem states that mfg. overhead is entirely fixed; as such, it is
considered a sunk cost with respect to the sell–or-process further decision.
Incremental costs and revenues are reflected in the above diagram.
2. Since the number of processing hours is limited (i.e., is a scarce
resource), the short-term objective would be to maximize the contribution
margin per hour of processing time. Data in this regard for each of the two
products are as follows:
Chapter 11 – Decision Making with a Strategic Emphasis
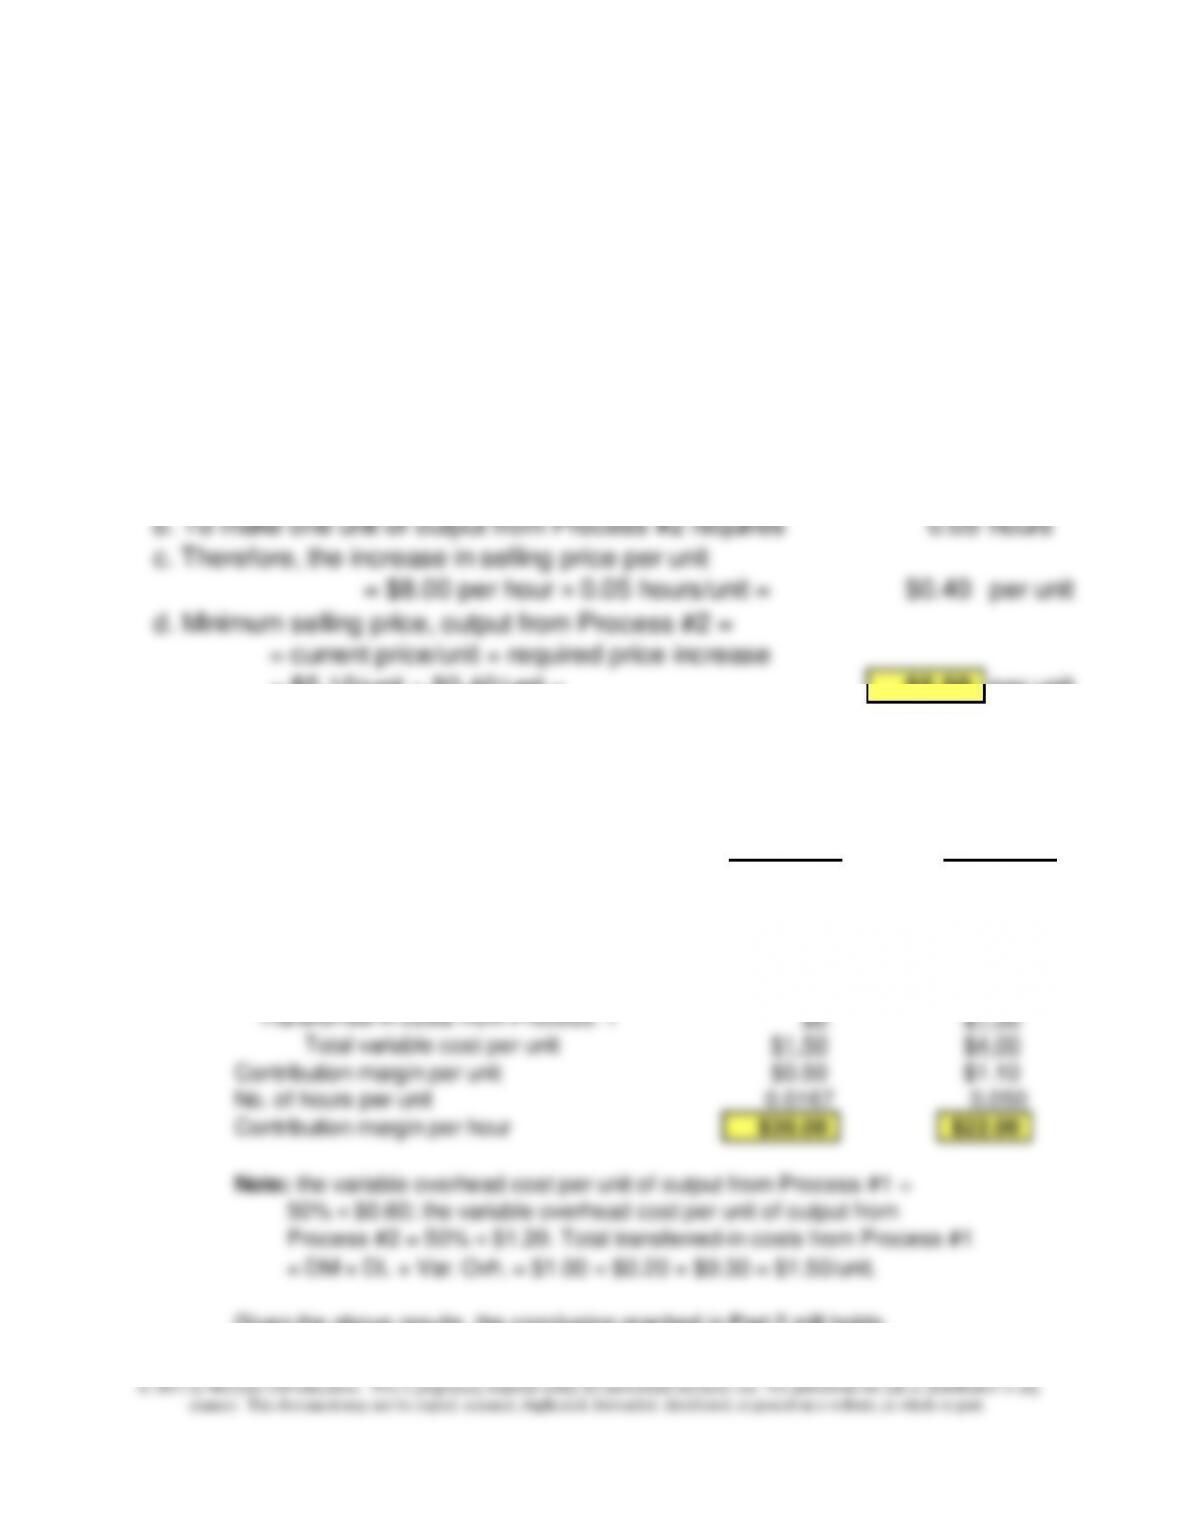
4. Assume that 50% of the total overhead costs are variable. To determine whether the
answer to Part 2 or Part 3 changes, we need to recalculate the contribution margin
per hour for each product, as follows:
Process. 1 Process. 2
Net selling price per unit $2.00 $5.10
Less: Variable costs:
DM $1.00 $1.50
DL $0.20 $0.40
Variable overhead (50%) $0.30 $0.60
Transferred-in costs from Process. 1 $0 $1.50
11-48 (Continued-1)
Thus, on a contribution margin per processing hour basis, Process #1
output is more profitable than output from Process #2. Short-run
operating income would be maximized if all available hours were used
to produce Process #1 output.
3. The selling price from Process #2 output must increase to $5.50 (from $5.10),
as follows:
a. The required increase in profitability per processing hour
= $48.00 − $40.00 = $8.00 per hour
b. To make one unit of output from Process #2 requires 0.05 hours
c. Therefore, the increase in selling price per unit
= $8.00 per hour × 0.05 hours/unit = $0.40 per unit
d. Minimum selling price, output from Process #2 =
= current price/unit + required price increase
= $5.10/unit + $0.40/unit = $5.50 per unit
Chapter 11 – Decision Making with a Strategic Emphasis
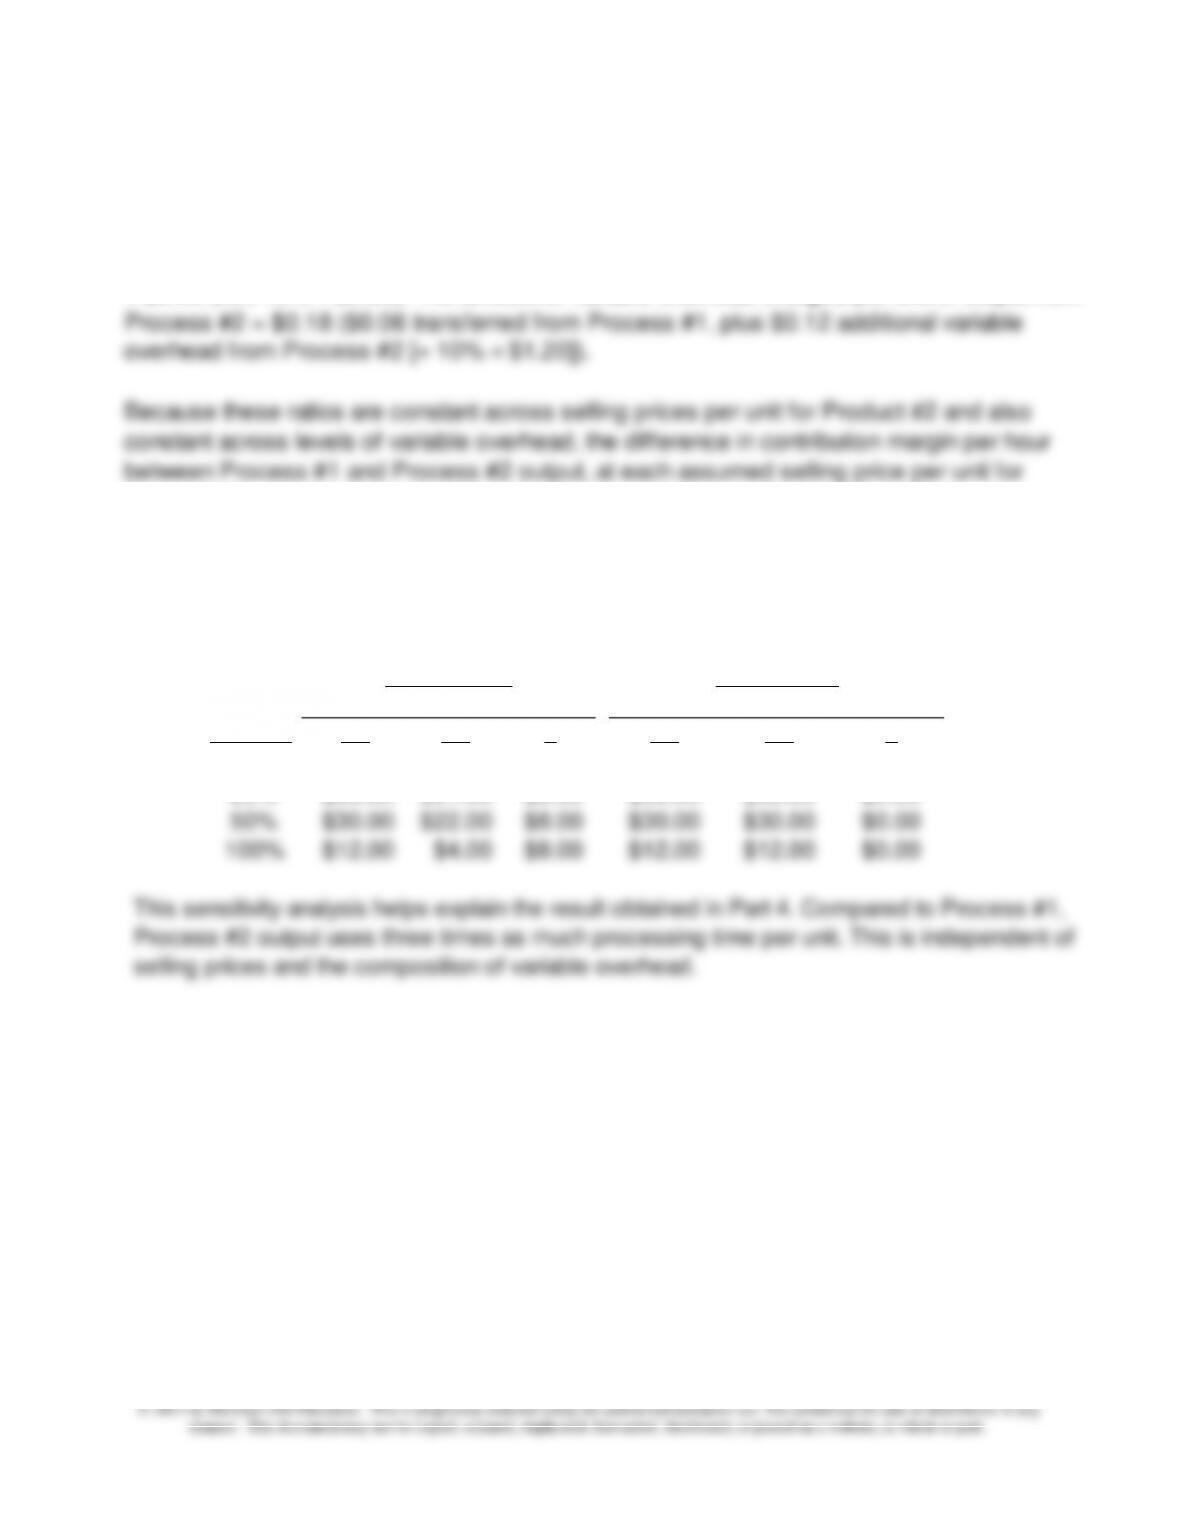
5. Sensitivity analysis: look at the difference in contribution margins per hour under different
selling prices per unit of Process #2 output and for different variable overhead cost
percentages.
% VOH P1 P2 ∆P1 P2 ∆
0% $48.00 $40.00 $8.00 $48.00 $48.00 $0.00
25% $39.00 $31.00 $8.00 $39.00 $39.00 $0.00
50% $30.00 $22.00 $8.00 $30.00 $30.00 $0.00
100% $12.00 $4.00 $8.00 $12.00 $12.00 $0.00
This sensitivity analysis helps explain the result obtained in Part 4. Compared to Process #1,
Process #2 output uses three times as much processing time per unit. This is independent of
selling prices and the composition of variable overhead.
CM/hour
CM/hour
@$5.50/unit
@$5.10/Unit
Further, the amount of variable overhead charged per unit of Process #2 output is always
three times as much variable overhead charged per unit of output from Process #1. For
example, if variable overhead % = 10, then the variable overhead per unit of Process #1 output
= $0.06 (i.e., 10% × $0.60). The amount of variable overhead charged per unit of output from
Process #2 = $0.18 ($0.06 transferred from Process #1, plus $0.12 additional variable
overhead from Process #2 [= 10% × $1.20]).
Because these ratios are constant across selling prices per unit for Product #2 and also
constant across levels of variable overhead, the difference in contribution margin per hour
between Process #1 and Process #2 output, at each assumed selling price per unit for
Process #2 output, will be constant and independent of the proportion of total overhead
that is variable.
11–48 (Continued-2)
Chapter 11 – Decision Making with a Strategic Emphasis
11–96
Check Figures: Chapter 11
11–21 2. $8.00 per unit; 4. Opportunity cost = $75,000
11–22 1. Difference = $30,000 (in favor of not accepting the special order); 2. Minimum
11–29 No check figure available.
11–30 a. Relevant cost to produce the product = $62.00 per unit; savings by producing
internally = $4,000; b. Difference in favor of the re-machining alternative =
$2,500; c. Difference in favor of refurbishing the boat = $8,000; d. Product A
should be processed further ($12,000 incremental benefit); we are indifferent as
to whether Product B should be processed further; e. $3.00 per-unit cost
Chapter 11 – Decision Making with a Strategic Emphasis
11–97
11–37 1. Savings if parts are purchased = $15,440 (relevant cost to make = $17.97 per
unit; relevant cost to purchase = $17.4875 per unit)
11–38 Non-discounted five-year cost advantage in favor of the Naftel contract =
$738,720; Scenario B = $707,840; Scenario C = $680,180.
11–42 1. To close the budget gap would require the following increases in sales
volumes: Gliders, 1,400 units; Chair-and-Stool Sets, 1,100 units; if this were
accomplished, total contribution margins would increase by $30,100 and
$10,038, respectively; given the cost of prizes ($16,500 and $12,500,
Contribution Margin per Relative Machine Hour: No Frills Model = $13.00;
Standard Model = $11.50; Super Model = $13.50.
11–45 1. 17 units of Premier Cuisine and 29 units of Haute Cuisine (total Contribution
Margin = $5,429); 3. 45 units of Premier Cuisine and 10 Units of Haute Cuisine
(total Contribution Margin = $7,750).
11–46 1. Lifetime cost function, regular model: Lifetime cost (Y) = $17,000 + (2,608.7
11–98
0.380 (for gas-powered car) and 0.325 (for Hybrid model); 6. Expected value
calculations (lifetime miles = 60,000): Hybrid = $27,360; Gas-Power Car =
$27,401
11–47 No check figure
11–48 2. Contribution margin per processing hour: Process #1 = $48.00; Process #2 =
$40.00; 3. required selling price per unit, output from Process #2 = $5.50; 4.
Revised contribution margins per hour: Process #1 output, $30.00; Process #2