Chapter 11 – Decision Making with a Strategic Emphasis
11–61
future service demand? (Would negative media coverage reduce
demand?)
• Does the existing cleaning compound create a hazardous work
environment for employees (the problem is silent on this issue)?
• If the existing cleaning compound is considered hazardous to
employee well-being, is there an effect on employee absenteeism?
• Duncan’s business essentially consists of two service lines/segments:
emission requirements?
Chapter 11 – Decision Making with a Strategic Emphasis
11–62
11–40 Profitability Analysis; Excel (80 min)
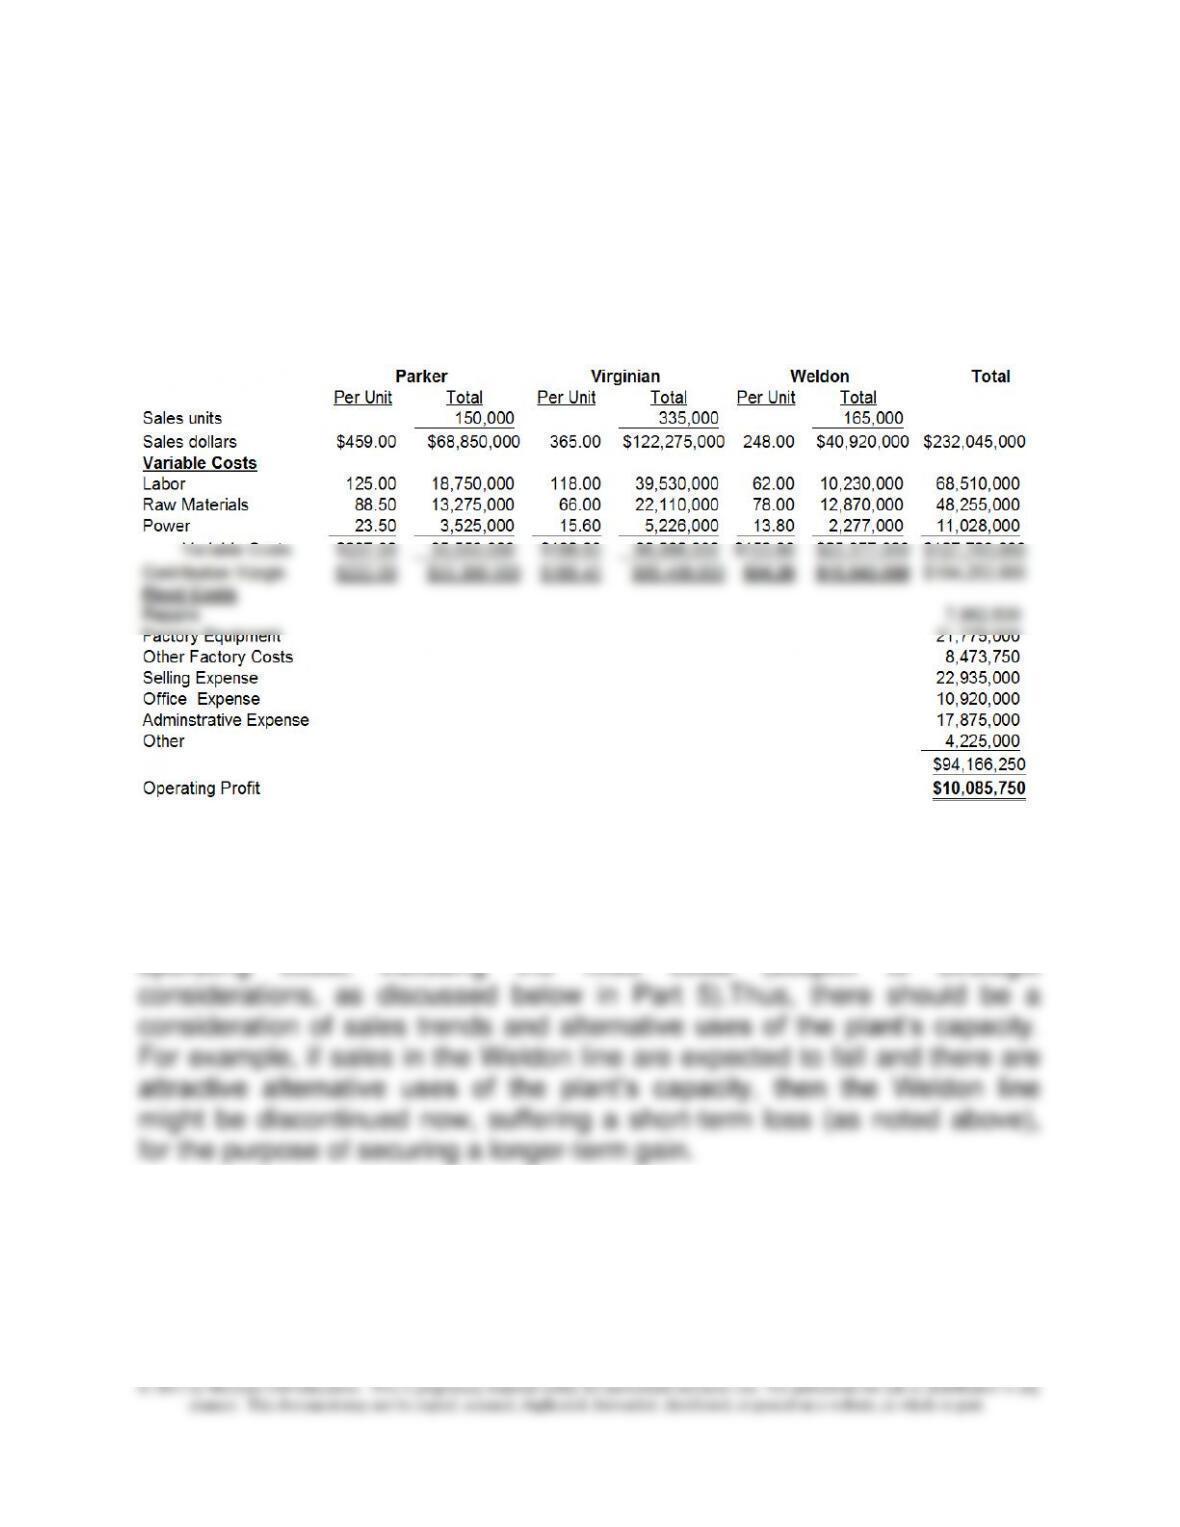
1. The profit report Hal is using is not contribution-based, so the first step
is to produce a contribution income statement for the three product lines, as
shown below. Note that fixed costs are not allocated to the product lines
since they are irrelevant to the short-term profitability analysis.
The analysis shows that all three lines have a positive contribution margin,
including the Weldon line. The short-term financial effect of dropping the
Weldon line would be the loss of $15,543,000 contribution. For a longer-
term perspective, Hal should expect the Weldon product to cover the full
operating costs, including the fixed costs (subject to strategic
Chapter 11 – Decision Making with a Strategic Emphasis
11–63
2. Since the Weldon product has a positive contribution margin of $94.20
per unit, the total contribution margin will be positive irrespective of the
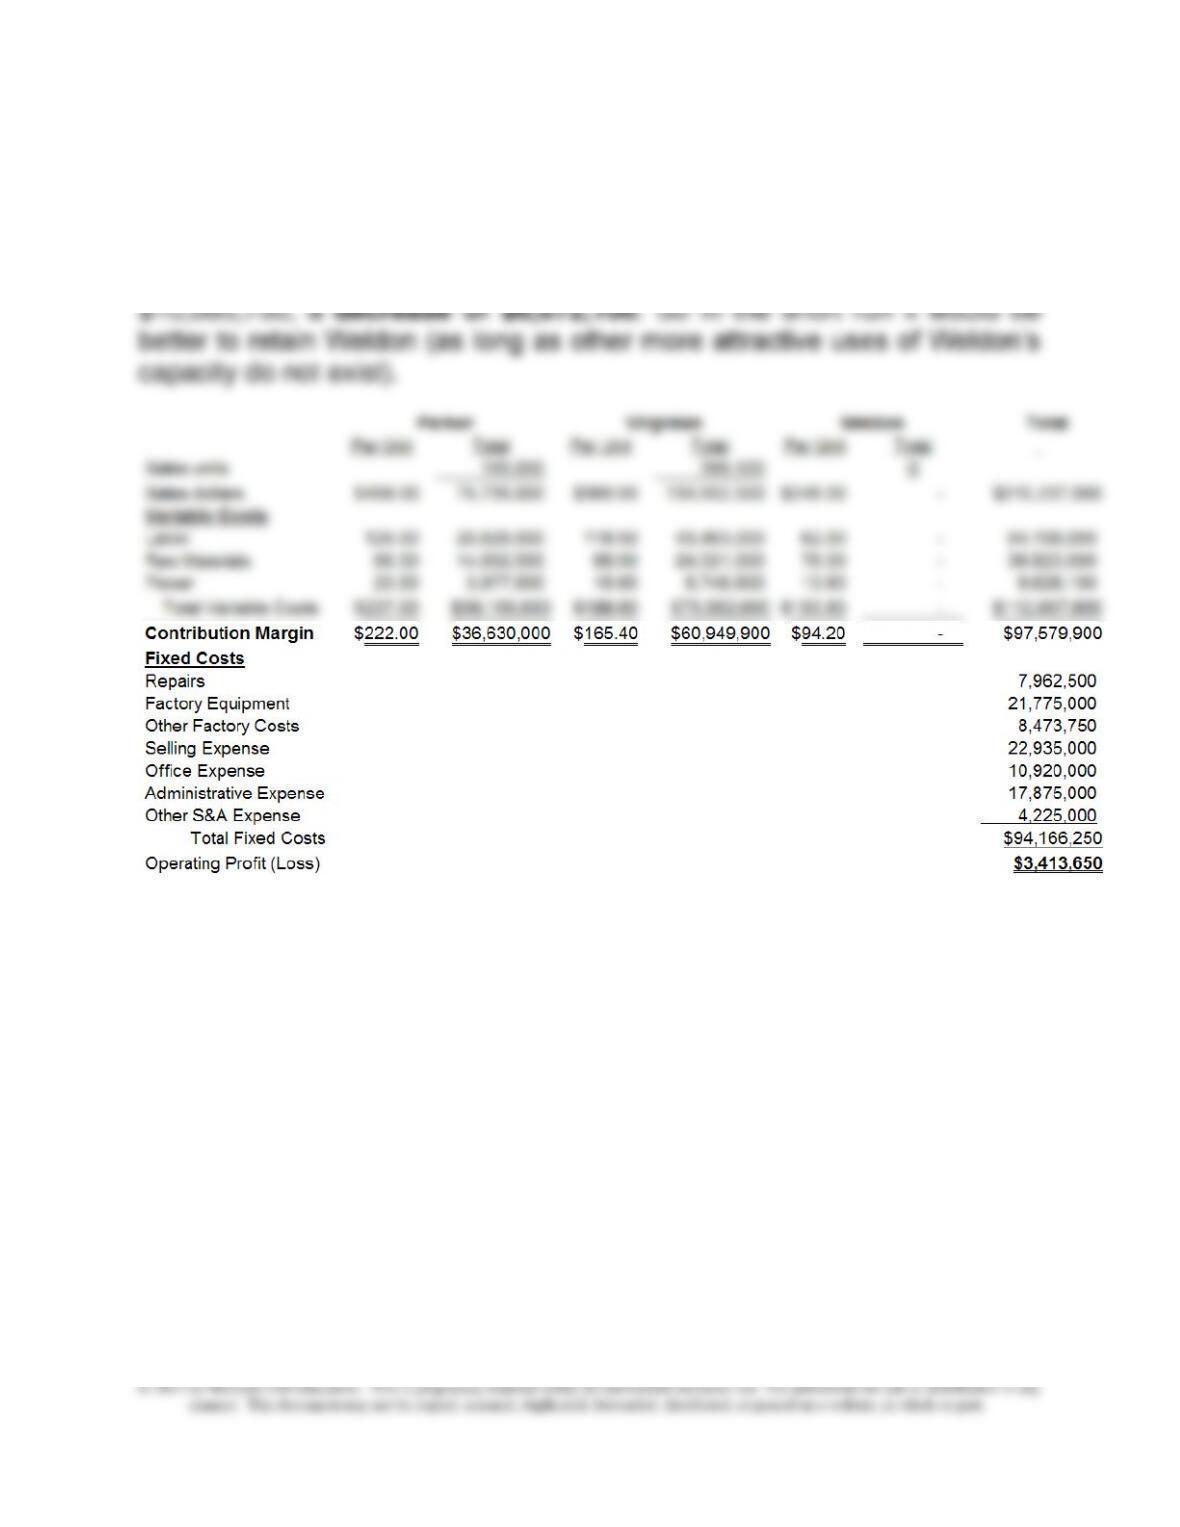
Chapter 11 – Decision Making with a Strategic Emphasis
11–64
11-40 (continued-1)
3. The 10% sales increase has total sales of 165,000 units for Parker and
368,500 units for Virginian. The analysis for dropping Weldon is as follows.
The new total profit of $3,413,650 falls short of the profit with Weldon,
4. Required increase in sales from the Parker line (to compensate
elimination of Weldon line):
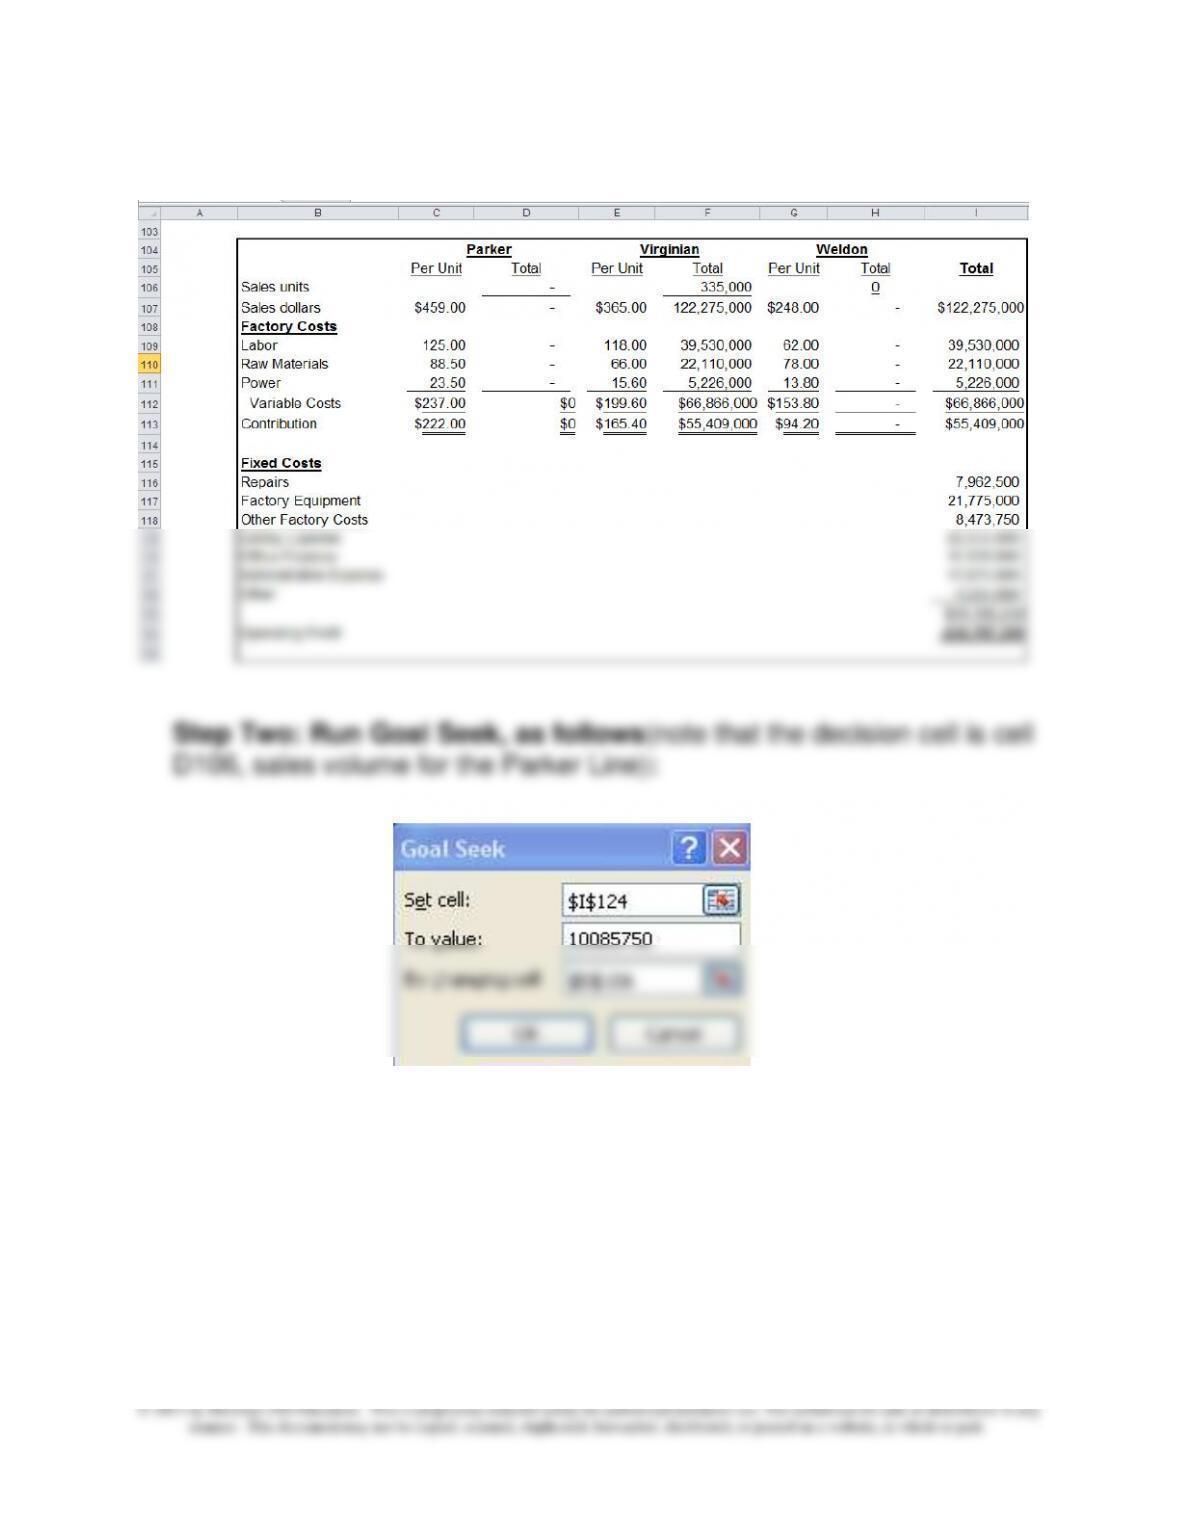
Step One: Create the Contribution Income Statement in Part 3 above.
(That spreadsheet occupied B104:I124.) Enter a zero into cell D106 and
335,000 into cell F106. Afterwards, you should see the following:
Chapter 11 – Decision Making with a Strategic Emphasis
11–65
11-40 (continued-2)
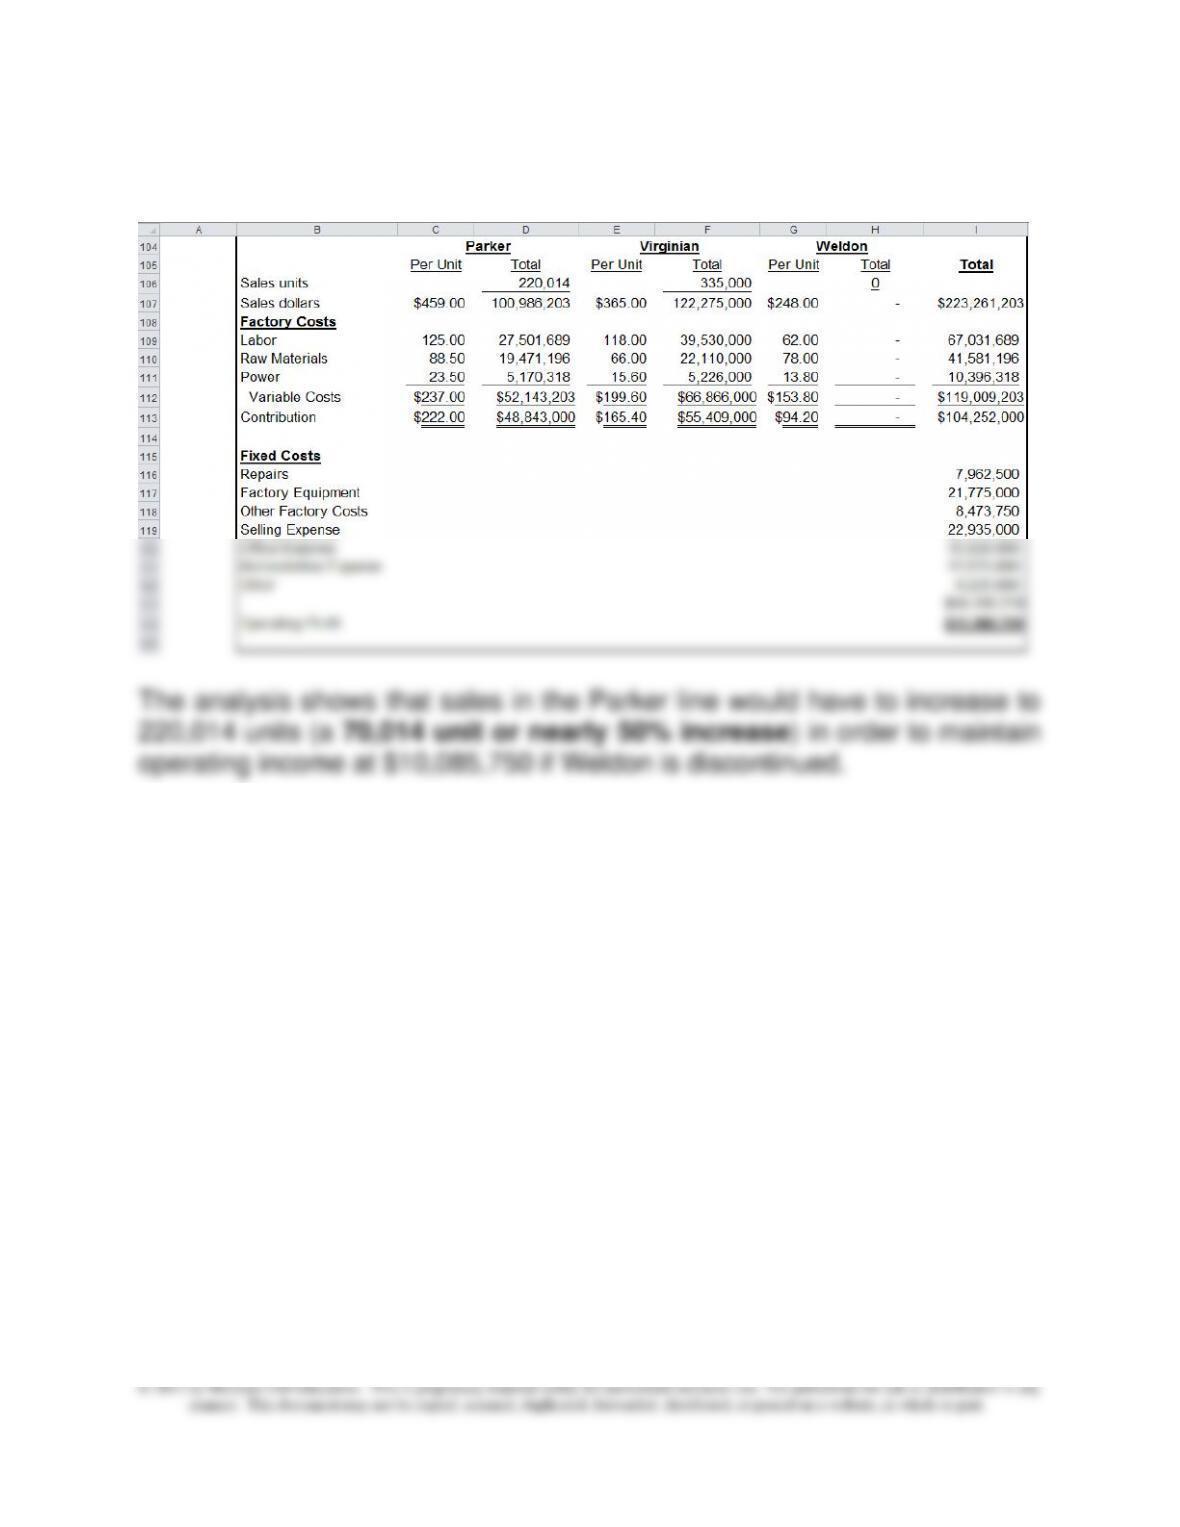
Step Three: Results (see below)
Chapter 11 – Decision Making with a Strategic Emphasis
11–66
11–40 (continued-3)
5. HPF competes on the basis of quality and innovation, a differentiation
strategy. The decision about the Weldon line should therefore include how
the line contributes to the firm’s image of quality and innovation. Will the
loss of the line cause HPF’s customers to reduce their perceptions of
HPF’s quality and innovation?
11–67
11–41 Profitability Analysis (45 min)
1. First, calculate the contribution margin per unit for traffic and commercial
paint.
The first step is to determine the unit cost of latex, as follows:
Traffic Paint: (450 lbs. × $32.00/lb.) ÷ 1,000 gallons = $14.40 per gallon
Commercial Paint: (325 lbs. × $32.00/lb.) ÷ 1,000 gallons = $10.40
per gallon
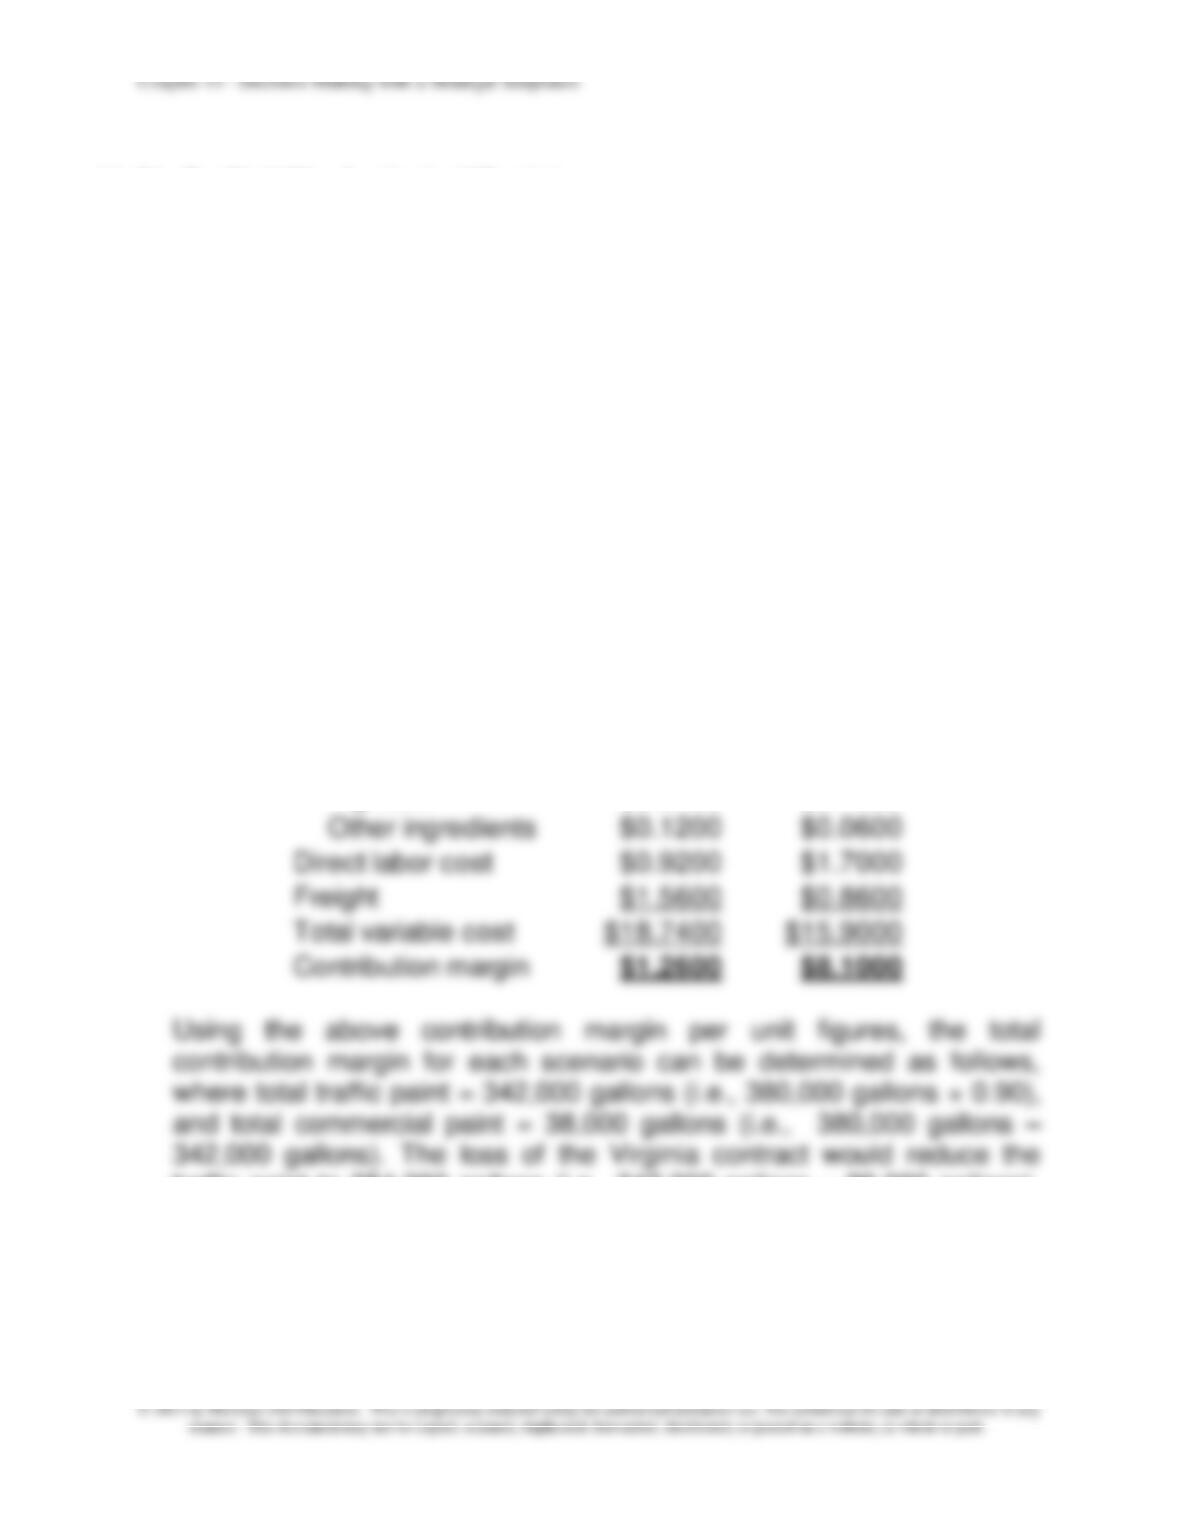
The per-unit contribution margins are then determined as follows:
Traffic Commercial
Selling price/gallon $20.0000 $24.0000
Direct materials costs:
Latex $14.4000 $10.4000
Camelcarb $0.7600 $1.0800
Silica $0.7400 $1.0400
Pigment $0.2400 $0.7600
Other ingredients $0.1200 $0.0600
Direct labor cost $0.9200 $1.7000
Freight $1.5600 $0.8600
Total variable cost $18.7400 $15.9000
Contribution margin $1.2600 $8.1000
Using the above contribution margin per unit figures, the total
contribution margin for each scenario can be determined as follows,
where total traffic paint = 342,000 gallons (i.e., 380,000 gallons × 0.90),
and total commercial paint = 38,000 gallons (i.e., 380,000 gallons –
342,000 gallons). The loss of the Virginia contract would reduce the
traffic paint to 254,000 gallons (i.e., 342,000 gallons – 88,000 gallons).
A doubling of commercial paint (using the promotion) would result in
76,000 gallons (i.e., 38,000 gallons × 2).
Chapter 11 – Decision Making with a Strategic Emphasis
11–68
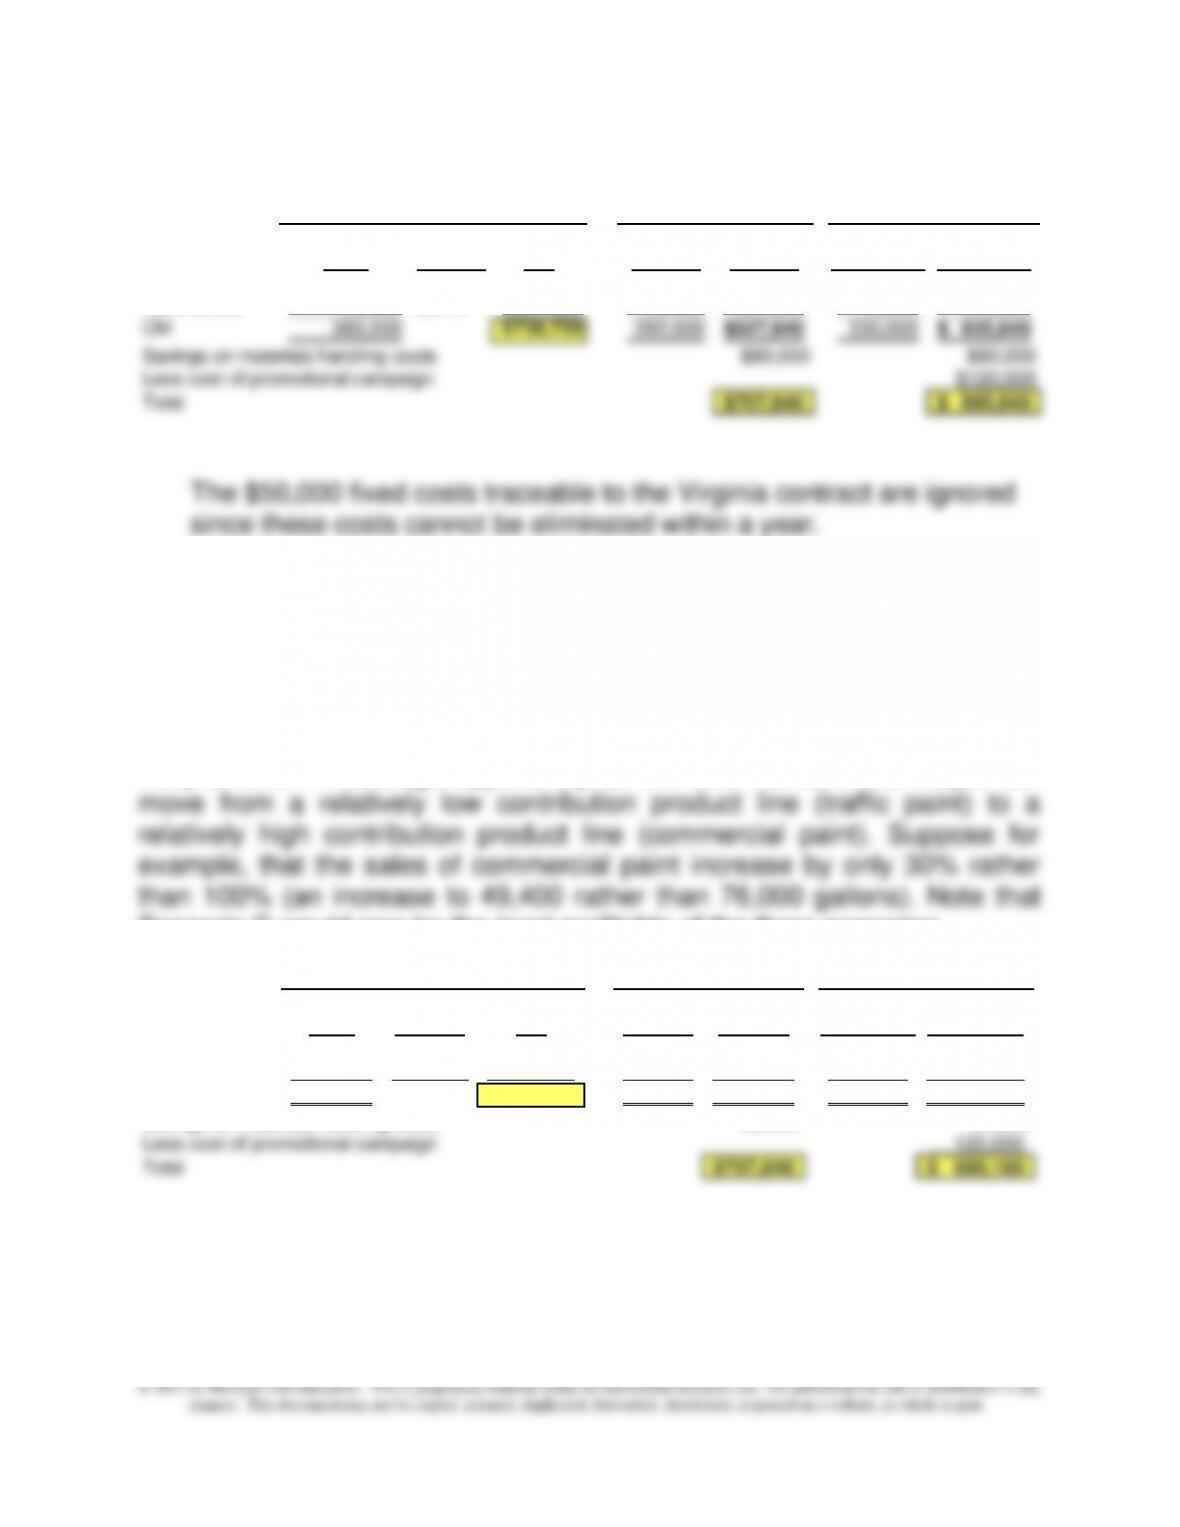
Problem 11-41 (continued-1)
Original Original Units w/o CM w/o Units with CM with
units CM/unit CM Virginia Virginia promotion promotion
Traffic 342,000 $1.26 $430,920 254,000 320,040$ 254,000 320,040$
Commercial 38,000 $8.10 $307,800 38,000 307,800 76,000 615,600
CM 380,000 $738,720 292,000 627,840$ 330,000 935,640$
Savings on materials handling costs $80,000 $80,000
Less cost of promotional campaign $120,000
Total 707,840$ 895,640$
Scenario A
Scenario B
Scenario C
2. The proposed promotional campaign without the Virginia contract,
scenario C, has the greatest contribution margin, as shown in the
calculations above. Strategic issues for the decision between scenario B
and scenario C include the reliability of the projected sales-volume increase
in commercial paint and of the assumption that the volume of commercial
paint can be doubled without increasing fixed costs, other than the cost of
the promotion. A strategic opportunity, on the other hand, is that Meyer can
Scenario C would now be the least profitable of the three scenarios.
Original Original Units w/o CM w/o Units with CM with
units CM/unit CM Virginia Virginia
promotion
promotion
Traffic 342,000 1.2600$ 430,920$ 254,000 320,040$ 254,000 320,040$
Commercial 38,000 8.1000 307,800 38,000 307,800 49,400 400,140
CM 380,000 738,720$ 292,000 627,840$ 303,400 720,180$
Savings on materials handling costs 80,000 80,000
Less cost of promotional campaign 120,000
Total 707,840$ 680,180$
Scenario A
Scenario B
Scenario C
11–69
© 2013 by McGraw-Hill Education. This is proprietary material solely for authorized instructor use. Not authorized for sale or distribution in any
manner. This document may not be copied, scanned, duplicated, forwarded, distributed, or posted on a website, in whole or part.
11–42 Project Analysis: Sales Promotions (45-50 min)
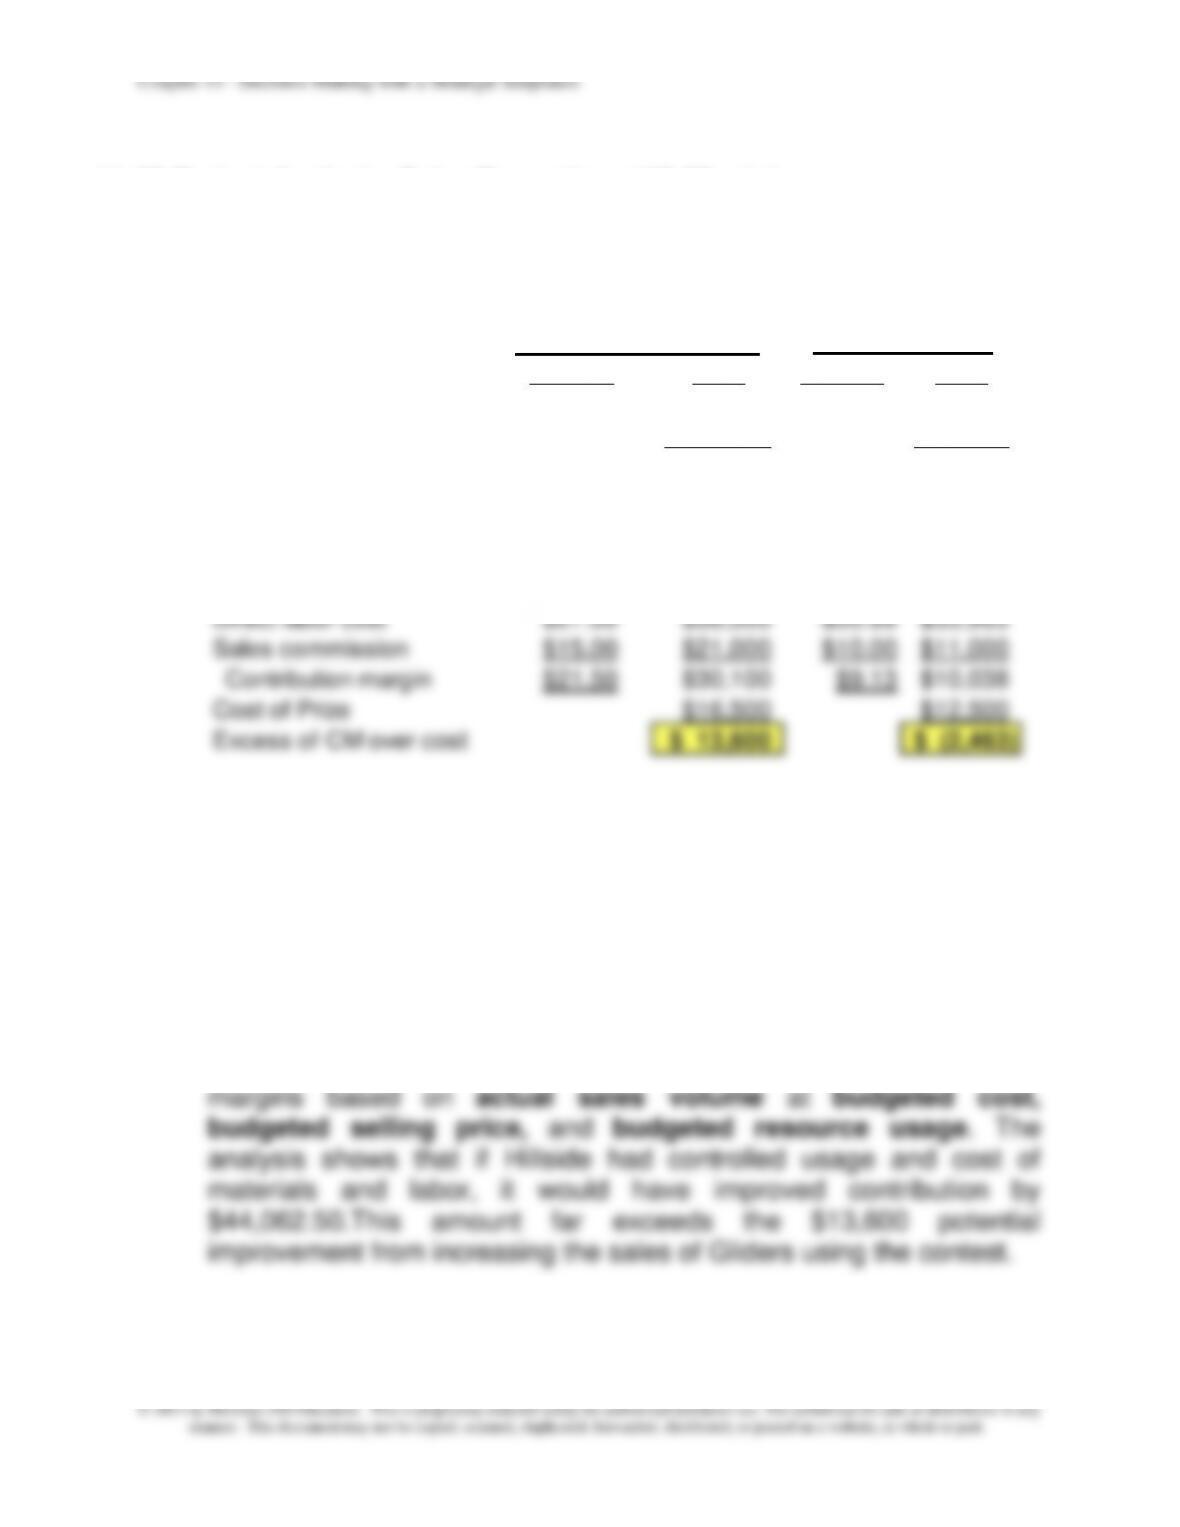
1. The relevant cost analysis follows:
Per Unit Total Per Unit Total
Budgeted Sales 4,000 8,000
Actual Sales 2,600 6,900
Sales Shortfall 1,400 1,100
Sales Value of Shortfall $80.00 $112,000 $61.00 $67,100
Direct material $16.00 $22,400 $11.00 $12,100
Direct labor rate per hr $11.00 $9.50
Direct labor hrs per unit $2.50 $3.25
Direct labor cost $27.50 $38,500 $30.88 $33,963
Sales commission $15.00 $21,000 $10.00 $11,000
Contribution margin $21.50 $30,100 $9.13 $10,038
Cost of Prize $16,500 $12,500
Excess of CM over cost 13,600$ (2,463)$
Second contest:
Chair and Stool
First contest: Gliders
The Glider contest has a $13,600 positive contribution margin net of
the estimated cost of the prize. On the other hand, the Chair-and-
Stool Set contest has a negative contribution of $2,463. Note that the
above solution uses actual rather than budgeted price and cost
information.
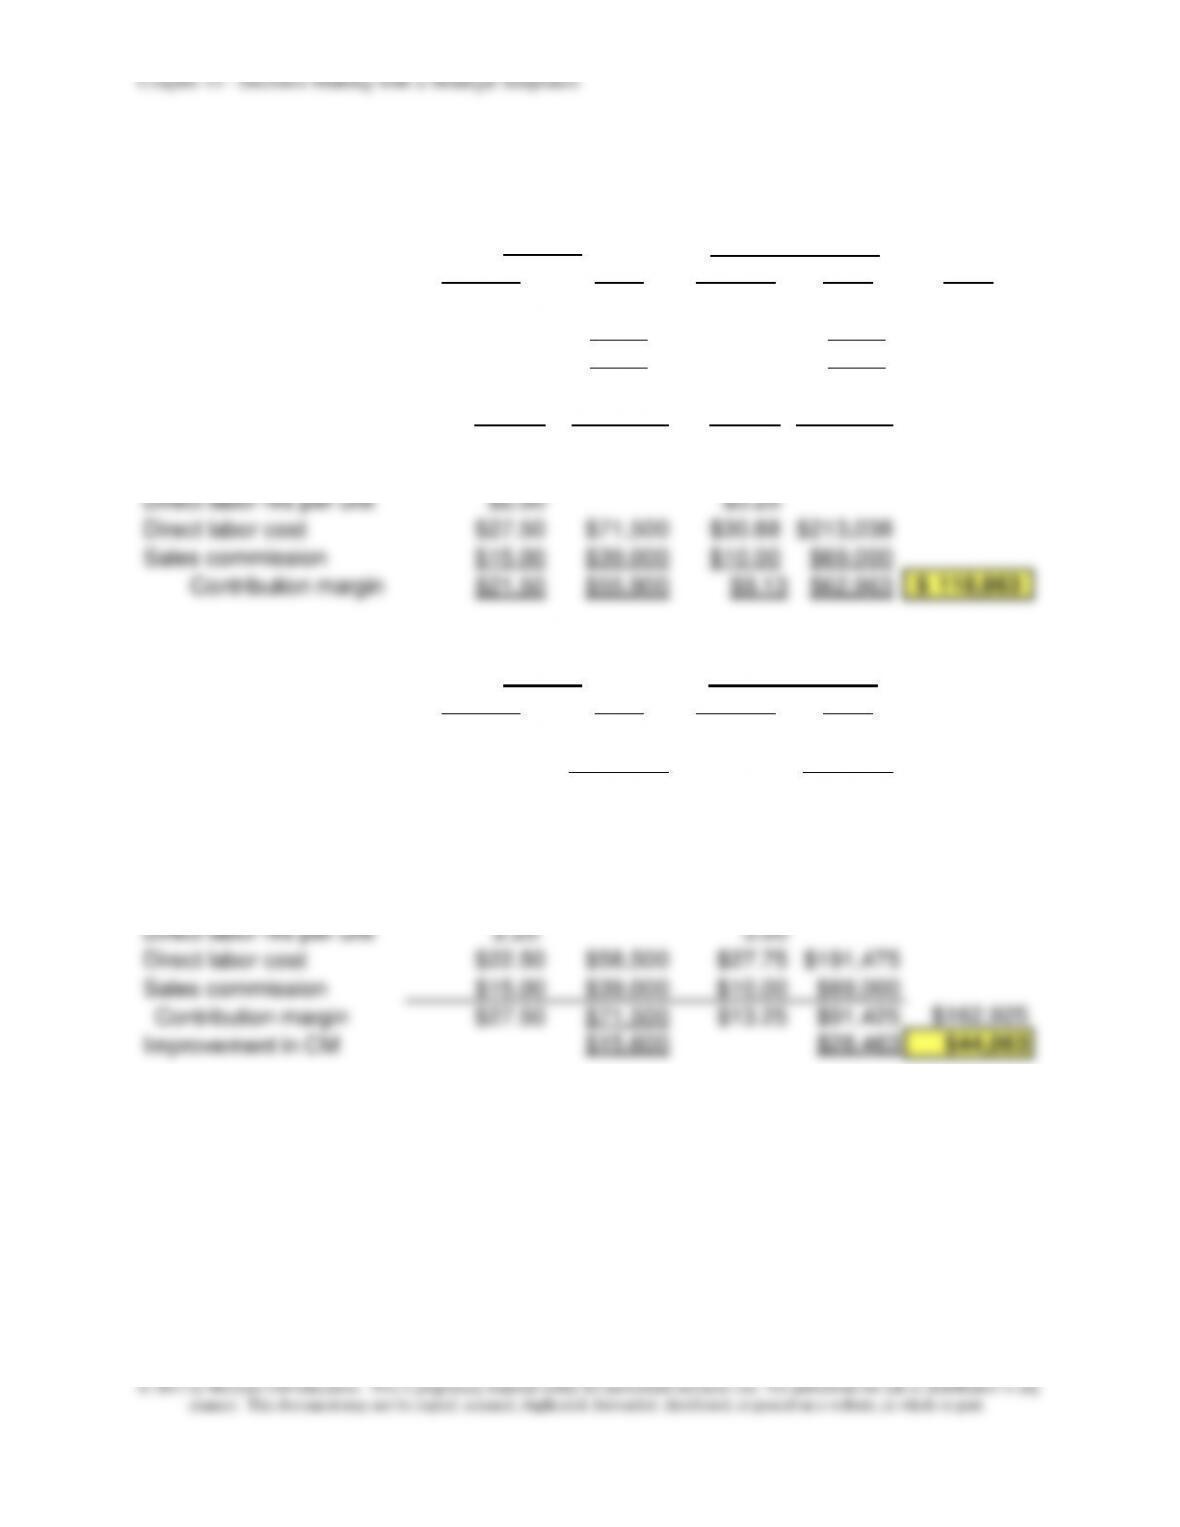
The analysis below compares the contribution margin for each
product based on actual sales volume at actual cost, actual
selling price, and actual resource usage to the product contribution
Thus, strategically, it is important for Hillside to focus on cost
management as well as improving sales.
11–70
11-42 (continued-1)
Based on Actual Sales Volume, Actual Resource Usage, and Actual Cost Data
Per Unit Total Per Unit Total Total
Budgeted Sales 4,000 8,000
Actual Sales 2,600 6,900
Sales Shortfall 1,400 1,100
Actual Sales $80.00 $208,000 $61.00 $420,900
Direct material $16.00 $41,600 $11.00 $75,900
Direct labor rate per hr $11.00 $9.50
Direct labor hrs per unit $2.50 $3.25
Direct labor cost $27.50 $71,500 $30.88 $213,038
Sales commission $15.00 $39,000 $10.00 $69,000
Contribution margin $21.50 $55,900 $9.13 $62,963 118,863$
Gliders
Chair and Stool
Per Unit Total Per Unit Total
Budgeted Sales 4,000 8,000
Actual Sales 2,600 6,900
Sales Shortfall 1,400 1,100
Actual Sales $80.00 $208,000 $61.00 $420,900
Direct material $15.00 $39,000 $10.00 $69,000
Direct labor rate per hr $10.00 $9.25
Direct labor hrs per unit 2.25 3.00
Direct labor cost $22.50 $58,500 $27.75 $191,475
Sales commission $15.00 $39,000 $10.00 $69,000
Contribution margin $27.50 $71,500 $13.25 $91,425 $162,925
Improvement in CM $15,600 $28,463 $44,063
Based on Actual Sales and Budgeted Usage and Cost Data
Gliders
Chair and Stool
Chapter 11 – Decision Making with a Strategic Emphasis
11–71
11–42 (continued-2)
2. Some strategic factors that should be considered:
• The contest appears to reward an increase of sales in units.
However, the average sales price for each product has already
fallen below budgeted levels. If the contest provides an
expected incentive to reduce price in order to increase sales,
then the result could be lower contribution margins than
expected. Moreover, the price cutting could have adverse long-
term effects. Hillside should carefully consider its short-term
and long-term pricing strategy to make sure it is consistent with
• An unintended effect of the sales contests is that certain retail
customers might buy unusually large orders, at the urging of
sales people, and that some portion of these order might
eventually be returned if not sold by the retailer by the end of
the season.
• While sales of the table are over budget, why does the sales
Chapter 11 – Decision Making with a Strategic Emphasis
11–72
11–43 Profitability Analysis; Pro Forma Income Statement (60 min)
1. The dollar value of DimLok’s present annual fixed costs is calculated
as follows:
Profit target based on 20% of annual fixed costs = $ 800,000
Total fixed costs = $800,000 ÷ 0.20 = $4,000,000
2. DimLok must sell 64,000 units in order to achieve both profit
objectives of 20 percent return on fixed costs and $20 per unit sold.
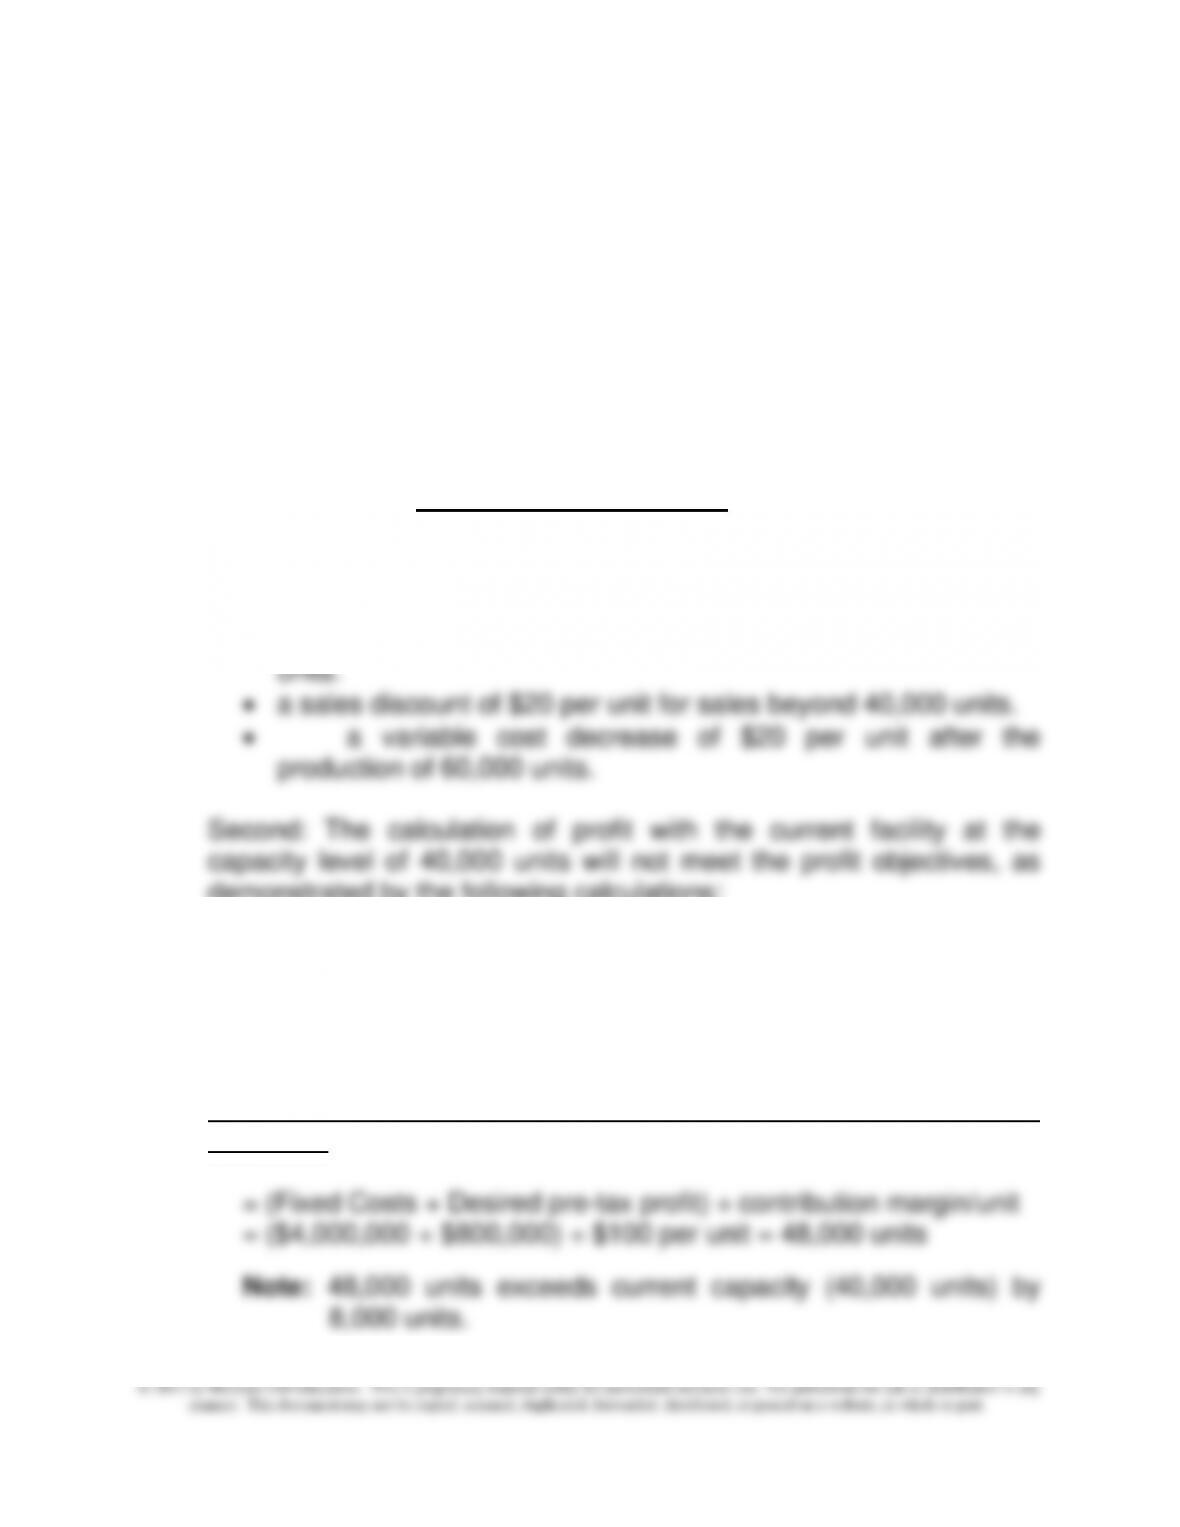
Supporting Calculations
First: The solution must consider the following constraints:
• 40,000 unit capacity for the current facility.
• $1,000,000 additional fixed charge for production up to 80,000
demonstrated by the following calculations:
Contribution margin per unit below the 40,001 unit level
= $200 selling price per unit − ($80 variable cost per unit + $20
profit per unit)
= $100 contribution margin per unit
Calculation of the number of units to achieve the desired profit
objectives
Chapter 11 – Decision Making with a Strategic Emphasis
11–73
11–43 (continued-1)
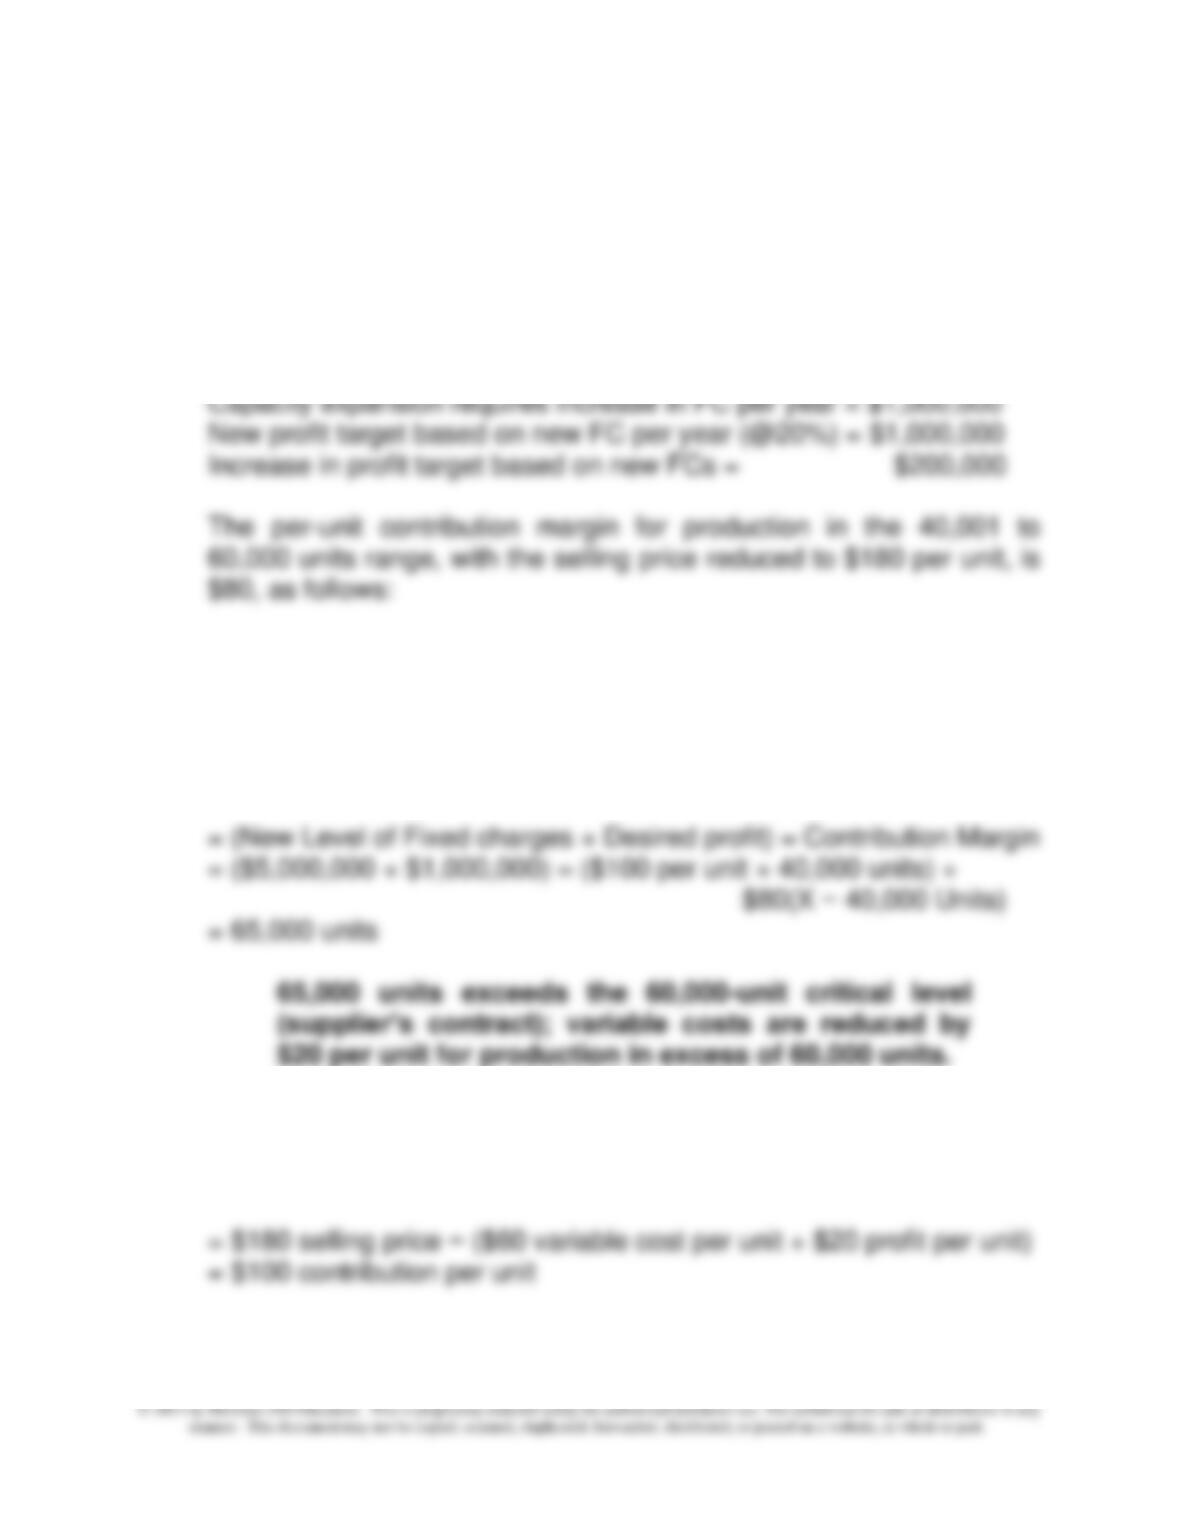
Third: Thus, in order to achieve the profit targets, DimLok must
increase plant capacity, thus incurring an additional $1,000,000 in
fixed costs. This, in turn, increases the profit target based on fixed
costs to a total of $1,000,000 (i.e., 0.20 × [$4,000,000 + $1,000,000]),
as follows:
= $180 selling price − ($80 variable cost per unit + $20 profit per unit)
= $80 contribution margin per unit
Recalculation of the number of units to achieve overall profit
objectives:
Fourth: The contribution margin per unit for production in the 60,000
to 80,000 unit range, with the variable cost per unit reduced to $60
per unit, is determined as follows:
Chapter 11 – Decision Making with a Strategic Emphasis
11–74
11–43 (continued-2)
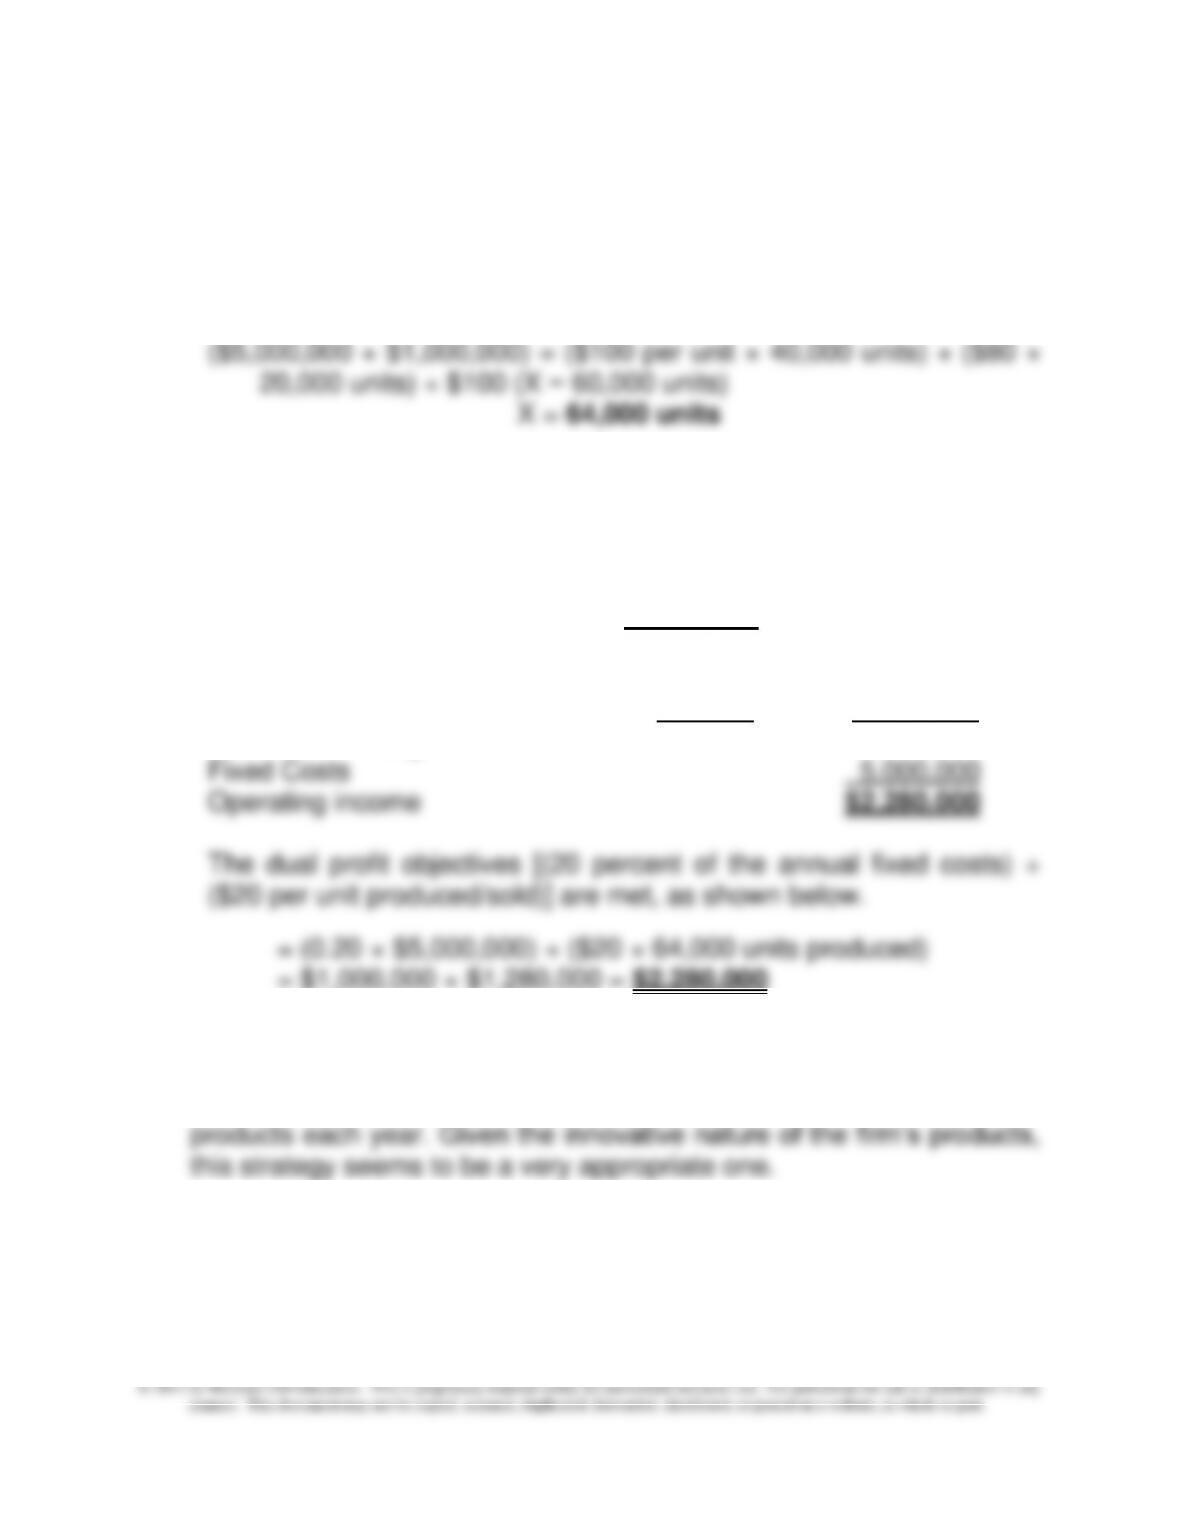
Finally, the calculation of the number of units (X) needed to achieve
overall profit objectives
(Fixed charges + desired profit) = total contribution margin
3. DimLok Division
Pro Forma Income Statement
Revenue
40,000 units × $200/unit = $8,000,000
24,000 units × $180/unit = 4,320,000 $12,320,000
Variable costs
60,000 units × $80/unit = 4,800,000
4,000 units × $60/unit = 240,000 5,040,000
Contribution Margin 7,280,000
4. DimLok has a competitive strategy based on differentiation. The
differentiation is based on the secret process that DimLok has
developed and an advertising program that stresses completely new
5. Critical success factors for DimLok include research and development
(R&D) to maintain the technological advantage of their unique
products, and strong advertising programs to stress the firm’s
differentiation based on innovation. Other strategic success factors to
Chapter 11 – Decision Making with a Strategic Emphasis
11–75
No Frills Standard Super
Model Options Model
Selling price/unit $35 $60 $80
Less: CGS
DM cost/unit $9 $11 $14
DL cost/unit $10 $20 $30
Variable overhead cost/unit $3 $6 $9
maintain product differentiation include quality of production and
customer service.
11–44 Product Profitability Analysis, Scarce Resources (45 min)
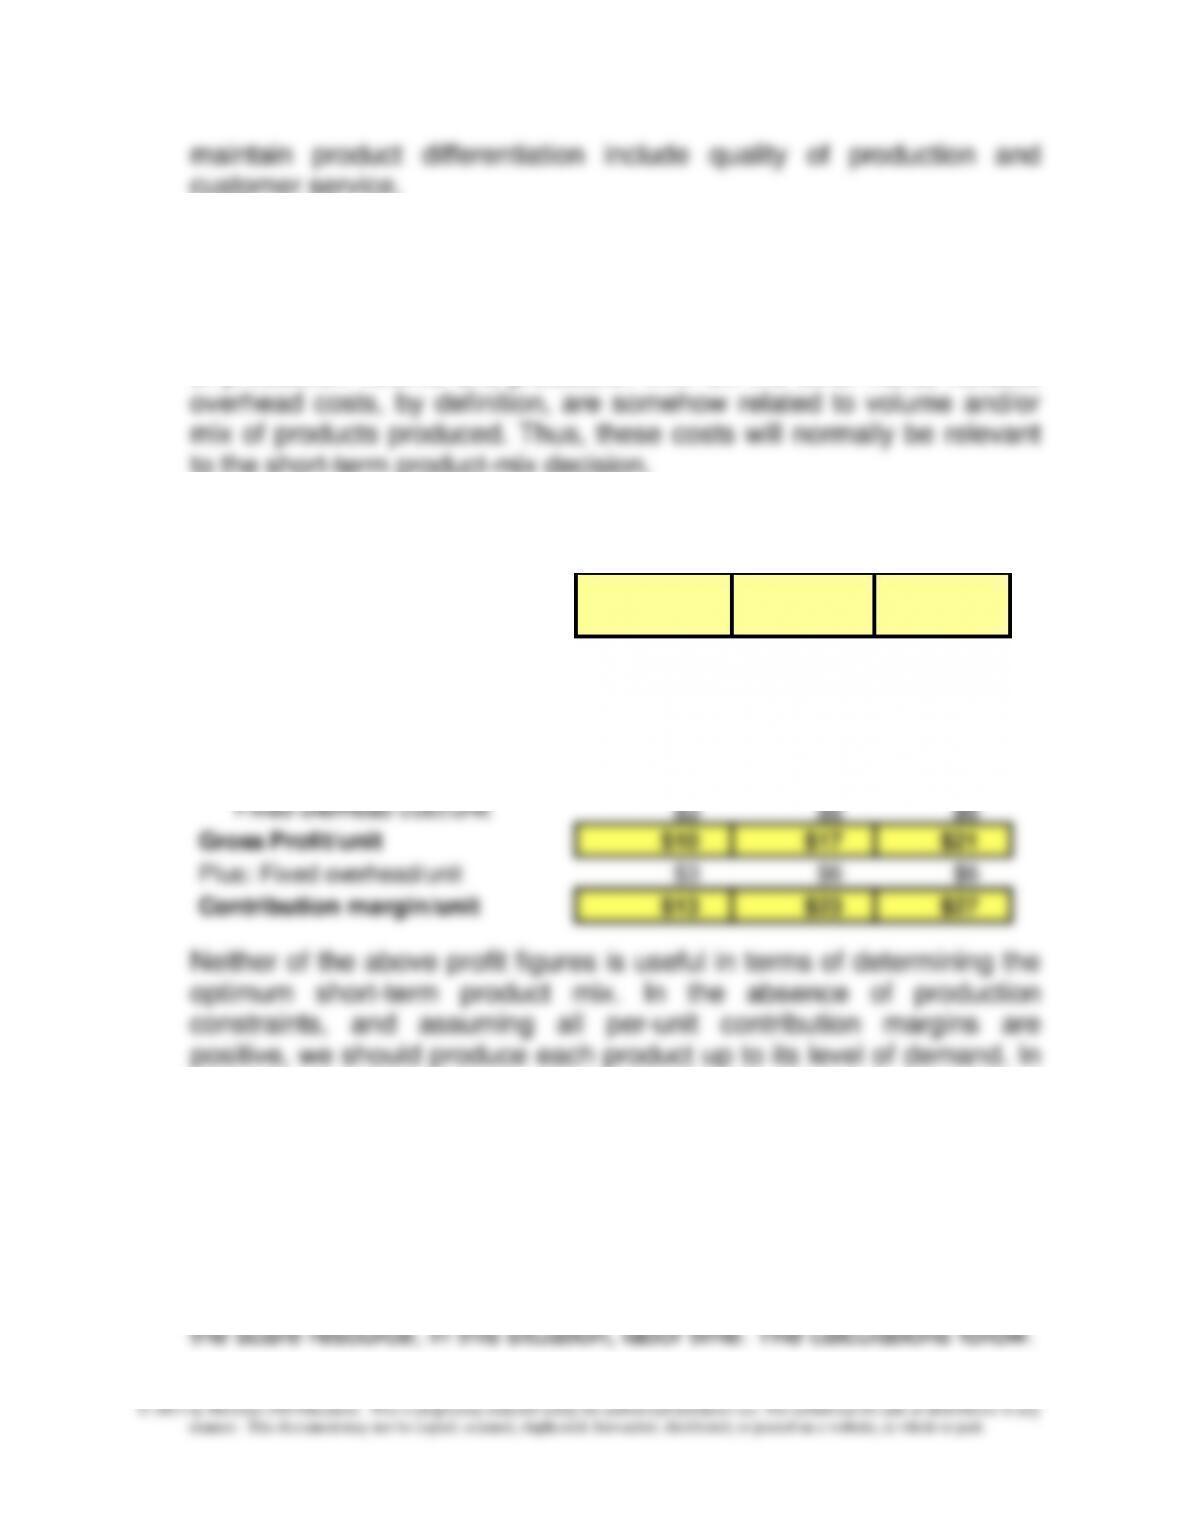
1. Fixed manufacturing overhead costs, in total, are by definition
capacity-related costs and as such are not expected to change in the
short run. Thus, in total, short-term fixed costs should be independent
of production volume and production mix. On the other hand, variable
to the short-term product-mix decision.
2. Gross profit per unit and contribution margin per-unit figures:
the presence of resource constraints (or limitations), logic dictates that
we allocate available resources “to their most profitable use.” In this
case, this means on the basis of the contribution margin per unit of the
scarce resource(s). These amounts are provided in Parts 3 and 4
below.
3. In the presence of a single resource constraint, we should focus on
those products that provide the greatest contribution margin per unit of