Chapter 11 – Decision Making with a Strategic Emphasis
11–16
11–26 Sell or Process Further; Product Mix (30-40 min)
1. The key is to identify the relevant costs and revenues associated with
any GR37 diverted for production of SilPol (silver polish).
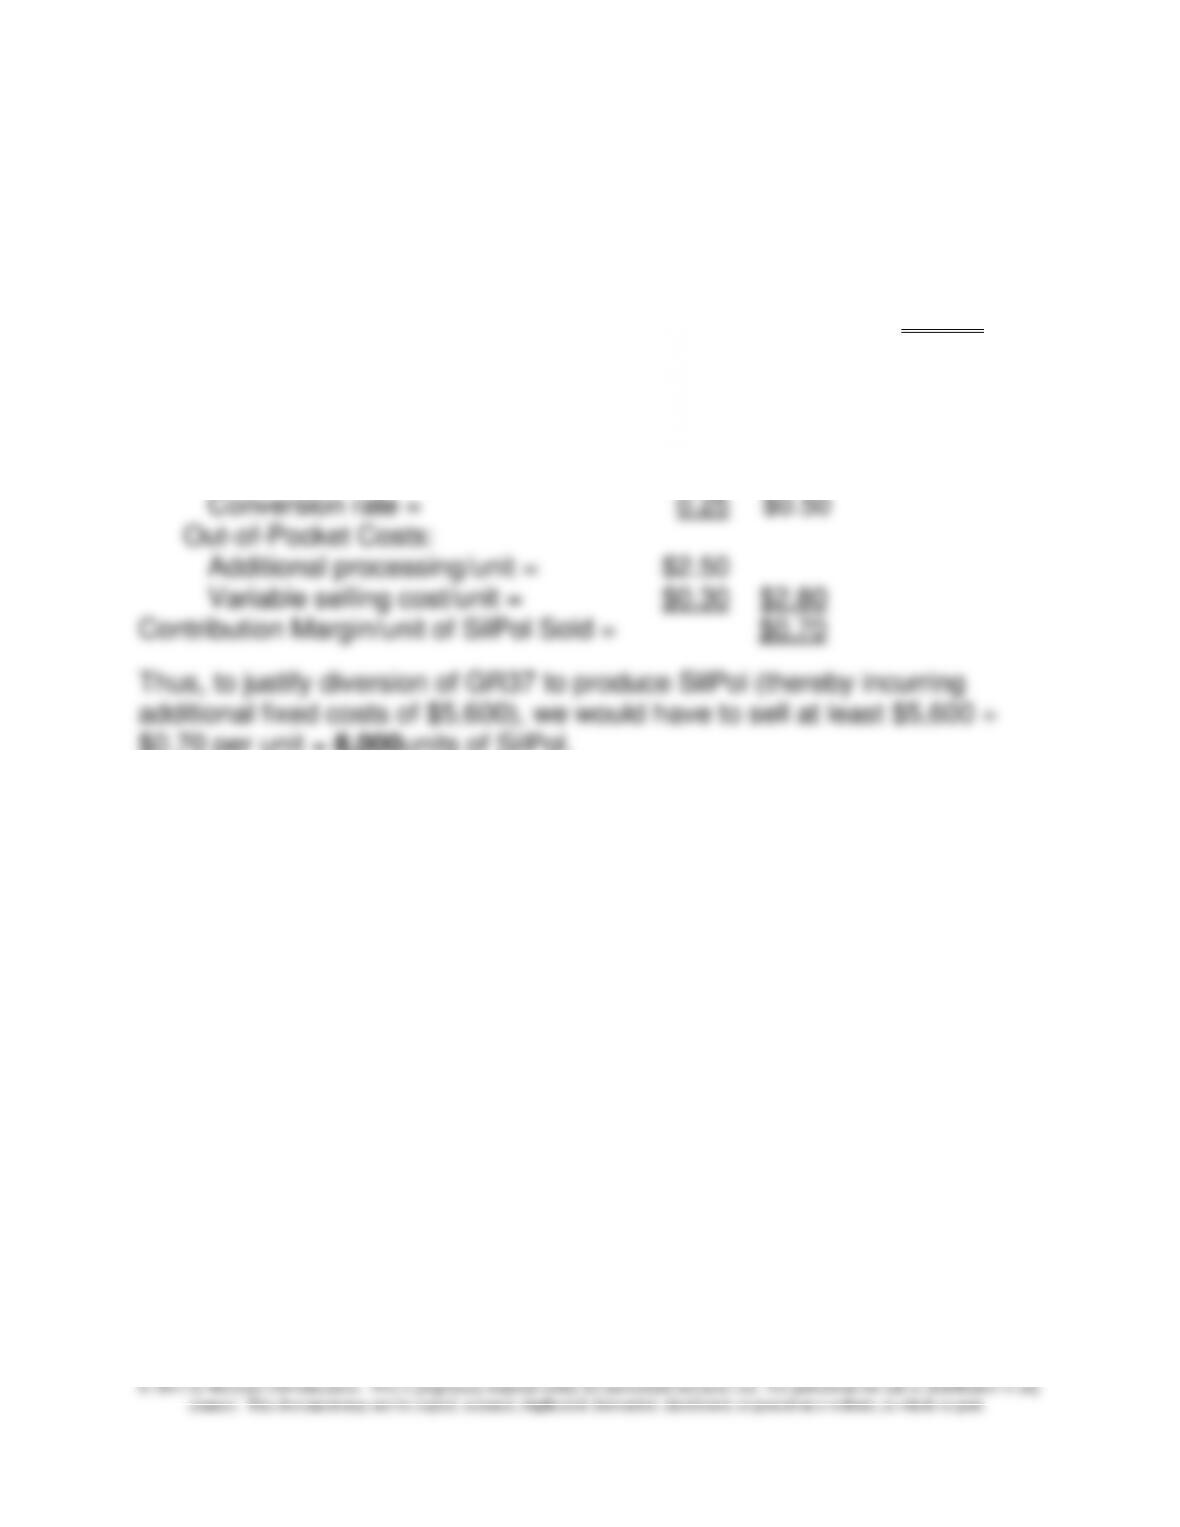
Incremental Fixed Costs (SilPol) = $5,600
Incremental Contribution Margin/Unit Sold:
Selling price per unit = $4.00
Less: Relevant Costs:
Opportunity cost: lost revenue from GR37:
GR37 selling price/pound = $2.00
$0.70 per unit = 8,000units of SilPol.
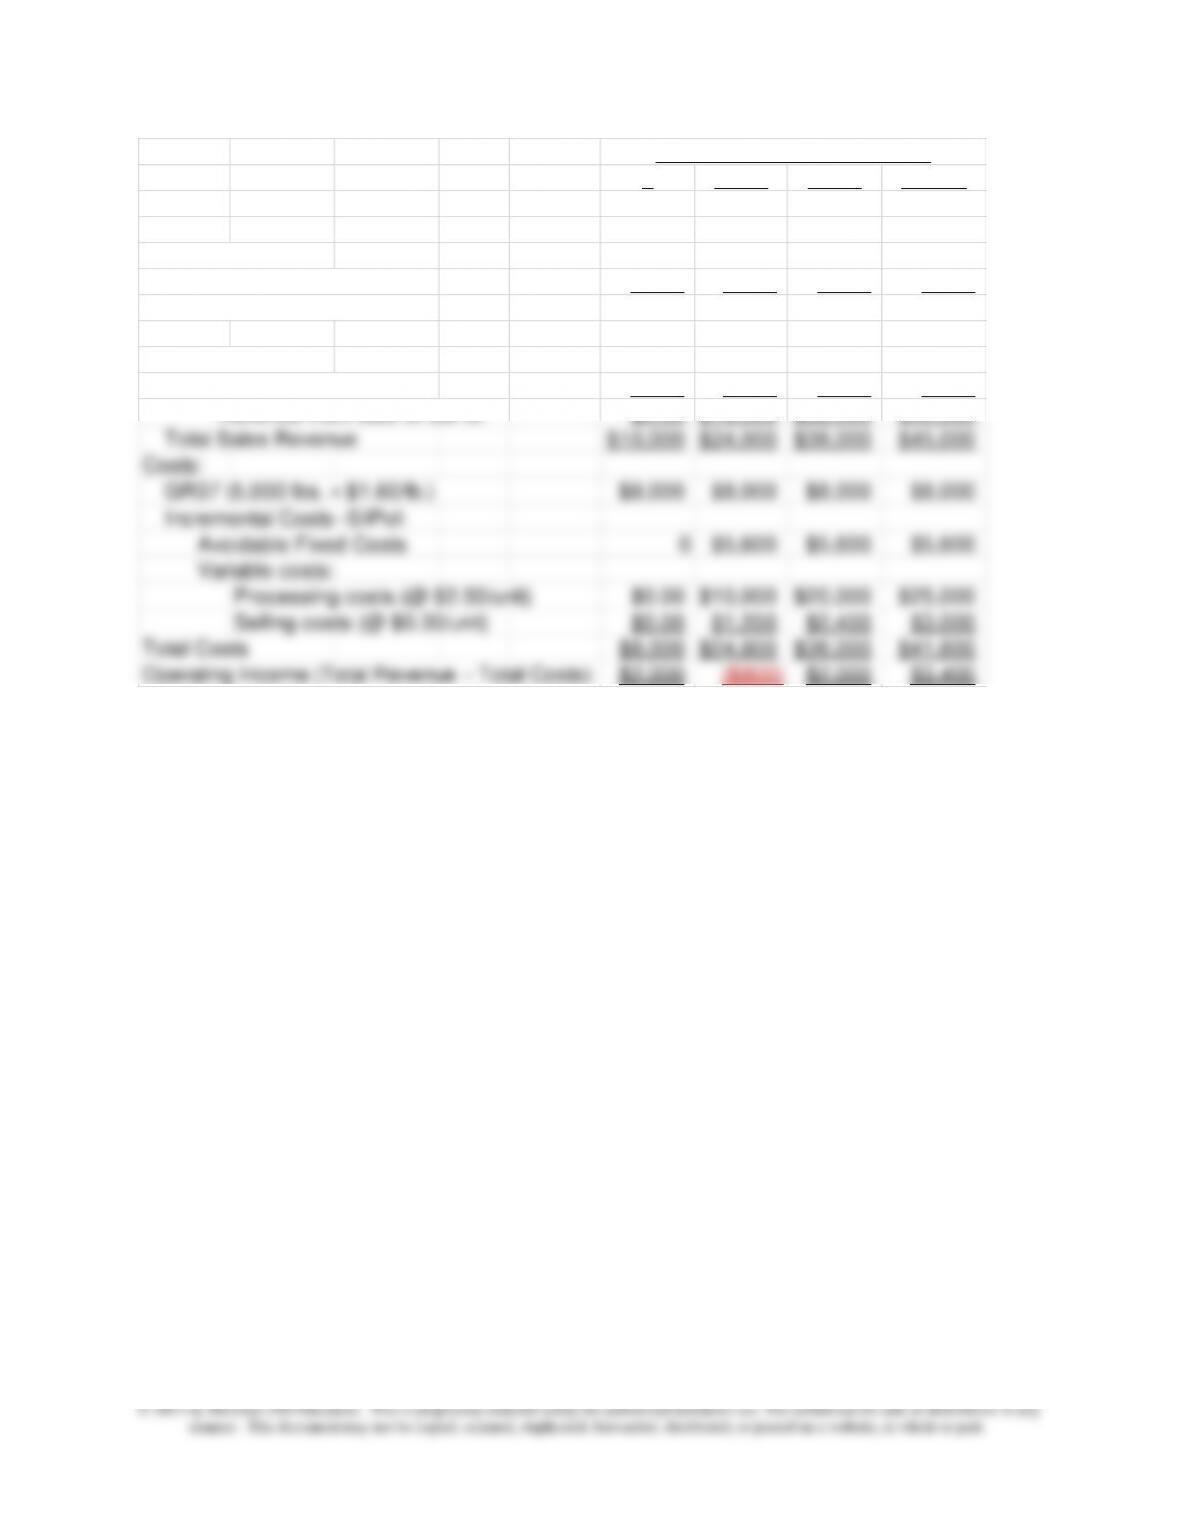
2. Comparative Income Statements —Three Different Product Mixes
Chapter 11 – Decision Making with a Strategic Emphasis
04,000 8,000 10,000
Sales:
GR37:
Pounds 5,000 4,000 3,000 2,500
Selling price per pound $2.00 $2.00 $2.00 $2.00
Revenue from GR37 $10,000 $8,000 $6,000 $5,000
SilPol:
Units 0 4,000 8,000 10,000
Selling price per unit $4.00 $4.00 $4.00 $4.00
Revenue from Sale of SilPol $0.00 $16,000 $32,000 $40,000
Total Sales Revenue $10,000 $24,000 $38,000 $45,000
Costs:
GR37 (5,000 lbs. × $1.60/lb.) $8,000 $8,000 $8,000 $8,000
Incremental Costs–SilPol:
Avoidable Fixed Costs 0 $5,600 $5,600 $5,600
Variable costs:
Processing costs (@ $2.50/unit) $0.00 $10,000 $20,000 $25,000
Selling costs (@ $0.30/unit) $0.00 $1,200 $2,400 $3,000
Total Costs $8,000 $24,800 $36,000 $41,600
Operating Income (Total Revenue − Total Costs) $2,000 ($800) $2,000 $3,400
Units of SilPol Produced/Sold
11-26 (Continued)
Note that at volume levels below 8,000 units, it is not worthwhile to incur
the additional fixed processing costs of $5,600. The breakeven volume, as
indicated by the answer to #1 above, is 8,000 units of SilPol.
Chapter 11 – Decision Making with a Strategic Emphasis
11–27 Product Profitability Analysis (20-25 min)
Note that variable selling and administrative costs should be included in
calculating contribution margin, so that the contribution margin
presented in the problem is incorrect and requires this adjustment.
1. T-1
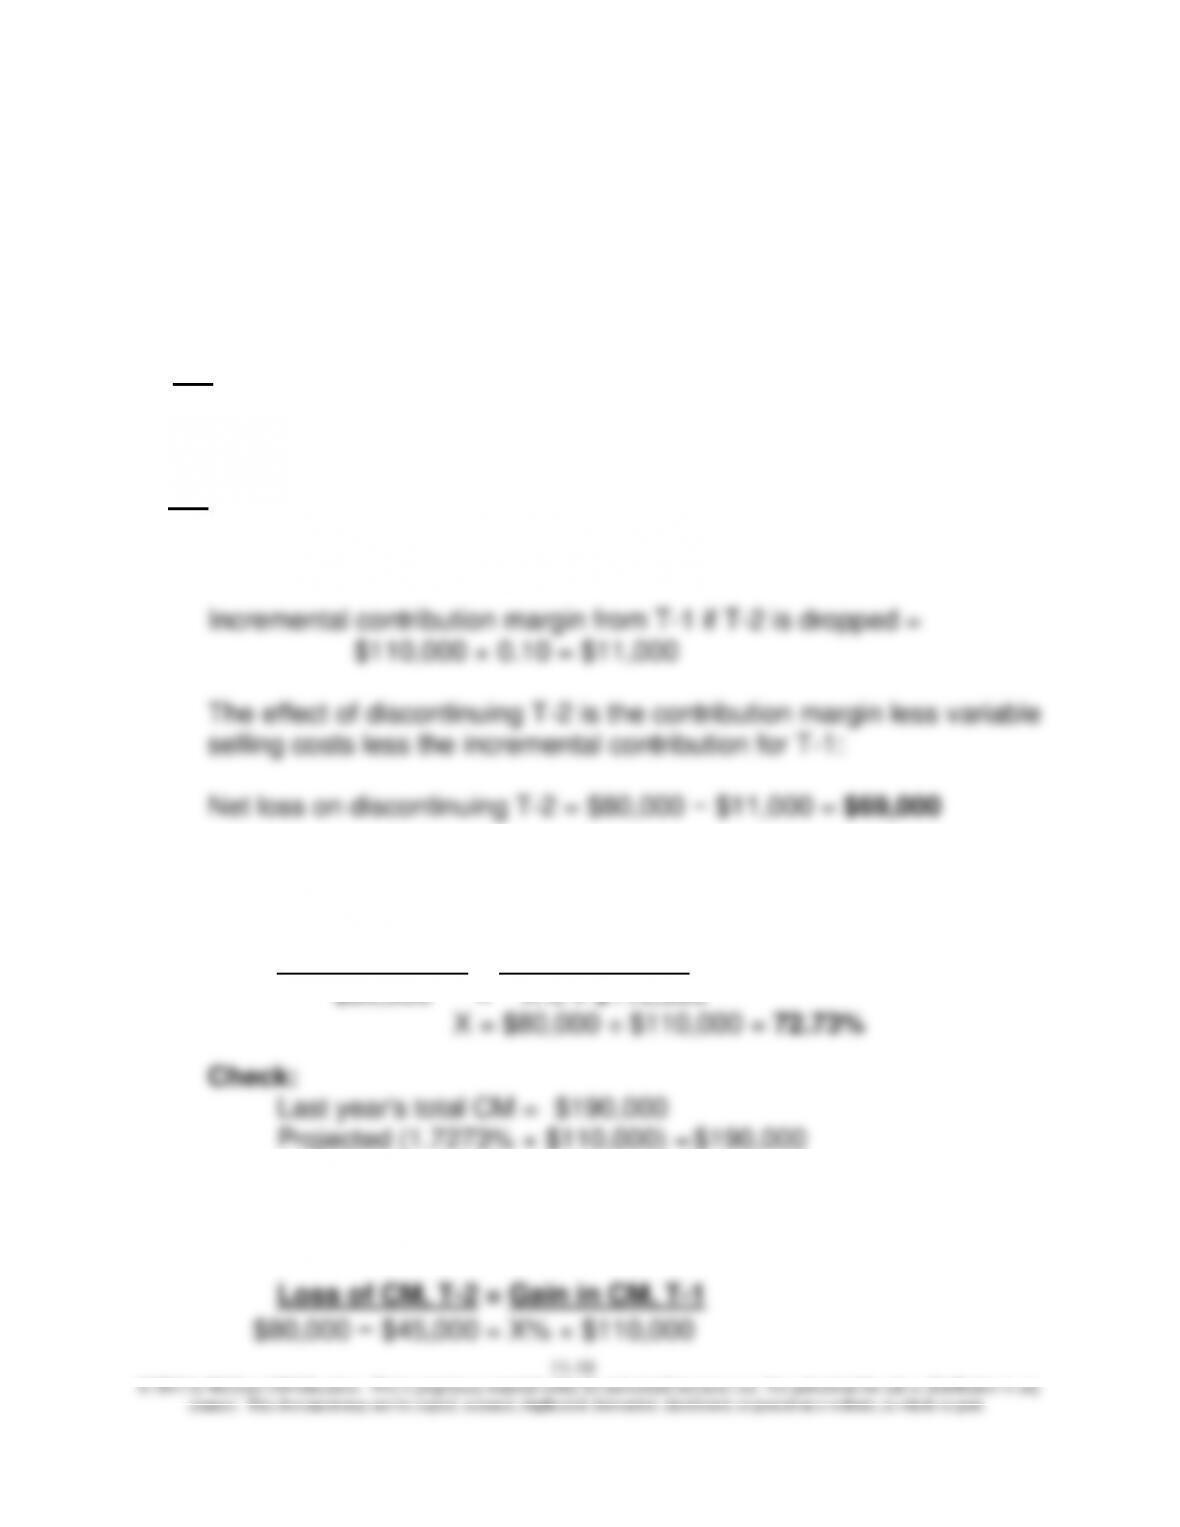
Last year’s contribution = $200,000 − $70,000 − $20,000 = $110,000
Last year’s contribution margin ratio = $110,000 ÷ $200,000 = 55%
T-2
Last year’s contribution = $260,000 − $130,000 − $50,000 = $80,000
Last year’s contribution margin ratio = $80,000 ÷ $260,000 = 30.77%
2. Required % increase in sales of T-1 to compensate for lost margin from
T-2:
Loss of CM, T-2 = Gain in CM, T-1
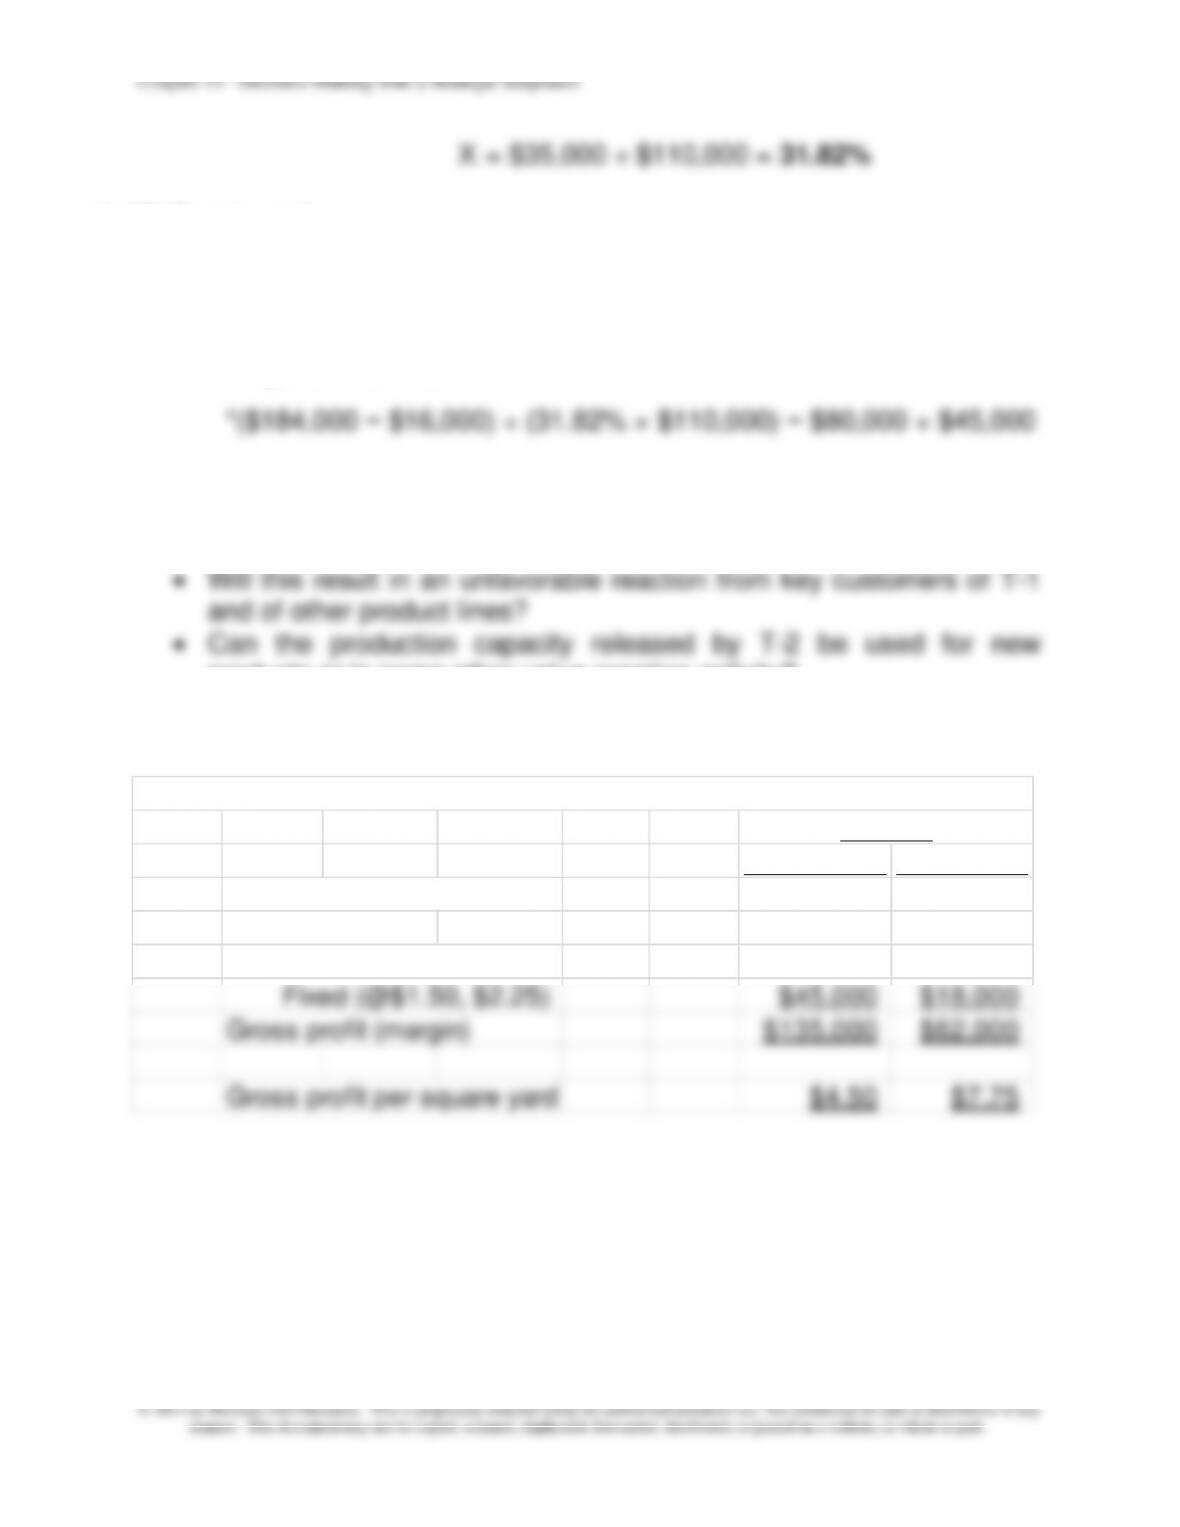
3. Required % increase in sales from T-1 to compensate for lost margin
from T-2 if total fixed costs can be reduced by $45,000.
11–19
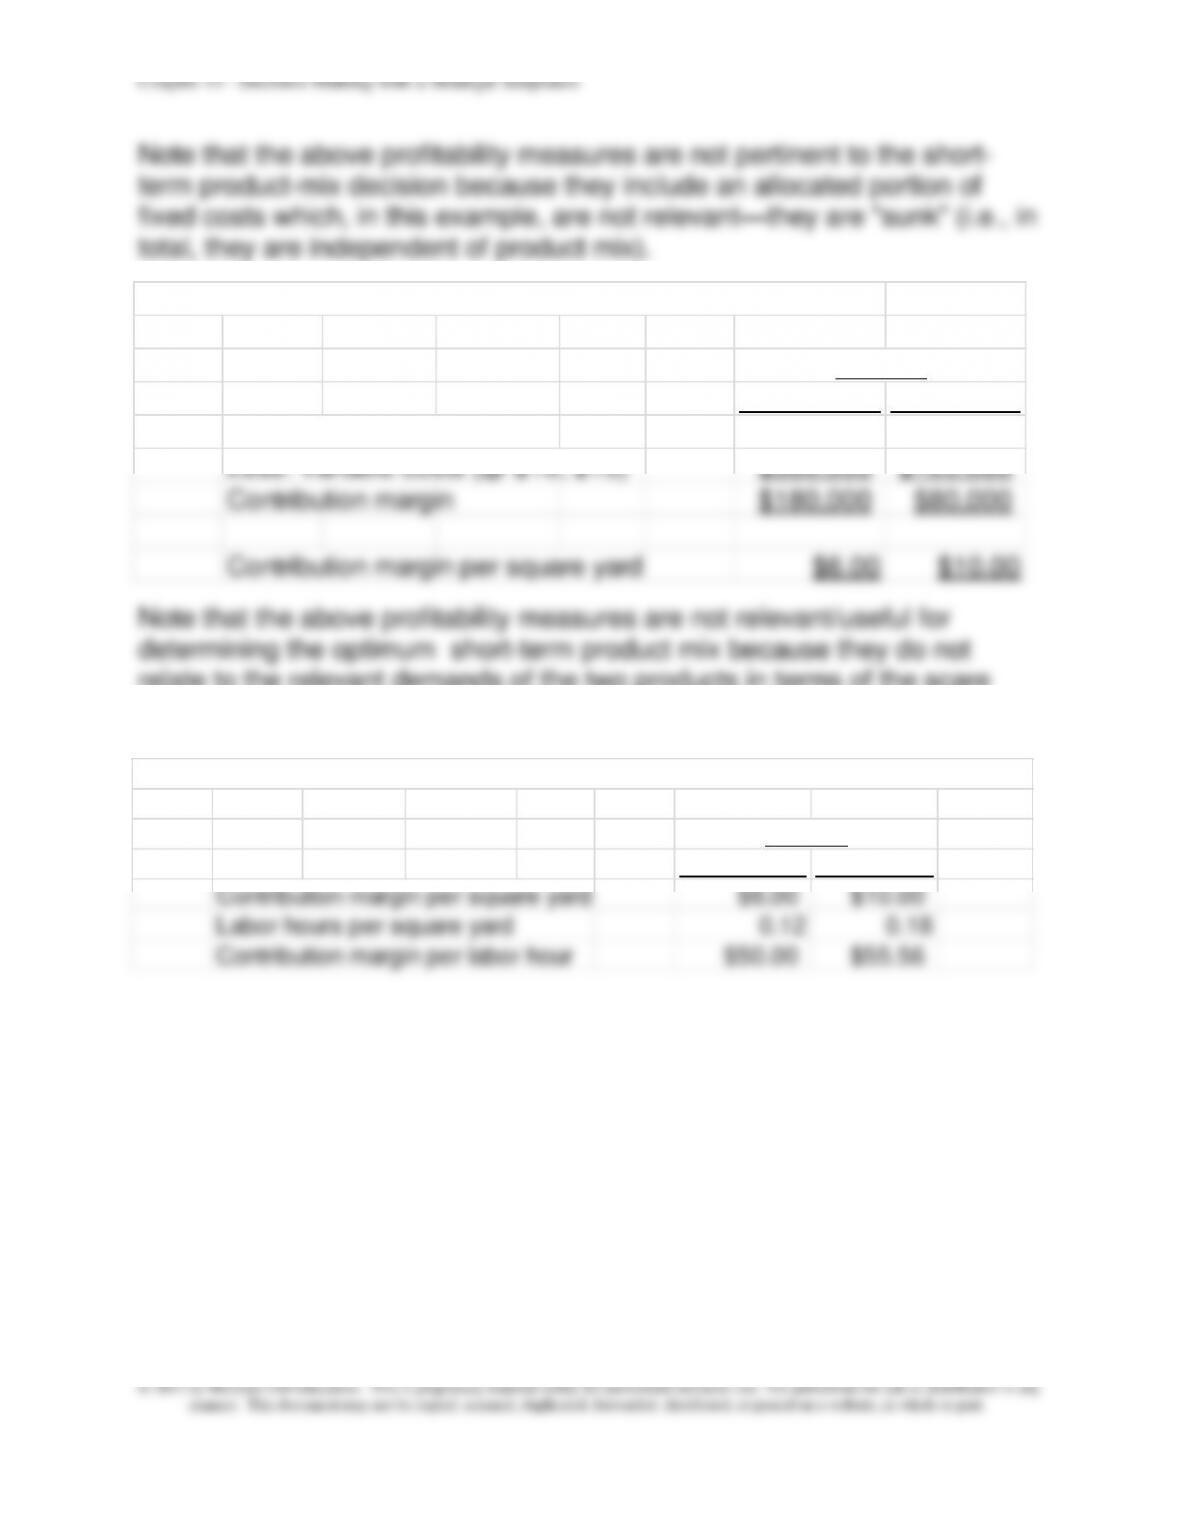
1. Gross profit calculations, by product, and per square yard
Commercial Residential
Sales (@ $16, $25) $480,000 $200,000
Less: CGS:
Variable (@ $10, $15) $300,000 $120,000
Fixed (@$1.50, $2.25) $45,000 $18,000
Gross profit (margin) $135,000 $62,000
Gross profit per square yard
$4.50 $7.75
Product
11-27 (Continued)
Check:
Last year’s total operating income = $168,000
Projected = $168,000*
4. The following strategic factors should be considered.
• What will be the effect on the firm’s image if T-2 is dropped?
products or in some other value-creating activity?
11-28 Product-Mix Analysis (30-40 minutes)
11–20
3. Optimum product mix, given labor-hour constraint and demand constraints
Commercial Residential
Contribution margin per square yard
$6.00 $10.00
Labor hours per square yard 0.12 0.18
Contribution margin per labor hour $50.00 $55.56
Product
relate to the relevant demands of the two products in terms of the scare
resource (labor hours).
Chapter 11 – Decision Making with a Strategic Emphasis
11–21
11-28 (Continued)
4. Conceptual Lesson
The primary conceptual lesson is that neither of the profit measures
reported in 1 or 2 are useful for determining the short-term optimum
product mix in the presence of resource constraints (labor hours in the
present example). For this purpose it is necessary to allocate available
labor hours on the basis of the contribution margins expressed on a per–
labor-hour basis. In the present case, the residential-grade carpet is the
decisions solely on these alternative profitability figures could lead to a
suboptimal deployment of available capacity.
5. Primary Role of the Management Accountant
The primary role of the management accountant in this context is to
develop accurate estimates of the contribution margins for each product
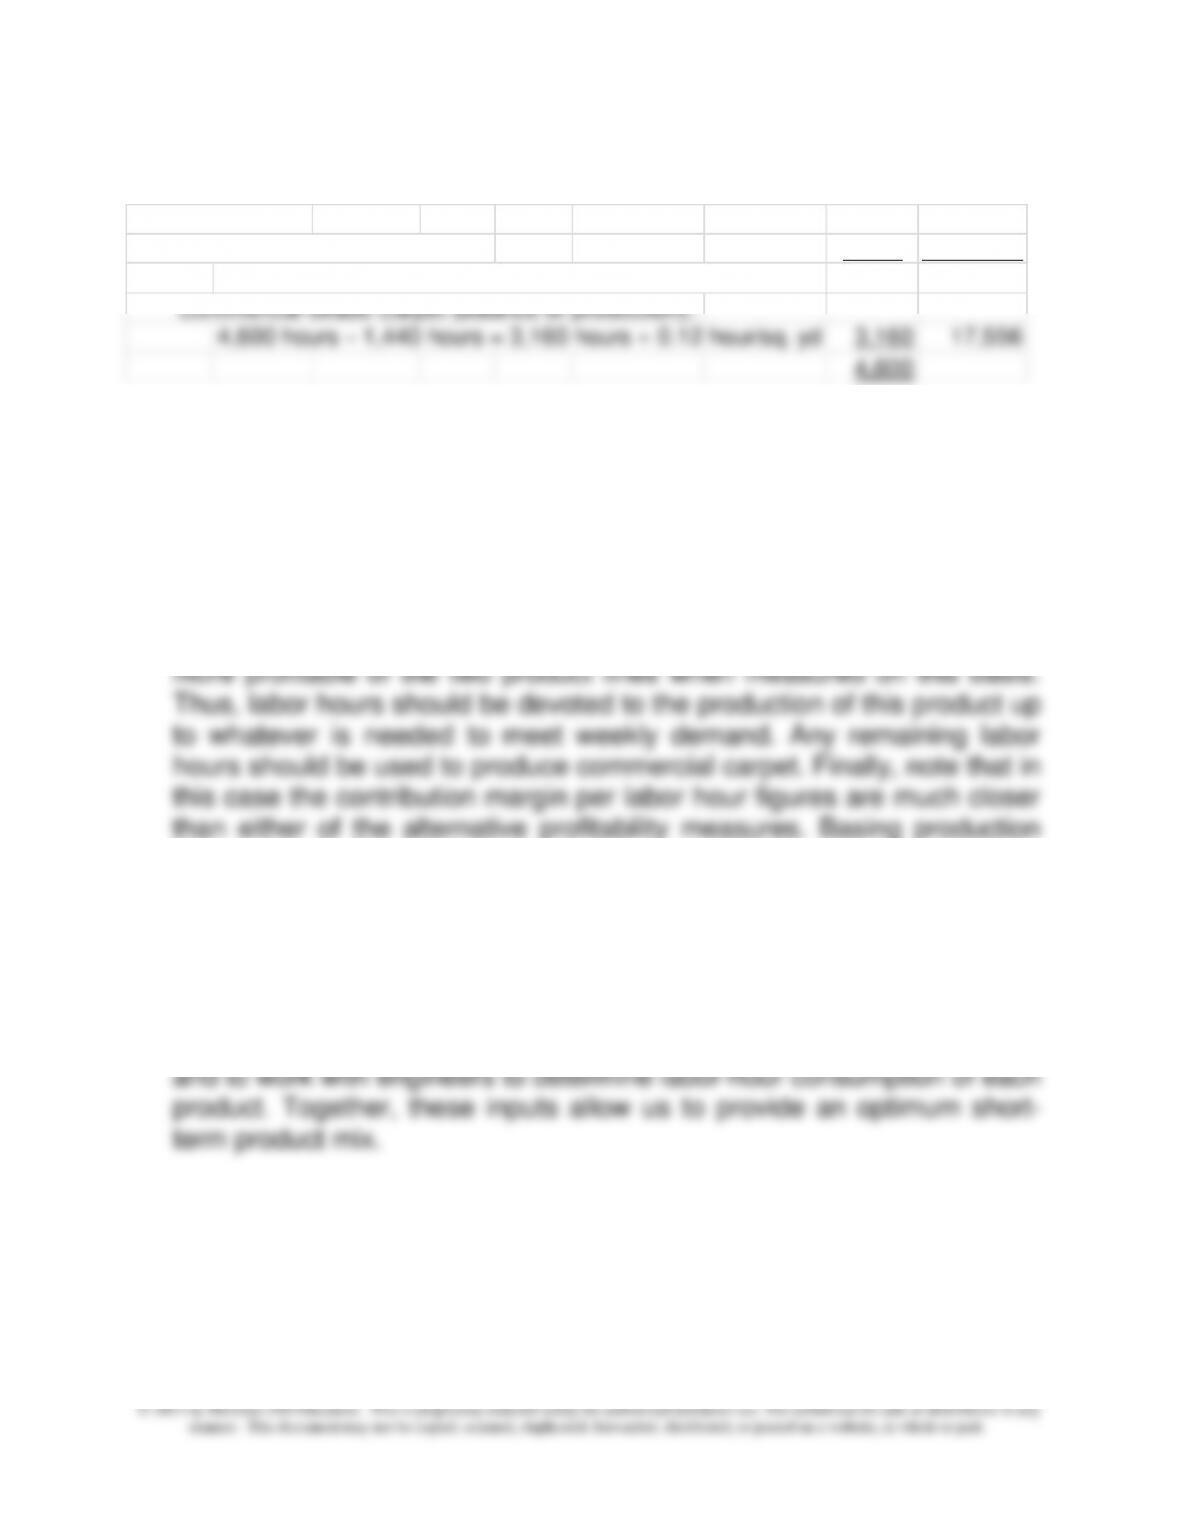
Optimum Mix:
Residential Grade Carpet: Hours Sq. Yards
Total demand = 8,000 sq yds. × 0.18 hr./sq. yd. = 1,440 8,000
Commercial Grade Carpet (balance of production):
4,600 hours − 1,440 hours = 3,160 hours ÷ 0.12 hour/sq. yd
3,160 17,556
4,600
Chapter 11 – Decision Making with a Strategic Emphasis
11–22
11–29 Solar Panels: Lease or Purchase? (45-60 minutes)
1. Relevant Costs—Leasing vs. Purchasing: Solar Panels
a. Purchase:
(1) original cost, including installation
(2) annual maintenance contract?
(3) annual maintenance expense?
v. loan guarantee programs
(in short, there is an almost bewildering array of financial
incentive programs available at both the government [federal
and state] level and at the level of the local utility provider)
b. Lease:
(1) Lease terms:
i. fixed payment plan per month
ii. Variable-cost payment plan (also known as “Power
Purchase Agreements” or PPAs)—generally, these are
Chapter 11 – Decision Making with a Strategic Emphasis
11–23
11-29 (Continued-1)
(3) Price escalation:
installation
2. Other considerations:
a. Individual
i. Risk—by leasing, the basic risk is that the cost of (purchasing)
solar panels would fall in the future and/or the level of
government subsidy for such would increase significantly
(which effectively reduces the cost): with the lease, the lessee
would be a worthwhile first step prior to installing solar energy
panels
v. Solar energy could conceivably be used in the future to charge
electric cars
Chapter 11 – Decision Making with a Strategic Emphasis
11–24
b. Businesses
1. use of solar-generated power may make businesses more
11-29 (Continued-2)
4. use of solar (i.e., renewable) energy could help the business
5. Image—are the customers more likely to buy from a business
that is viewed as more “environmentally responsible”?
c. Society:
i. Cleaner air/lower levels of pollutants/reduction in level of
Chapter 11 – Decision Making with a Strategic Emphasis
11–25
11–30 Relevant Cost Exercises (60-75 minutes)
a. Make or Buy:
The relevant cost for producing the product is as follows:
Cost Per Unit
Direct Materials $28
Direct Labor 18
Variable Overhead 16
Total $62
($62/unit × 2,000 units) = $124,000
Qualitative Considerations:
a. How does the quality of product compare, insourcing vs.
outsourcing?
b. Reliability (i.e., on-time delivery performance)?
c. Financial condition of the supplier? (With the supplier be in
costs: increased payroll taxes; negative goodwill.
Chapter 11 – Decision Making with a Strategic Emphasis
11–26
b. Disposal of Assets
Re–machine Scrap
Future Revenues $30,000 $2,500
Deduct future costs 25,000
Difference $5,000 $2,500
11-30 (Continued-1)
The difference is in favor of re-machining. The $50,000 inventory cost
is irrelevant.
Alternative presentation format:
Incremental Revenues from Further Processing:
Estimated sales value of re-machined parts $30,000
Current disposal value of parts $2,500
parts make their way into the market?
3. Reliability/quality of re-machined parts (in the minds of the
consumer)?
c. Replacement of an Asset
Replace Rebuild
New boat $92,000 –
Deduct current disposal price $ 9,000
Rebuild of existing boat $75,000
Margin $83,000 $75,000
The difference is in favor of rebuilding. The $90,000 original purchase
cost is irrelevant as it is a “sunk cost.”
Chapter 11 – Decision Making with a Strategic Emphasis
11–27
Alternative presentation format:
Cost to buy a replacement boat = $92,000
Total cost of refurbishing:
Out–of-pocket cost = $75,000
d. Profit from Processing Further (“Sell or Process Further”)
The main point of this exercise is that joint costs should be ignored when
addressing the “sell–or–process further” decision (see also coverage of
this point in Chapter 7).
1. Definitions:
a. joint production process: process in which more than output
emerges from a common resource input (e.g., barrel of crude oil)
b. joint costs: in a joint production process, these are costs incurred
before the split-off point; that is, these costs are joint or common to
the outputs; since these costs are non-traceable, they must be
allocated to outputs
Chapter 11 – Decision Making with a Strategic Emphasis
11–28
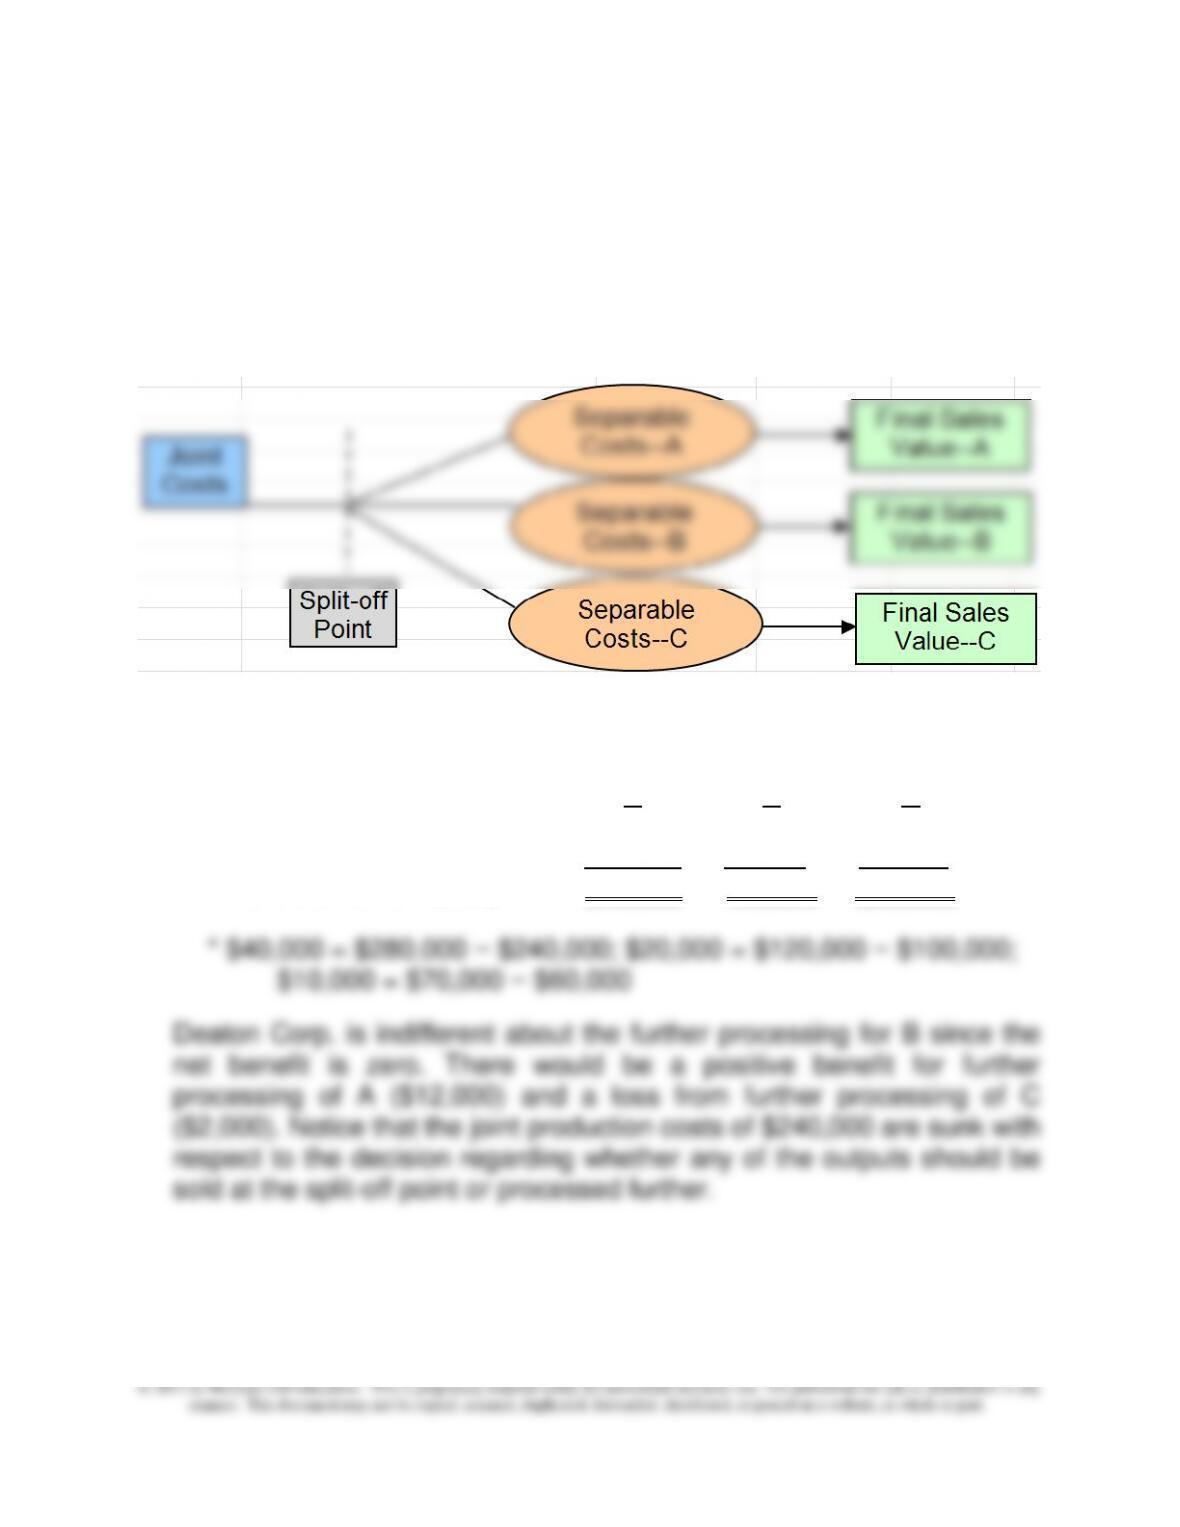
d. split-off point: point in a joint production process where products
with individual identities emerge; cost incurred prior to the split-off
point are called joint costs, while those incurred after the split-off
point are called separable processing costs
The situation for Deaton Corporation is depicted in the diagram that
follows.
2. Which products, if any, should be processed further (rather than being
sold at the split-off point)?
A B C
Addt’l costs of further process $28,000 20,000 12,000
Increase in sales value * 40,000 20,000 10,000
Differential benefit (loss) $12,000 $0 ($2,000)
Chapter 11 – Decision Making with a Strategic Emphasis
11–29
3. For financial reporting and tax purposes, accountants need to value
inventory on a “full cost” basis. Thus, in the present case for income-
statement preparation purposes and for purposes of preparing an end–
of-period balance sheet, a portion of the joint production cost of
$240,000 must be assigned to each unit sold during the period and each
unit on hand at the end of the period. There are alternative ways to
allocate joint production costs to outputs. Regardless of how these costs
are handled for financial reporting and tax purposes, they are irrelevant
to the sell-or-process further decision.
e. Make or Buy (sourcing decision)
The relevant fixed overhead is $12 per unit ($20 × 60%) because that
amount could be avoided by buying the part from McMillan. All variable
Nonfinancial Factors that Might Be Relevant
a. Are there alternative (better) uses for the available capacity?
b. Quality of the supplier’s product: how does it compare to the quality of
internal production?
c. Reliability—on-time delivery performance of the supplier?
d. Future price trends: is the supplier price likely to be lower (or greater)
in the long run?
f. Selection of More Profitable Product
1. The comment “Flash and Clash are processed through the same
production departments” can be taken to mean that capacity-related
Chapter 11 – Decision Making with a Strategic Emphasis
11–30
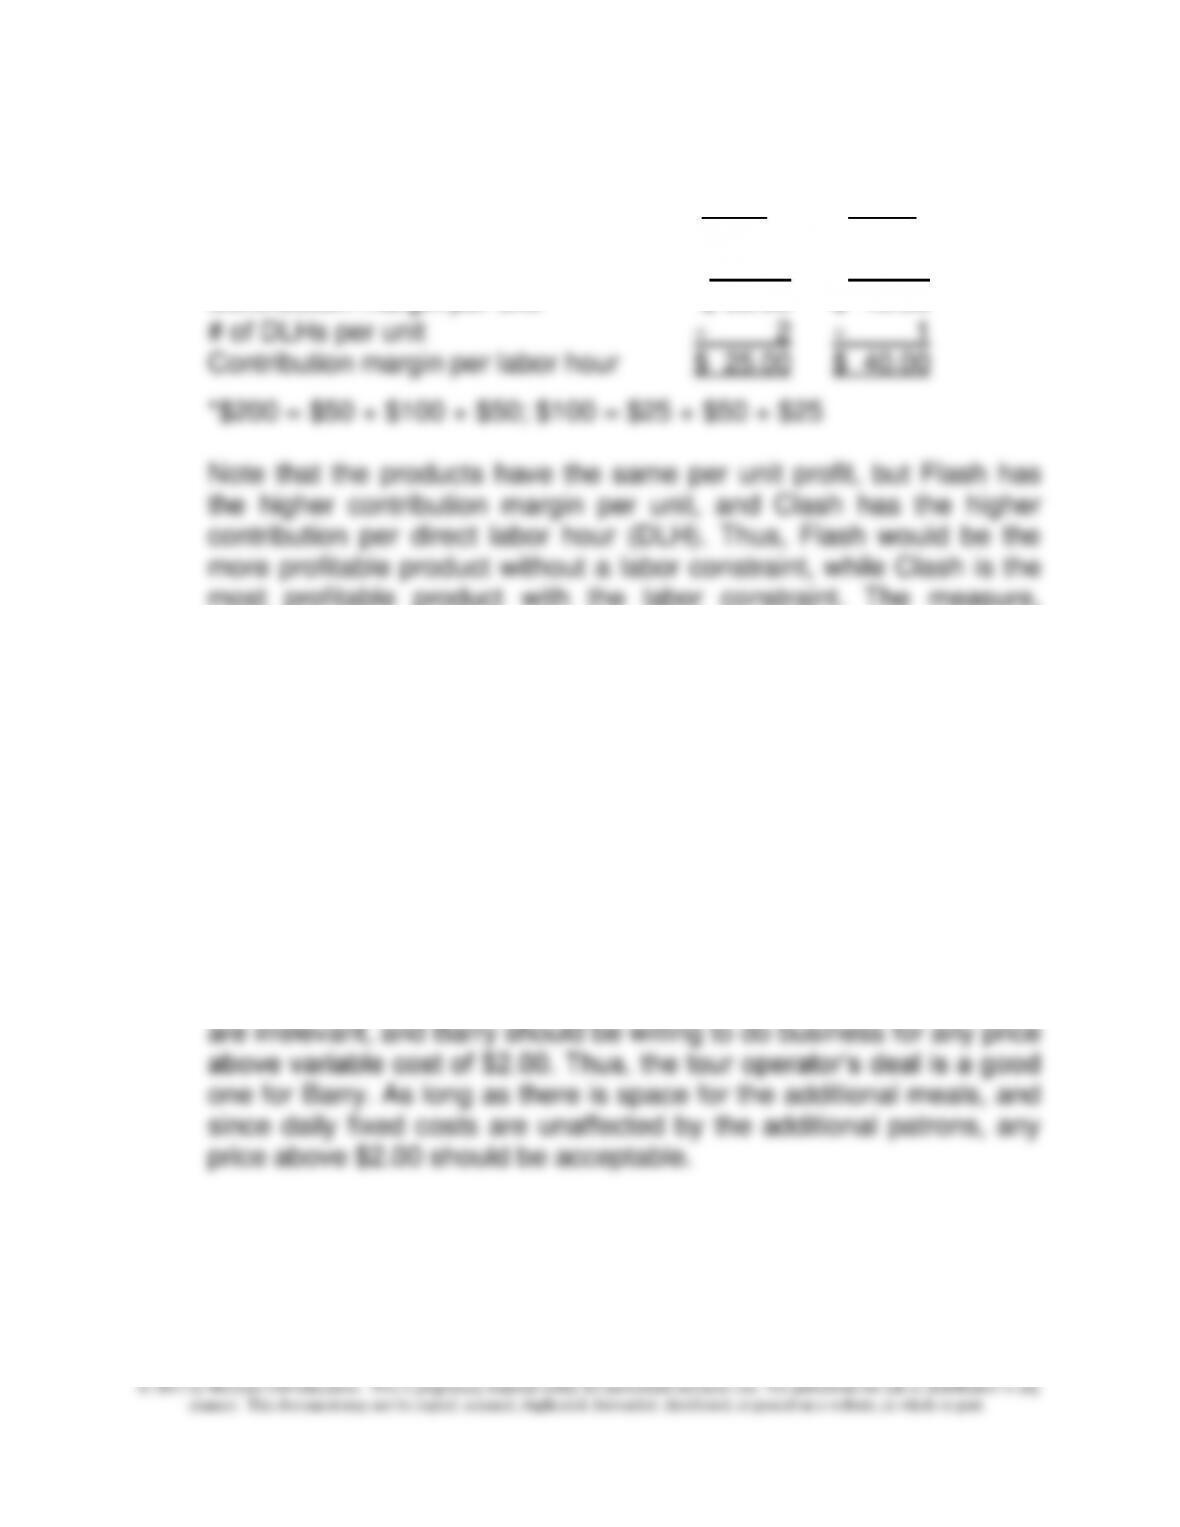
2. Selection of the more profitable product:
Flash Clash
Selling price per unit $250.00 $140.00
Variable cost per unit* 200.00 100.00
Contribution margin per unit $ 50.00 $ 40.00
most profitable product with the labor constraint. The measure,
operating profit, is not used because it includes the sunk fixed costs.
In sum, Clash returns the highest amount per DLH, the scare
resource. Therefore, the optimum short-term product mix would
consist of producing Clash up to external demand. Any remaining
DLHs would then be devoted to the production of Flash.
g. Special-Order Pricing
The total cost of each meal is variable plus fixed cost or $2.00 per
meal + ($1,200 ÷ 600 meals) = $4.00 per meal. This is a reasonable
cost basis for long-term pricing, and Barry is getting a $1.00 margin
on each meal. However, in a special-order situation the fixed costs