
Chapter 10 – Strategy and the Master Budget
10–76
10–55 (Continued-2)
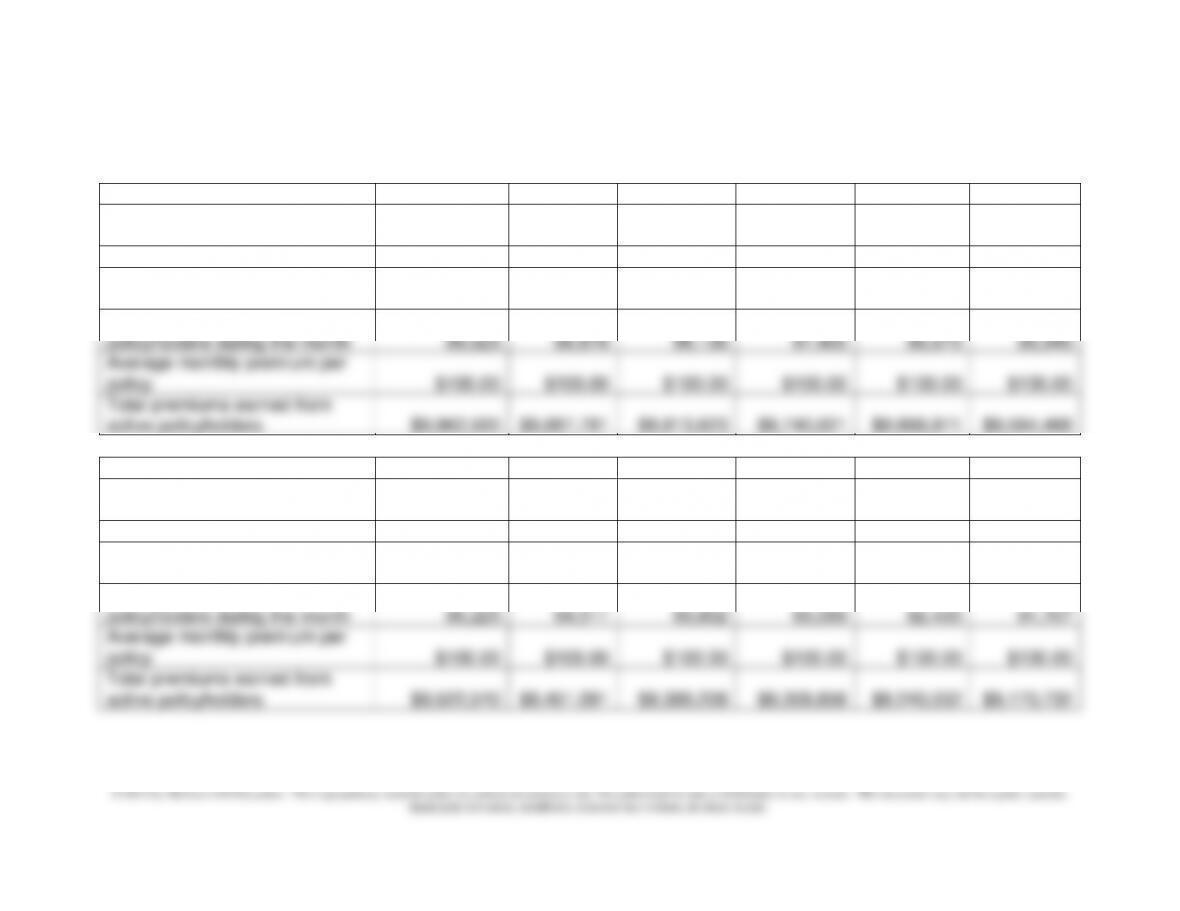
3. Sensitivity Analysis: Revision of the original 12-month budget created above in (1) to
cancellation rate to 0.75%. (See following page for answer.)
Chapter 10 – Strategy and the Master Budget
10–77
10-55 (Continued-3)
Budget Item
January
February
March
April
May
June
No. of active policyholders,
beginning of the month
100,000
99,250
98,506
97,767
97,034
96,306
Mid-term cancellation rate (%)
0.75%
0.75%
0.75%
0.75%
0.75%
0.75%
No. of active policyholders, end
of the month
99,250
98,506
97,767
97,034
96,306
95,584
Average no. of active
policyholders during the month
99,625
98,878
98,136
97,400
96,670
95,945
Average monthly premium per
policy
$100.00
$100.00
$100.00
$100.00
$100.00
$100.00
Total premiums earned from
active policyholders
$9,962,500
$9,887,781
$9,813,623
$9,740,021
$9,666,971
$9,594,468
Budget Item
July
August
September
October
November
December
No. of active policyholders,
beginning of the month
95,584
94,867
94,155
93,449
92,748
92,053
Mid-term cancellation rate (%)
0.75%
0.75%
0.75%
0.75%
0.75%
0.75%
No. of active policyholders, end
of the month
94,867
94,155
93,449
92,748
92,053
91,362
Average no. of active
policyholders during the month
95,225
94,511
93,802
93,099
92,400
91,707
Average monthly premium per
policy
$100.00
$100.00
$100.00
$100.00
$100.00
$100.00
Total premiums earned from
active policyholders
$9,522,510
$9,451,091
$9,380,208
$9,309,856
$9,240,032
$9,170,732
Chapter 10 – Strategy and the Master Budget
10–55 (Continued-4)
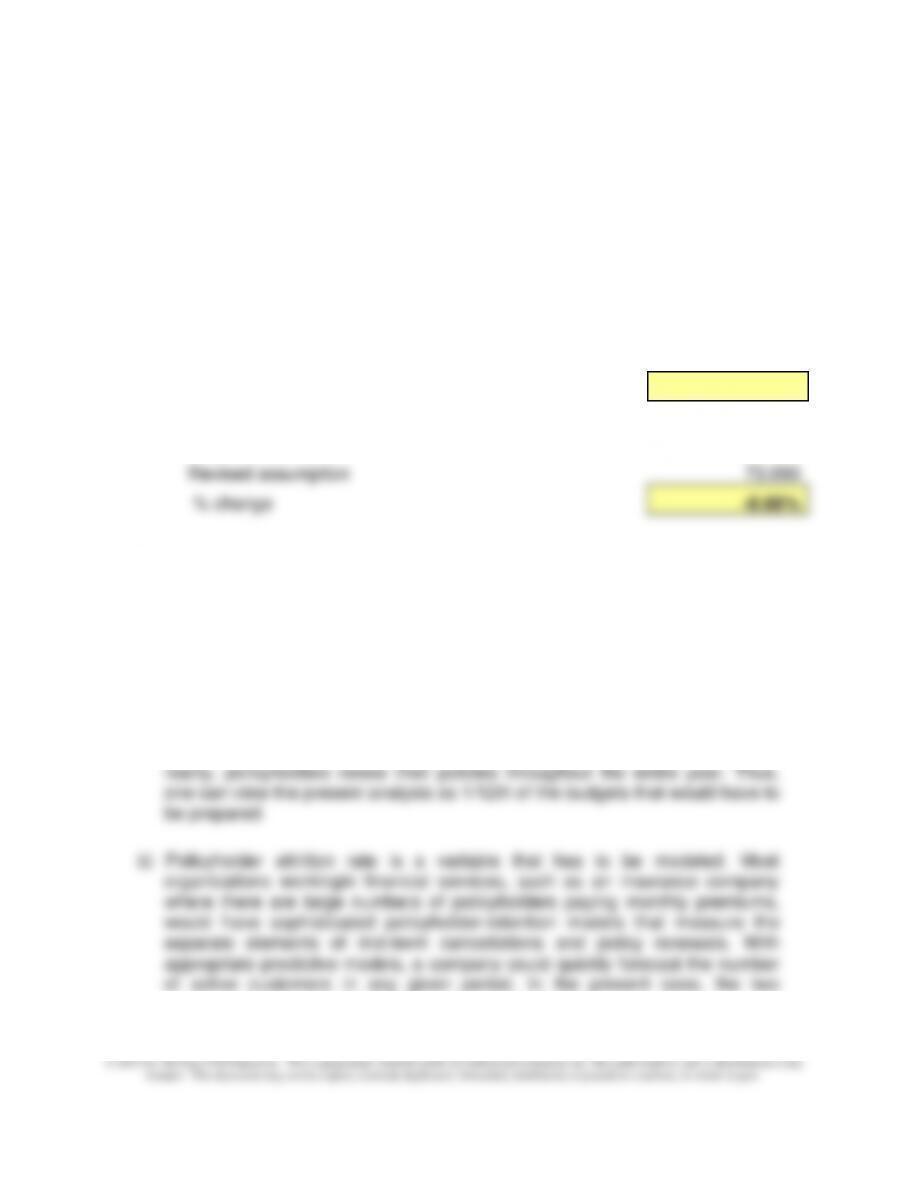
Active policies, end of December
91,362
Policy renewal rate
80.00%
No. of estimated policyholders, beginning of new year
73,090
Recap:
Premiums Earned, original assumptions
$116,462,500
Premiums Earned, revised assumptions
$114,739,793
% change
-1.48%
Estimated policy renewals, end of year:
Original assumption
80,038
Revised assumption
73,090
% change
-8.68%
4. What other information or data would be included in a full budget prepared each
month for this insurance company?
This question is meant to reinforce real-world complexities in the budget-
preparation process and the interrelationship(articulation) of various sub-budgets.
The following are some additional considerations for the present insurance
company example:
a) The schedules presented above assumed that the renewal date for all
policyholders was the end of December. Naturally, this is a simplification. In
reality, policyholders renew their policies throughout the entire year. Thus,
one can view the present analysis as 1/12th of the budgets that would have to
be prepared.
b) Policyholder attrition rate is a variable that has to be modeled. Most
organizations workingin financial services, such as an insurance company
where there are large numbers of policyholders paying monthly premiums,
would have sophisticated policyholder-retention models that measure the
separate elements of mid-term cancellations and policy renewals. With
appropriate predictive models, a company could quickly forecast the number
of active customers in any given period. In the present case, the two
Chapter 10 – Strategy and the Master Budget
10–79
010- 55 (Continued-5)
c) In the case of life insurance, where different policyholders pay different
monthly premiums, the estimation of insurance premiums earned each month
becomes more challenging.
d) For simplicity we assumed a constant monthly mid-term cancellation rate. The
use of sophisticated business intelligence tools might provide finer forecasts
each period.
e) This problem provides an excellent opportunity to introduce, within a financial
services context, the important role that “rolling financial forecasts” can play,
and the associated superficiality of a traditional 12-month fixed budget.
f) It is likely that some of the non-financial indicators in this company’s budget
(e.g., customer attrition rates) would also be included in the “Customer
Perspective” of the company’s Balanced Scorecard (BSC). This is principally
because these nonfinancial performance indicators are leading indicators of
future financial performance.
10–80
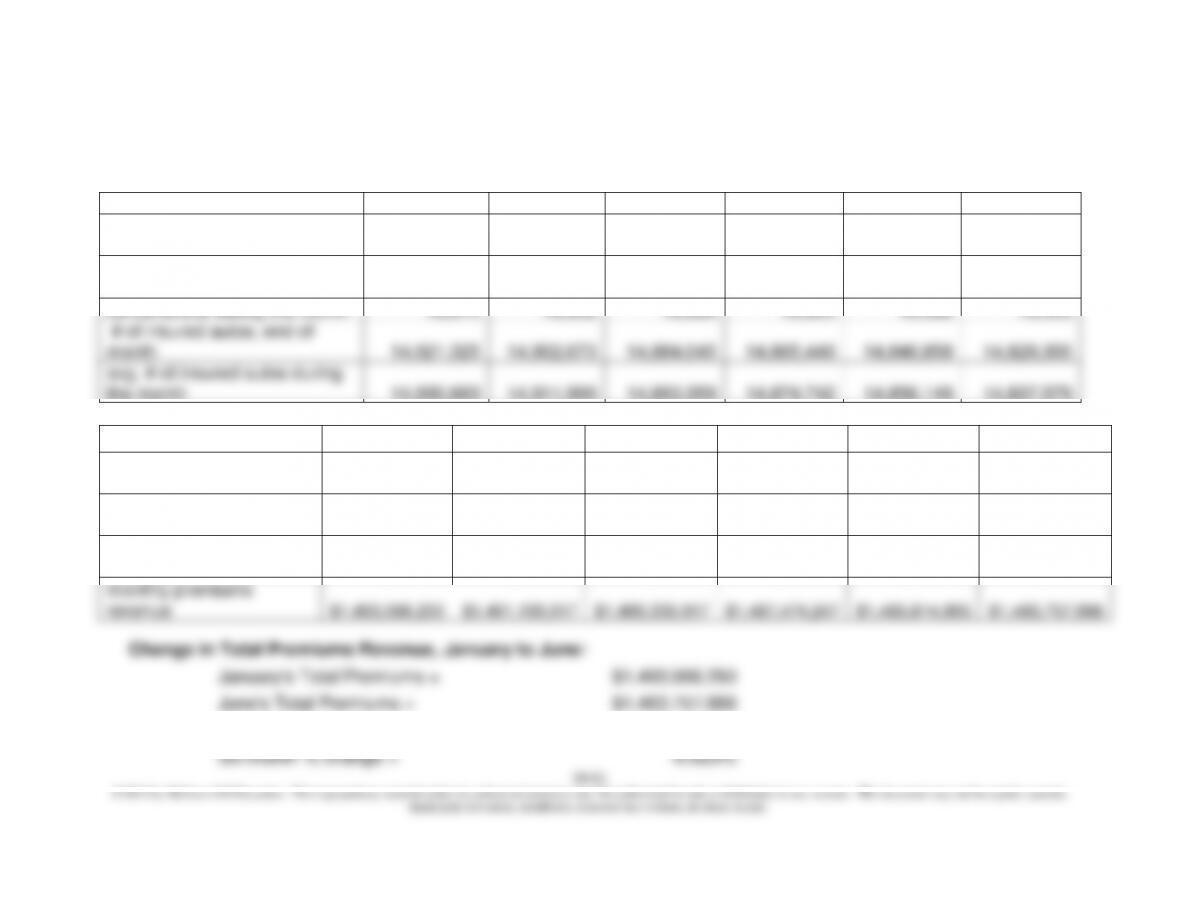
10-56: Budgeting Insurance Policy Volume and Monthly Revenues (75 Minutes)
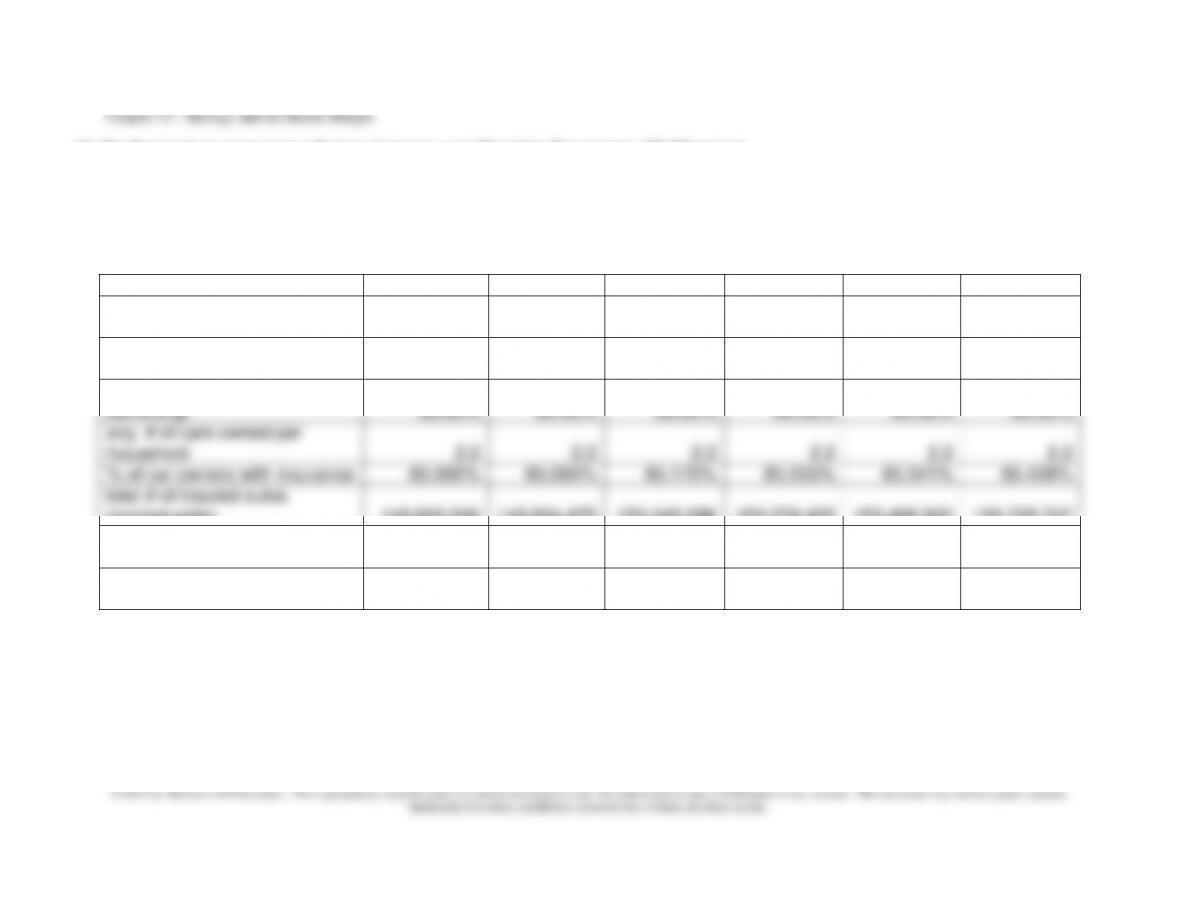
1. Monthly budgets broken down into three parts: marketsize and volume; volume for National Auto Insurance
Company; and, Premium Revenues earned.
January
February
March
April
May
June
Part a: Market Size &
Volumes
Total # of households (market
size)
100,000,000
100,050,000
100,100,025
100,150,075
100,200,150
100,250,250
% of households—car
ownership
80.00%
80.00%
80.00%
80.00%
80.00%
80.00%
avg. # of cars owned per
household
2.2
2.2
2.2
2.2
2.2
2.2
% of car owners with insurance
85.000%
85.085%
85.170%
85.255%
85.341%
85.426%
total # of insured autos
(market-wide)
149,600,000
149,824,475
150,049,286
150,274,435
150,499,922
150,725,747
market share of National Auto
Insurance
10.00%
10.001%
10.001%
10.002%
10.002%
10.003%
# of autos insured by National,
end of mo.
14,960,000
14,983,197
15,006,429
15,029,698
15,053,002
15,076,343
Chapter 10 – Strategy and the Master Budget
10–56 (Continued-2)
Change in Total Premiums Revenue, January to June:
January’s Total Premiums =
$1,493,066,250
June’s Total Premiums =
$1,483,757,886
Six-month Dollar Change =
-$9,308,364
Six-month % change =
-0.623%
January
February
March
April
May
June
Part b: Volume for National
Auto Insurance
# of autos insured, beginning
of month
14,940,000
14,921,325
14,902,673
14,884,045
14,865,440
14,846,858
cancellations during the month
18,675
18,652
18,628
18,605
18,582
18,559
# of insured autos, end of
month
14,921,325
14,902,673
14,884,045
14,865,440
14,846,858
14,828,300
avg. # of insured autos during
the month
14,930,663
14,911,999
14,893,359
14,874,742
14,856,149
14,837,579
January
February
March
April
May
June
Part c: Volume for
National Auto Insurance
# of autos insured during
the month
14,930,663
14,911,999
14,893,359
14,874,742
14,856,149
14,837,579
avg. insurance premium
per auto per month
$100.00
$100.00
$100.00
$100.00
$100.00
$100.00
monthly premiums
revenue
$1,493,066,250
$1,491,199,917
$1,489,335,917
$1,487,474,247
$1,485,614,905
$1,483,757,886
Chapter 10 – Strategy and the Master Budget
10–56 (Continued-3)
2. What additional real-life refinements would you envision for the budgets you
prepared above in (1)? What additional budgets would you anticipate preparing for
the company were you in charge of the budget-preparation process?
a) As the person in charge of the budget-preparation process, one obvious
recommended change would be to report separately the number of new policies
written (the logical offset in Part b to the number of policy cancellations). Currently
the number of new policy-holders is buried somewhere in part a of the budget.
Thus, a significant improvement is to disclose prominently each month the net
change in (average) policies outstanding, which is defined as the difference
between the number of new policies written and the number of policy cancellations.
b) In the example problem we assumed, for simplicity, that all policyholders paid
the same premium. Alternatively, we used an average premium rate per month per
policy, which is acceptable for budgeting purposes as long as the mix of
calendar year, January through December. A fuller, more realistic analysis would
gather similar data for policyholders whose anniversary date is something other
than January 1st. Whether the profiles of such policyholders is different from the
profile assumed above is an empirical question.
d) The cancellation rate, and growth rate in new underwritings, would probably be
monitored carefully since these are key drivers of future financial performers. That
is, they are “leading indicators” of financial performance and as such would
(i.e., policies cancelled before the annual renewal date).It would seem
appropriate, however, to include in the model a policy-renewal rate (85%, 90%,
etc.).
f) The above calculations and budgets deal solely with forecasted volume (# of
policies) and premiums revenue ($). The output of the budgetswe prepared would
then be used to prepare other budgets for the company. In this sense, and similar
to the extended example in thechapter, we say that the budgets articulate with
one another. For example, once a budget for volume and sales has been
Chapter 10 – Strategy and the Master Budget
information from both of these budgets would be used to forecast staffing needs,
what we might call “claims handling.” Claims processing times, the mix of “simple”
versus “complicated” claims, the average time to process a claim, the time
10–56 (Continued-4)
available per day (month) for each claims handler, the % of submitted claims that
are paid, etc. would all be “drivers” that would be incorporated into the claims–
processing budget.
g) The budget as presented is static in nature and covers a fixed period of time.
For reasons discussed more fully in the chapter, the limitations of such budgets
can be addressed by generating “rolling forecasts.”
3. The budgets you prepared above in (1) can be referred to as “driver–based
budgets.” List some of the pros and the cons of such budgets,relative to traditional
budgeting practices.
Pros
1. Driver-based budgeting (e.g., traditional activity-based budgeting (ABB) or
Time-Driven Activity-Based Budgeting) reduces the time to produce a
budget or to re-forecast.
2. Driver-based budgeting requires fewer iterations—that is, it reduces the “give
and take” and time devoted to the “negotiations” aspect of traditional
budgets.
3. Driver-based budgeting saves costs—for example, overtime payments
(required to support time-consuming traditional budgeting processes) can
be eliminated; similarly, part-time (temporary) help to support the traditional
budget-preparation process can be reduced or eliminated. Managers are
“freed” to attend to more strategic imperatives.
4. Driver-based budgets make managers accountable—situations such as
decreases in efficiency or unused capacity become more visible under
driver-based budgeting.
5. Driver-based budgeting provides insight and agility—if drivers are
appropriately chosen, then information about # of transactions and cost-
driver quantities for the period aid in the end–of-month evaluation of
Chapter 10 – Strategy and the Master Budget
10–84
productivity ratios, unit resource costs, etc.).
7. Driver-based budgeting may decrease the amount of “gaming behavior” on
the part of managers and employees. With driver-based budgeting causal
relationships are transparent, a situation that can limit the opportunity for
“gaming.” There is simply less opportunity to fool senior managers if all of
the assumptions in budgets are laid out for everyone to see.
10–56 (Continued-5)
Cons
1. Driver-based budgeting is perceived to be difficult to implement.
2. Driver-based budgets require a sophisticated information processing system–
-that is, the ability to capture, across the organization, key resource drivers,
activity cost drivers, and activities.
Chapter 10 – Strategy and the Master Budget
10–85
10-57 Budgets for a Service Firm (45-50 Minutes)
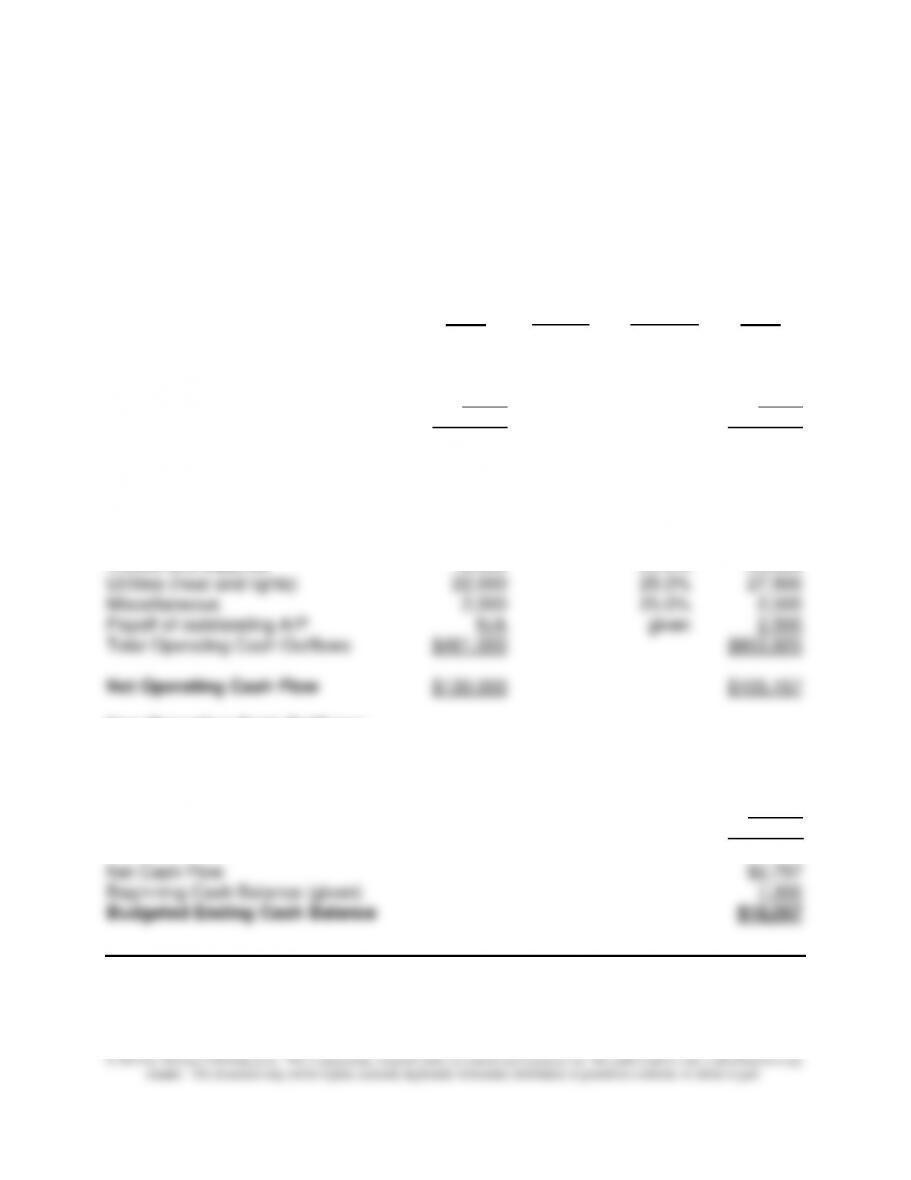
1. The annual cash budget is presented on the next page.
2. Operating problems that Triple-F Health Club could experience include:
▪ The cash contribution from lessons and classes will decrease because the
projected wage increase for lesson and class employees is significantly greater
than the projected increases in revenues (i.e., in additional volume). Last year,
the cash generated from these operations was $39,000 ($234,000 – $195,000).
The 2015 projection is only $12,675 ($304,200 – $291,525).
▪ Operating expenses are increasing faster than revenues from membership fees.
Last year (2014), cash generated from regular operations was $91,000
avoid cash crises, the club should prepare monthly cash budgets to help cash
management.
▪ Non-operational payments are projected to use up virtually all of the cash
generated from operations. Given the recent declines in mortgage interest rates,
management should consider refinancing this debt to reduce this cash drain.
3. Jane Crowe’s concern with regard to the Board’s expansion goals is justified. The
2015 budget projections show only a minimal increase in the cash balance (i.e., an
increase of only $2,757). The total cash available is well short of the $60,000 annual
Chapter 10 – Strategy and the Master Budget
10–86
10–57 (continued)
TRIPLE-F HEALTH CLUB
Cash Budget
For the Year Ending October 31, 2015
Price
2014 Growth Increase 2015
Operating Cash Inflows:
Annual membership fees $355,000 3.0% 10.0% $402,215
Lesson and class fees 234,000 30.0% 304,200
Miscellaneous 2,000 33.33% 2,667
Total Operating Cash Inflows $591,000 $709,082
Operating Cash Outflows:
Manager’s salary and benefits $36,000 15.0% $41,400
Employee wages and benefits:
Regular employees 190,000 15.0% 218,500
Lesson and class employees 195,000 30.0% 15.0% 291,525
Towels and supplies 16,000 25.0% 20,000
Non-Operating Cash Outflows:
Payoff of equipment payable given $15,000
Mortgage principal given 30,000
Mortgage interest 32,4001
Planned equipment purchases given 25,000
Total Non-Operating Cash Outflow $102,400
1$360,000 × 0.09 = $32,400($360,000 = principal balance at beginning of the year)
10–87
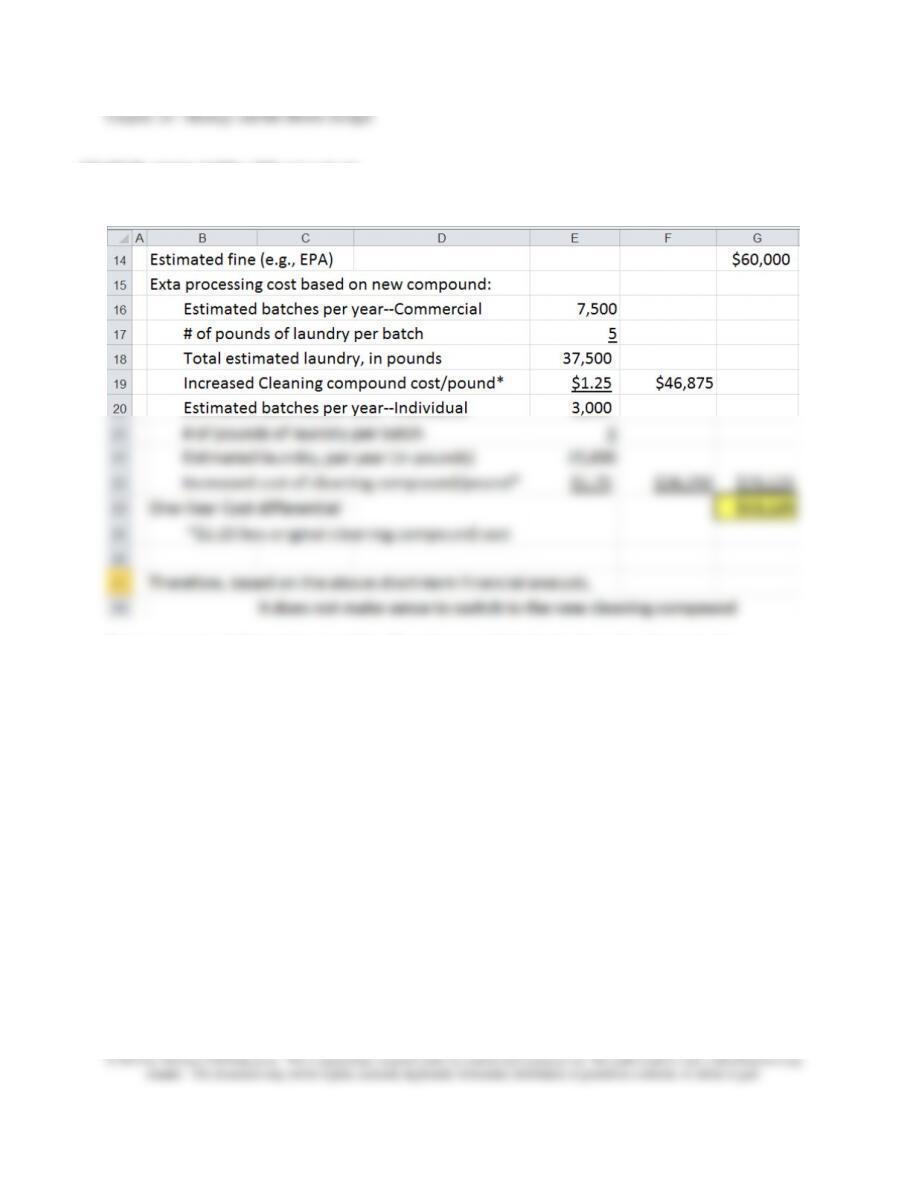
10–58 Sustainability (60 minutes)
Requirement 1: Short-Term Financial Analysis
For purposes of illustration (and for Requirement 3 below), the cell reference for
$13,125 (above) is G24; the cell reference for $60,000 (above) is G14.
Chapter 10 – Strategy and the Master Budget
10–88
Requirement #2: Assume the Switch to the New Compound and the Introduction of Continuous-
Improvement (Kaizen) Budgeting
Estimated increase in processing cost, per year with new compound (from above) =
$73,125
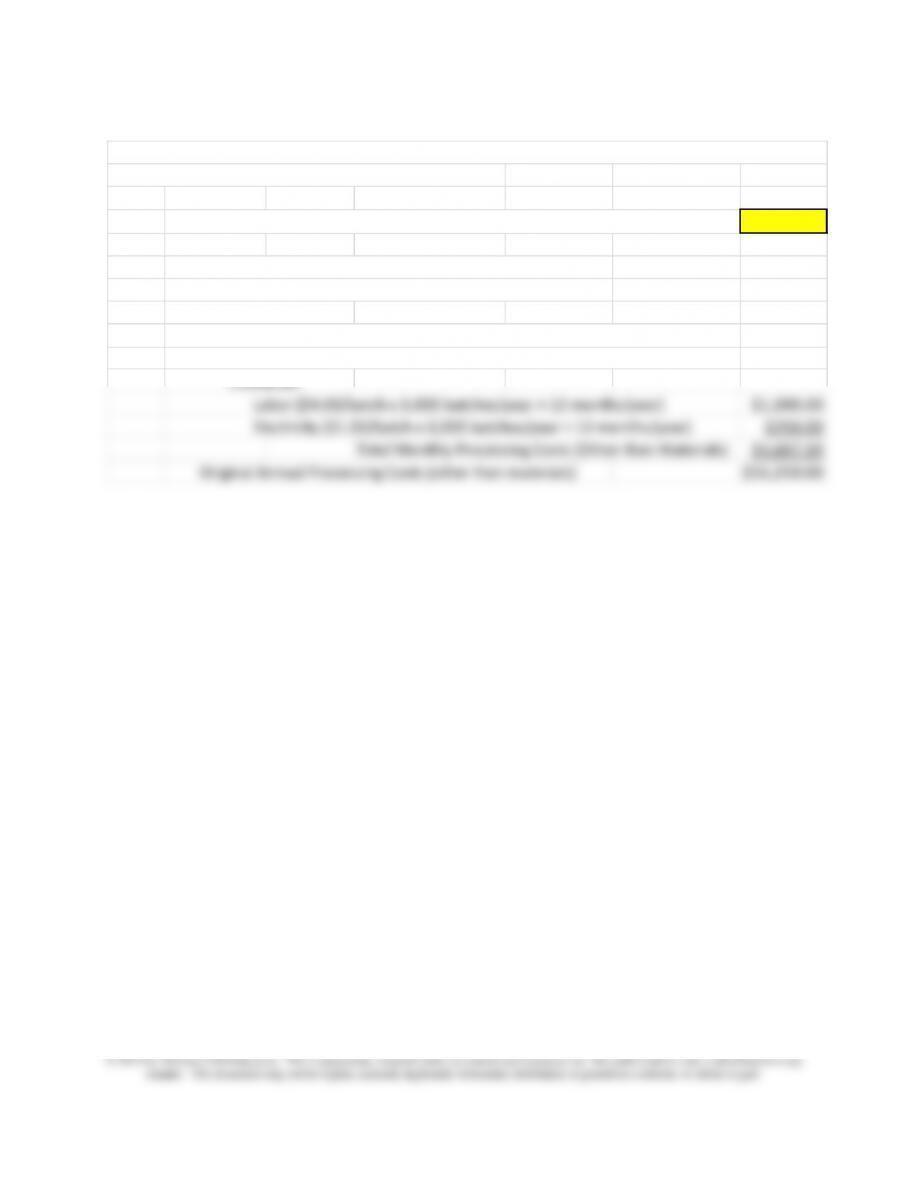
Estimated annual cost savings, per Kaizen budget:
Original Monthly Processing Costs (other than materials):
Commercial:
Labor ($4.00/batch x 7,500 batches/year ÷ 12 months/year) $2,500.00
Electricity ($1.50/batch x 7,500 batches/year ÷ 12 months/year) $937.50
Individual:
Labor ($4.00/batch x 3,000 batches/year ÷ 12 months/year) $1,000.00
Electricity ($1.00/batch x 3,000 batches/year ÷ 12 months/year) $250.00
Total Monthly Processing Costs (Other than Materials) $4,687.50
Original Annual Processing Costs (other than materials) $56,250.00