Unlock document.
This document is partially blurred.
Unlock all pages and 1 million more documents.
Get Access
Chapter 10 - Strategy and the Master Budget
10-61
Alternatively, the end-of-December Accounts Payable Balance = Purchases
made in December = answer to Part 5 above.
10-51 Retailer Budget (50 minutes)
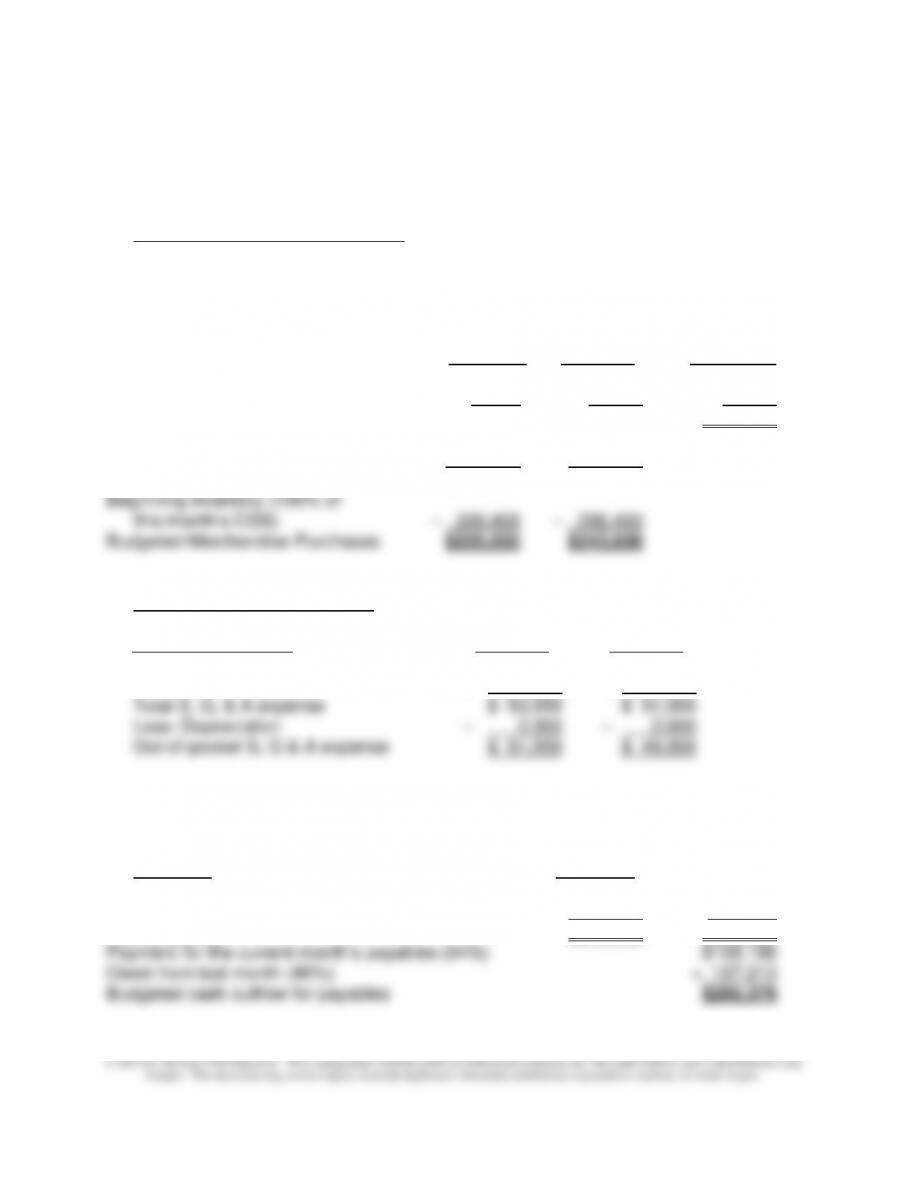
1. Budgeted merchandise purchases
D. Tomlinson Retail
Budgeted Merchandise Purchases
May and June
May June July
Sales (in units) 11,900 11,400 12,000
Cost per unit × $20 × $20 × $20
Cost of Goods Sold (CGS) $238,000 $228,000 $240,000
Ending inventory (130% of
next month’s CGS) + 296,400 + 312,000
Total needed $534,400 $540,000
2. Budgeted cash disbursements
S, G, & A expenses: May June
Sales revenue $357,000 $342,000
S, G, &A expense ratio × 0.15 × 0.15
D. Tomlinson Retail
Budgeted Cash Disbursements for Payables, June
May June
Merchandise purchases $ 225,000 $ 243,600
Out-of-Pocket S, G, &A expenses + 51,550 + 49,300
Total payables $276,550 $292,900
10-62
10-51 (Continued)
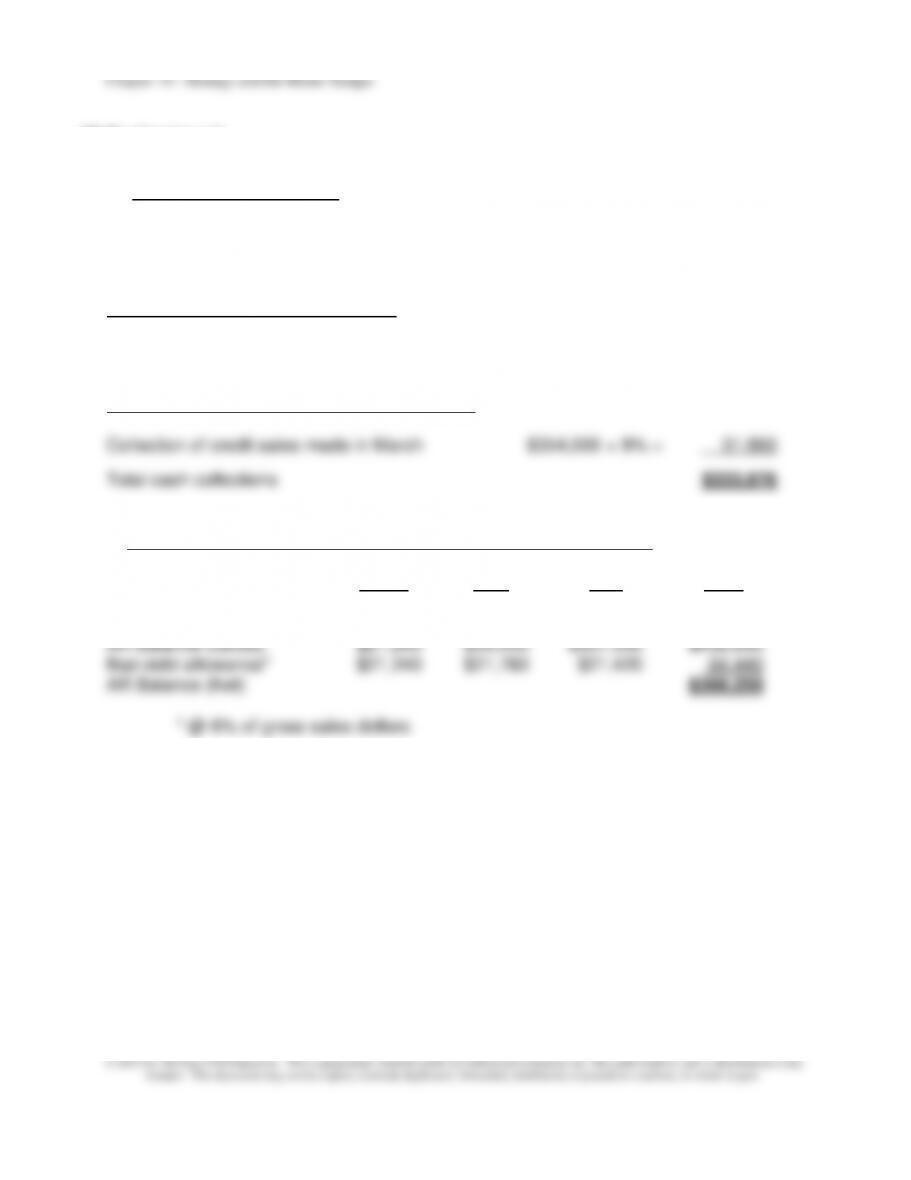
3. Budgeted cash collections
D. Tomlinson Retail
Cash Collections
May
From last month's (April) credit sales
Within the discount period ($363,000) × 60% × 97% = $211,266
After the discount period $363,000 × 25% = 90,750
From credit sales two months ago (i.e., March)
4. Gross and Net Balance of Accounts Receivable (AR) as of May 31
March April May Total
Sales $354,000 $363,000 $357,000
Remaining AR % 6% 15% 100%
Chapter 10 - Strategy and the Master Budget
10-63
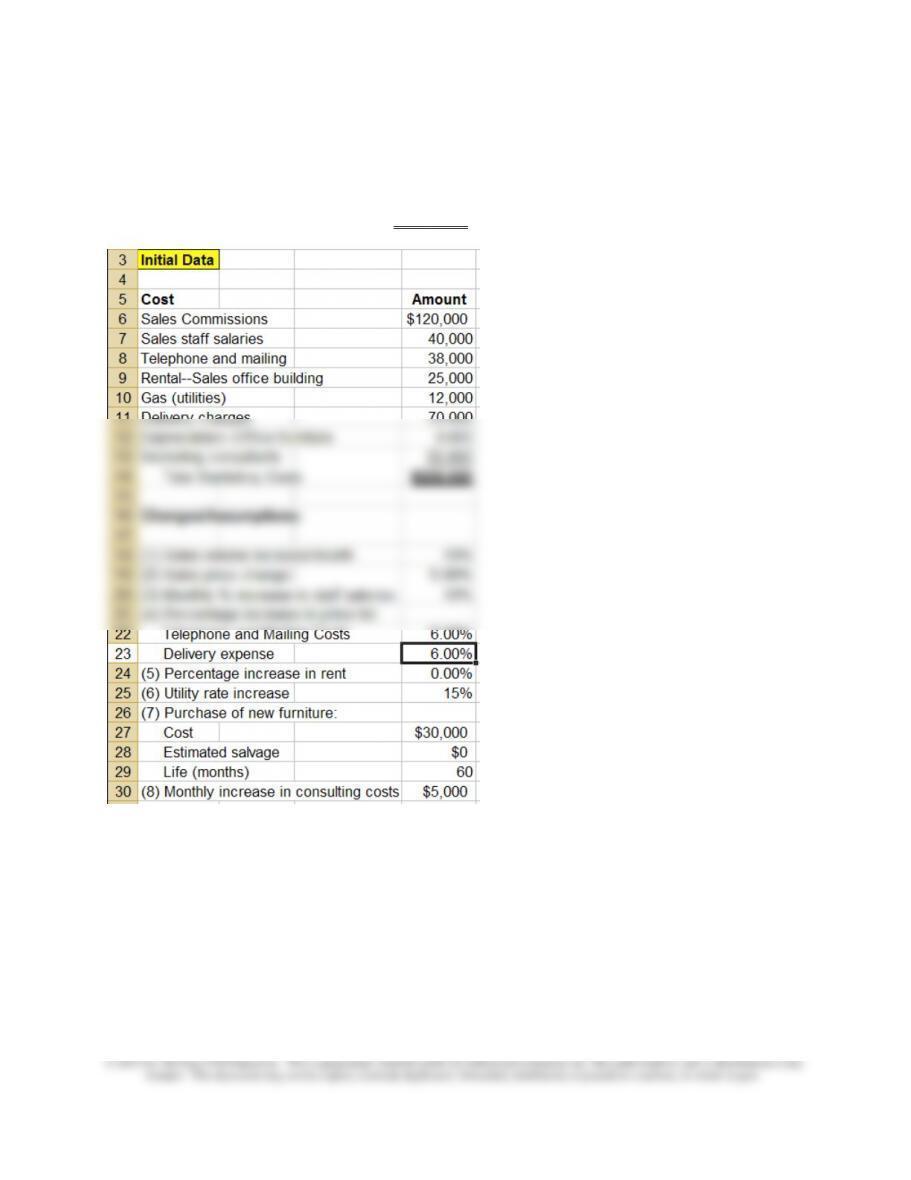
10-52 Budgeting for Marketing Expenses; Strategy (45-50 minutes)
1. The following screen shots are from the Excel spreadsheet created for this problem.
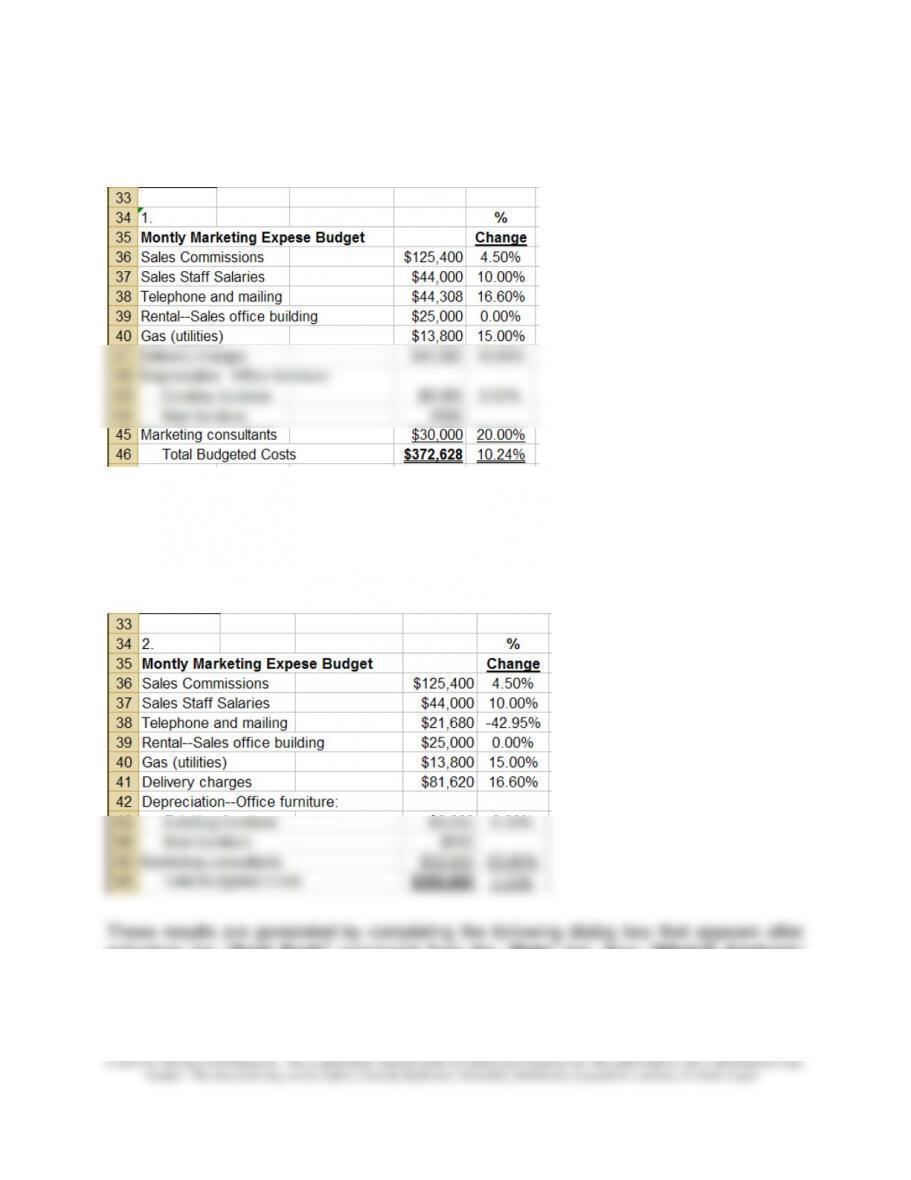
It shows that the original monthly budgeted marketing expense is $338,000 and that
the revised (budgeted) amount is $372,628, an overall increase of 10.24%.
Chapter 10 - Strategy and the Master Budget
10-64
10-52 (Continued-1)
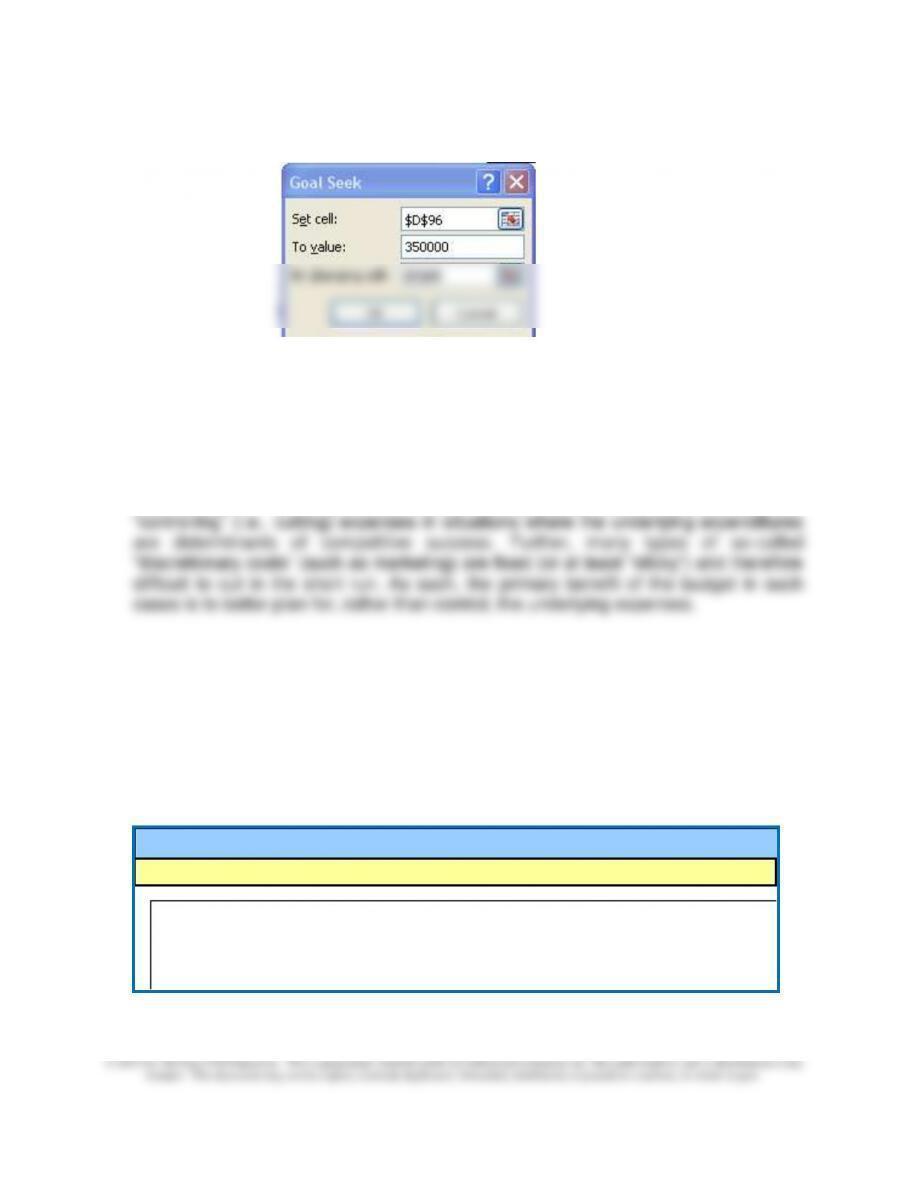
2. To achieve the monthly targeted cost of $350,000, the rate of “telephone and mailing”
costs cannot increase at all (as is the case in the proposed budget); in fact, the
results of the “goal seek” analysis indicates that such rates must be decreased by
approximately 43%, as shown below:
activating the “Goal Seek” command from the “Data” tab, then “What-If Analysis”
menu in Excel 2010:
Chapter 10 - Strategy and the Master Budget
10-65
10-52 (Continued-2)
3. As indicated in the text, budgets can be used both for control and for planning
purposes. The relative importance of each can be linked either to the competitive
strategy the business is pursuing or to the product life-cycle. In the present case
(start-up company, competing on the basis of a product-differentiation strategy), the
relative emphasis of the marketing budget is likely more for planning than control.
That is, the information contained in this budget can assist the company in
determining its financing needs. However, it probably should not be used for
Note to Instructor: The Excel 2010 spreadsheet solution referred to above is
embedded below. You can open the spreadsheet “object” by doing the following:
1. Right click anywhere in the worksheet area below.
2. Select “Worksheet Object,” then “Open.”
3. To return to the Word document, select “File” and then “Close and return to...”
while you are in the spreadsheet mode.
Problem 10-52: Budgeting for Marketing Expenses; Strateg
Background
You have been recruited by a former classmate, Susanna Wu
recently. The company produces a unique product-line of hy
aggressive marketing program. The company is in a start-up pha
and revenues upon which to rely for budgeting and planning pur

Chapter 10 - Strategy and the Master Budget
10-66
10-52 (Continued-3)
The following web-accessible tutorials regarding the use of Excel 2010 to perform
“What-If analysis” may be helpful:
1.Introduction to What-If Analysis:
http://office.microsoft.com/en-us/excel-help/introduction-to-what-if-analysis-HA010342628.aspx
2. Using Excel to Perform Scenario Analysis:
http://office.microsoft.com/en-us/excel-help/switch-between-various-sets-of-values-by-using-scenarios-
HP010072669.aspx
3. Using Excel to Create Data Tables:
http://office.microsoft.com/en-us/excel-help/calculate-multiple-results-by-using-a-data-table-
HP010342214.aspx
4. Using the Goal Seek Routine in Excel:
http://office.microsoft.com/en-us/excel-help/use-goal-seek-to-find-the-result-you-want-by-adjusting-an-
input-value-HP010342990.aspx
5. Using Solver to Perform What-If Analysis:
http://office.microsoft.com/en-us/excel-help/define-and-solve-a-problem-by-using-solver-
HP010342416.aspx
http://office.microsoft.com/en-us/excel-help/video-use-the-solver-add-in-VA101840549.aspx
Chapter 10 - Strategy and the Master Budget
10-67
% Change
in $20 DL cost Revised Revised Breakeven Unit Change % Change in
Component Variable Cost Contribution volume in Breakeven Breakeven
Situation (given) per Unit Margin per Unit (units) Point Point
Baseline 0.00% $64.00 $16.00 56,250 0 0.00%
1 4.00% $64.80 $15.20 59,211 2,961 5.26%
2 6.00% $65.20 $14.80 60,811 4,561 8.11%
3 8.00% $65.60 $14.40 62,500 6,250 11.11%
10-53 Profit Planning and Sensitivity Analysis (60 minutes)
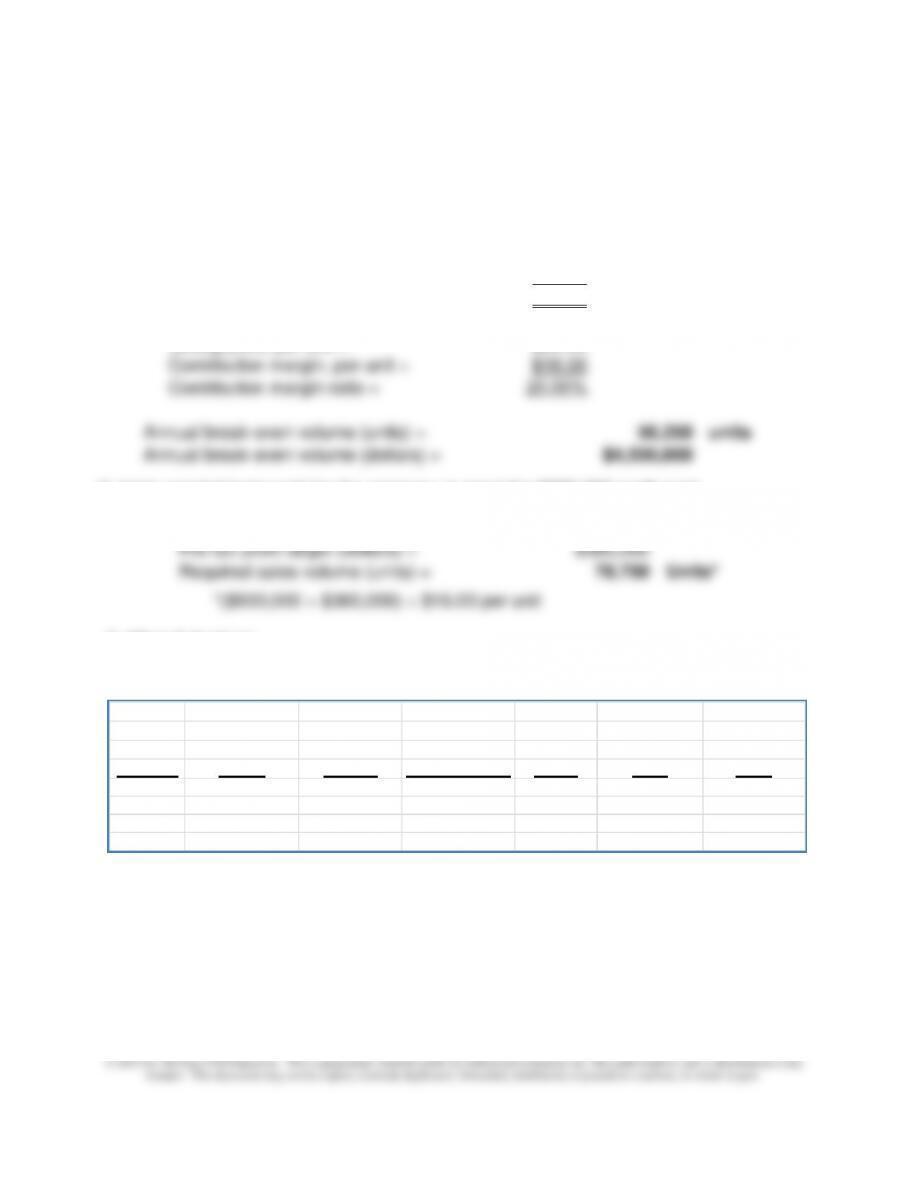
1. Break-even volume, in units and dollars, for the coming year:
Annual fixed costs =
$900,000
Contribution margin, per unit:
Selling price per unit =
$80.00
Variable cost, per unit =
$64.00
Contribution margin, per unit =
$16.00
Contribution margin ratio:
Selling price, per unit =
$80.00
Contribution margin, per unit =
$16.00
Contribution margin ratio =
20.00%
Annual break-even volume (units) =
56,250
units
Annual break-even volume (dollars) =
$4,500,000
2. Units needed to be sold for the company to meet the $360,000 profit goal:
Annual fixed costs (FC) =
$900,000
Pre-tax profit target (dollars) =
$360,000
Required sales volume (units) =
78,750
Units*
*($900,000 + $360,000) ÷ $16.00 per unit
3. What-If Analysis
Chapter 10 - Strategy and the Master Budget
10-68
10-53 (Continued-1)
4. Selling price per unit the company must charge to maintain the budgeted ratio of
contribution margin to sales (hint: Use the Goal-Seek function in Excel to answer this
question):
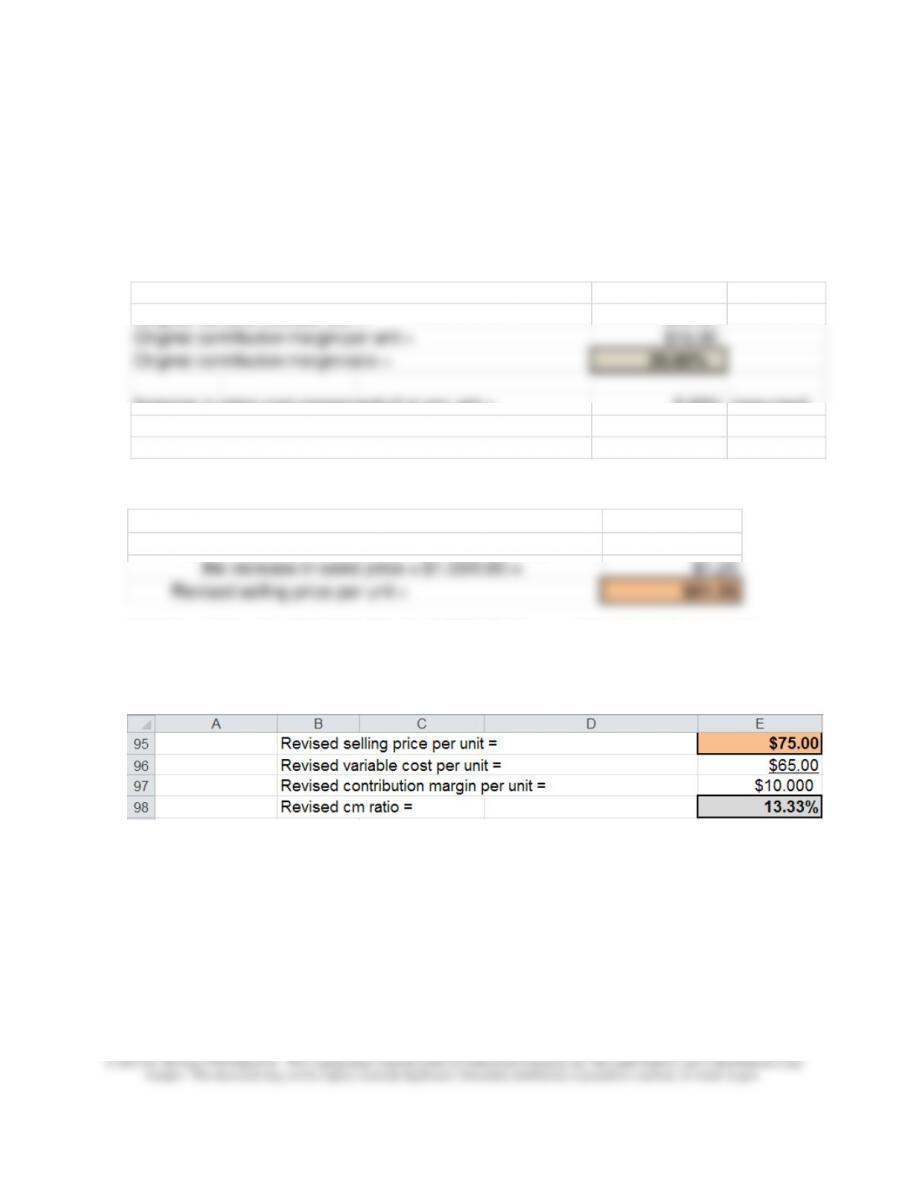
Original selling price per unit = $80.00
Original variable cost per unit = $64.00
Original contribution margin per unit = $16.00
Original contribution margin ratio = 20.00%
Increase in labor-cost component of vc per unit = 5.00% (assumed)
Labor-cost component of variable cost per unit = $20.00
Revised variable cost per unit = $65.00
Solution without Using Goal Seek
The increase in variable cost per unit = $65 − $64 = $1.00
Thus, to maintain the original cm ratio of 20.00%,
the increase in sales price = $1.00/0.80 = $1.25
Revised selling price per unit = $81.25
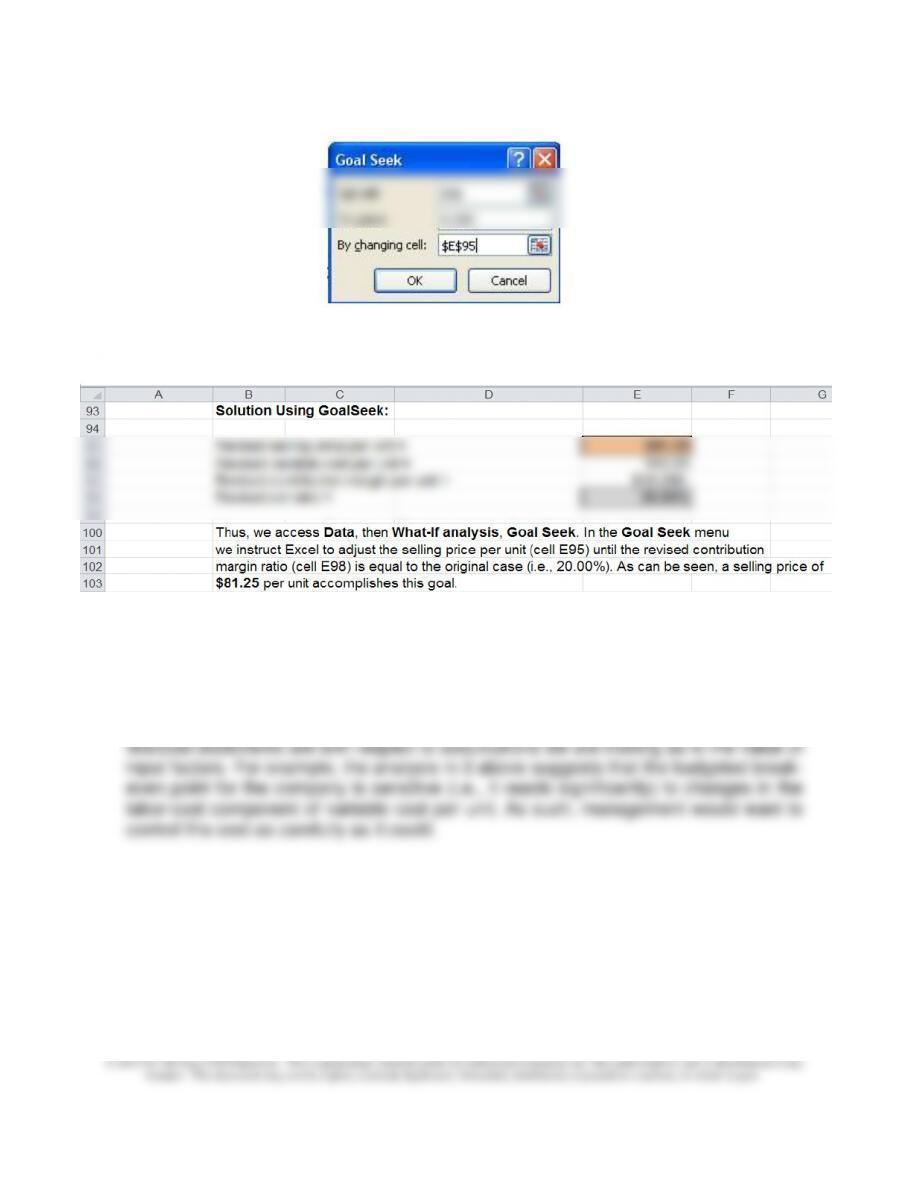
Solution Using Goal Seek in Excel (NOTE: Before running Goal Seek, make
sure under File → Options→ Formulas, "Maximum Change" is set at 0.0001.)
Step One: Set Up Model
Note: formula in cell E97 is: =E95-E96; formula in cell E98 is: =E97/E95
Step Two: Call the Goal Seek Routine in Excel (go to Data, What-If Analysis, then
Goal Seek). Set up Goal Seek as follows:
Chapter 10 - Strategy and the Master Budget
10-69
10-53 (Continued-2)
Step Three: Results (based on Excel 2010)
5. As stated in the chapter, inputs to the construction of individual budgets are subject to
uncertainty. That is, the inputsrepresent forecasts (e.g., selling price per unit, sales
volume, and sales mix) and therefore are subject to estimation error. "What-if"
analysis is a tool that allows us to vary one or more of these inputs in order to
examine the resulting effect on one or more budgets (e.g., operating income or cash
flows). In essence, we attempt to determine howsensitive our budgets and forecasted

Chapter 10 - Strategy and the Master Budget
10-70
See the following tutorials for additional information about performing "what-if" analyses
using Excel 2010:
1.Introduction to What-If Analysis:
http://office.microsoft.com/en-us/excel-help/introduction-to-what-if-analysis-HA010342628.aspx
2. Using Excel to Perform Scenario Analysis:
http://office.microsoft.com/en-us/excel-help/switch-between-various-sets-of-values-by-using-scenarios-
HP010072669.aspx
3. Using Excel to Create Data Tables:
http://office.microsoft.com/en-us/excel-help/calculate-multiple-results-by-using-a-data-table-
HP010342214.aspx
4. Using the Goal Seek Routine in Excel:
http://office.microsoft.com/en-us/excel-help/use-goal-seek-to-find-the-result-you-want-by-adjusting-an-
input-value-HP010342990.aspx
5. Using Solver to Perform What-If Analysis:
http://office.microsoft.com/en-us/excel-help/define-and-solve-a-problem-by-using-solver-
HP010342416.aspx
http://office.microsoft.com/en-us/excel-help/video-use-the-solver-add-in-VA101840549.aspx
Chapter 10 - Strategy and the Master Budget
10-71
10-54 Cash-Flow Analysis; Sensitivity Analysis (50-60 minutes)
1. Estimated Cash Receipts, April 2013:
April Cash Receipts:
April cash sales (25.0% × $425,000) =
$106,250
April credit-card sales ($425,000 × 55% × 97%) =
226,738
Collection of accounts receivable:
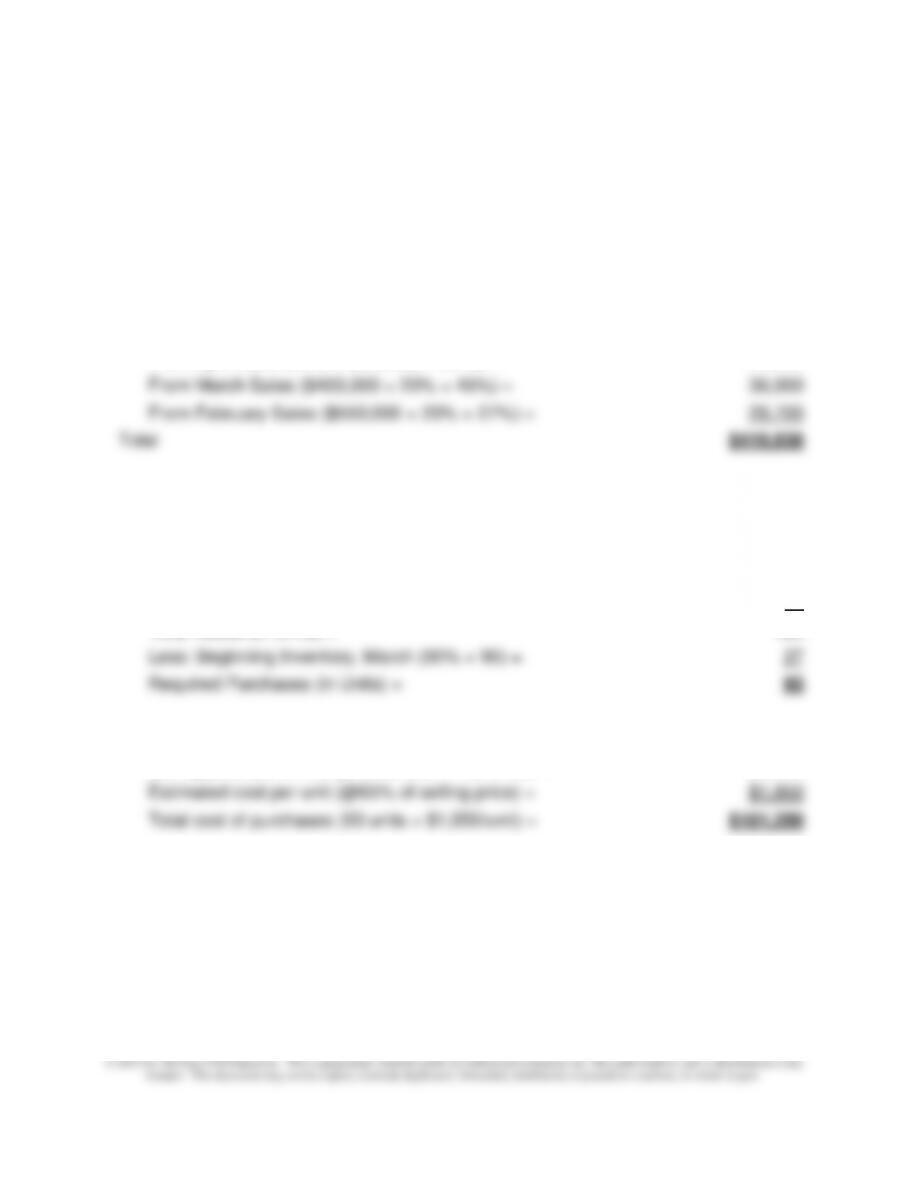
From April Sales (20% × $425,000 × 25%) =
21,250
From March Sales ($400,000 × 20% × 45%) =
36,000
From February Sales ($550,000 × 20% × 27%) =
29,700
Total
$419,938
2. Purchase Order for Hardware, executed January 25th:
a) Number of units to be ordered:
Estimated Unit Sales, March =
90
Plus: Desired Ending Inv., March (30% × 100) =
30
Total Needs (in Units) =
120
Less: Beginning Inventory, March (30% × 90) =
27
Required Purchases (in Units) =
93
b) Cost of purchases:
Selling price per unit (e.g., $300,000 ÷ 100 units) =
$3,000
Estimated cost per unit (@65% of selling price) =
$1,950
Total cost of purchases (93 units × $1,950/unit) =
$181,350
Note that the cash outflow associated with these purchases will be
4/10/2013.
Chapter 10 - Strategy and the Master Budget
10-72
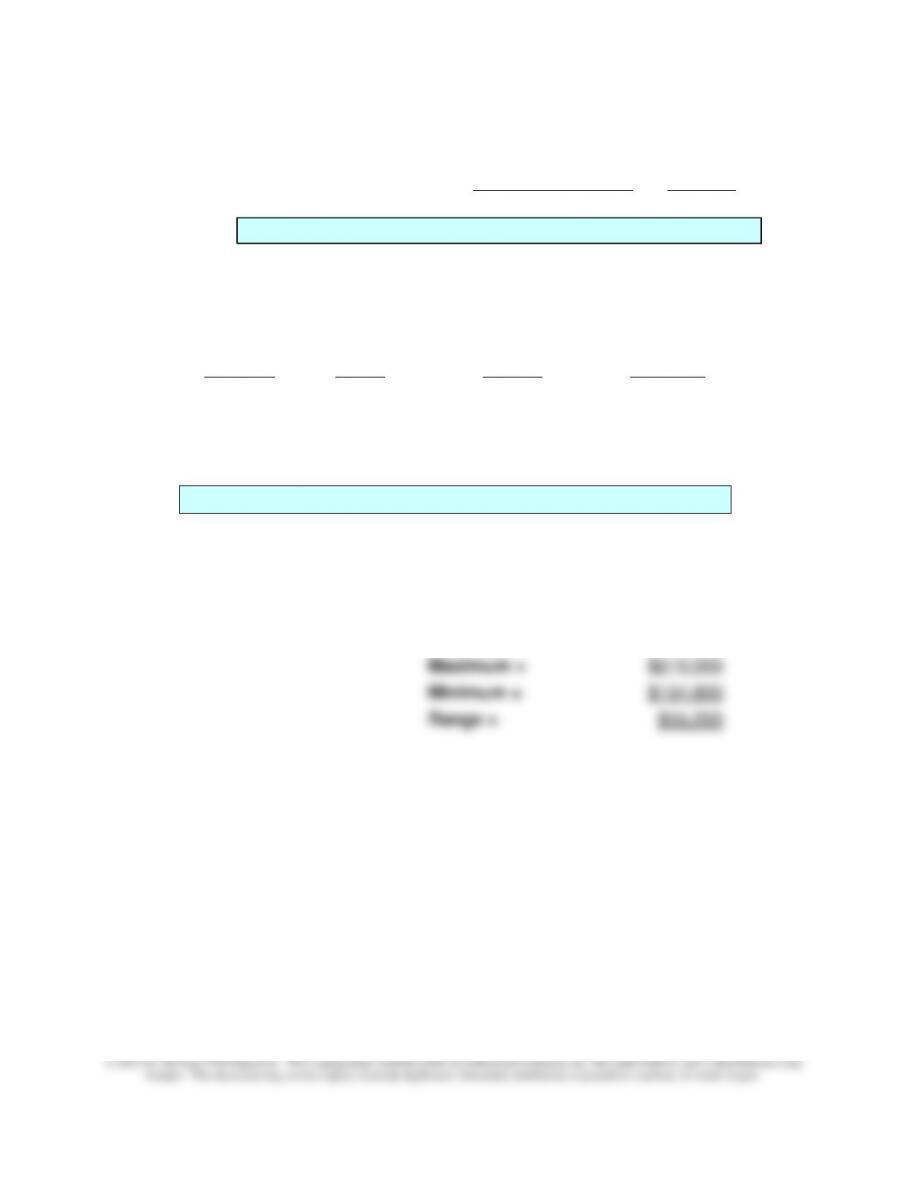
3. Sensitivity Analysis: Three Scenarios for March Sales and the CGS
Est. Sales--March CGS %
Optimistic Estimate = 100 60%
Base-line Estimate = 90 65%
Pessimistic Estimate = 80 70%
10-54 (Continued-1)
March Sales
Cash
Payment
Scenario
(units)
CGS %
April 10th
1
100
60%
$180,000
2
100
65%
$195,000
3
100
70%
$210,000
4
90
60%
$167,400
5
90
65%
$181,350
6
90
70%
$195,300
7
80
60%
$154,800
8
80
65%
$167,700
9
80
70%
$180,600
Maximum =
$210,000
Minimum =
$154,800
Range =
$55,200
Chapter 10 - Strategy and the Master Budget
10-73
10-54 (Continued-2)
4. Monthly cash budgets are prepared by companies such as CompCity, Inc., in order to
plan for their cash needs. This means identifying when both excess cash and cash
shortages may occur. A company needs to know when cash shortages will occur so
that prior arrangements can be made with lending institutions in order to have cash
available for borrowing when the company needs it. At the same time, a company
adjustments to plans. In practice, management might view the baseline outcome as
the expected value prediction. It might define, subjectively, "optimistic" and
"pessimistic" values as those having a small probability (e.g., 10% or less).
The following web-accessible tutorials regarding the use of Excel 2010 to
perform “What-If analysis” may be helpful:
1.Introduction to What-If Analysis: http://office.microsoft.com/en-us/excel-
help/introduction-to-what-if-analysis-HA010342628.aspx
2. Using Excel to Perform Scenario Analysis:
http://office.microsoft.com/en-us/excel-help/switch-between-various-sets-of-
values-by-using-scenarios-HP010072669.aspx
3. Using Excel to Create Data Tables:http://office.microsoft.com/en-
us/excel-help/calculate-multiple-results-by-using-a-data-table-
HP010342214.aspx
4. Using the Goal Seek Routine in Excel:http://office.microsoft.com/en-
us/excel-help/use-goal-seek-to-find-the-result-you-want-by-adjusting-an-input-
value-HP010342990.aspx
Chapter 10 - Strategy and the Master Budget
10-74
10-55 Budgeting Customer Retention and Insurance-Policy Renewal; Sensitivity Analysis (75-90 Minutes)
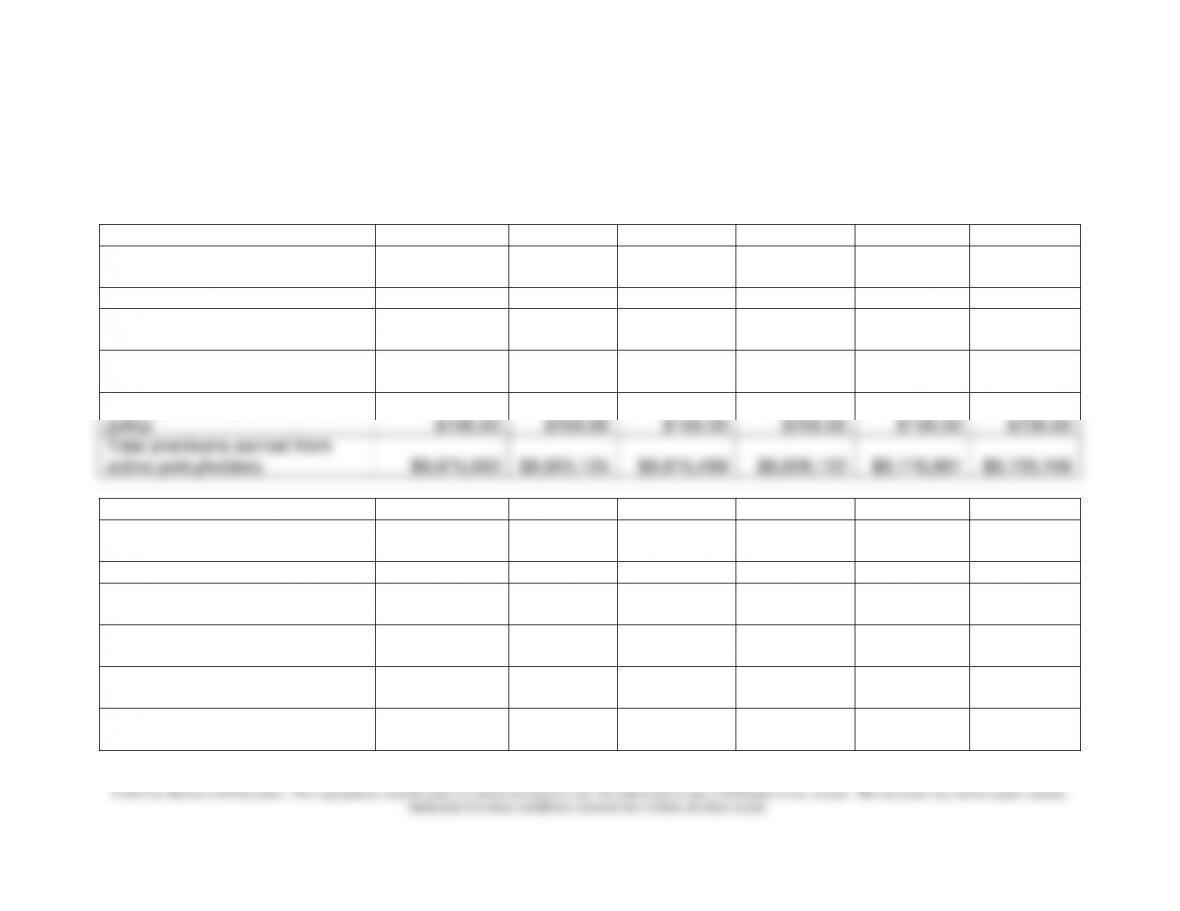
1. Budget for Customer-Retention and Premiums Earned
Budget Item
January
February
March
April
May
June
No. of active policyholders,
beginning of the month
100,000
99,500
99,003
98,507
98,015
97,525
Mid-term cancellation rate (%)
0.50%
0.50%
0.50%
0.50%
0.50%
0.50%
No. of active policyholders, end
of the month
99,500
99,003
98,507
98,015
97,525
97,037
Average no. of active
policyholders during the month
99,750
99,251
98,755
98,261
97,770
97,281
Average monthly premium per
policy
$100.00
$100.00
$100.00
$100.00
$100.00
$100.00
Total premiums earned from
active policyholders
$9,975,000
$9,925,125
$9,875,499
$9,826,122
$9,776,991
$9,728,106
Budget Item
July
August
September
October
November
December
No. of active policyholders,
beginning of the month
97,037
96,552
96,069
95,589
95,111
94,635
Mid-term cancellation rate (%)
0.50%
0.50%
0.50%
0.50%
0.50%
0.50%
No. of active policyholders, end
of the month
96,552
96,069
95,589
95,111
94,635
94,162
Average no. of active
policyholders during the month
96,795
96,311
95,829
95,350
94,873
94,399
Average monthly premium per
policy
$100.00
$100.00
$100.00
$100.00
$100.00
$100.00
Total premiums earned from
active policyholders
$9,679,466
$9,631,068
$9,582,913
$9,534,999
$9,487,324
$9,439,887
Chapter 10 - Strategy and the Master Budget
10-75
10-55 (Continued-1)
Active policies, end of December
94,162
Policy renewal rate
85.00%
No. of estimated policyholders, beginning of new year
80,038
2.
As stated in the chapter, inputs to the construction of individual budgets are subject to
uncertainty. That is, the inputs represent forecasts (e.g., selling price per unit, sales
volume, and sales mix) and therefore are subject to estimationerror. "What-if" analysis
is a tool that allows us to vary one or more of these inputs in order to examine the
resulting effect on one or more budgets (e.g., operating income or cash flows). In
essence, we attempt to determine howsensitive our budgets and forecasted financial
statements are with respect to assumptions we are making as to the value of input
factors. For example, in the present case we might be interested in knowing how the
assumption of mid-termcancellation rate affects monthly premium--is premium
revenue sensitive to this assumption? If so, then management maywant to carefully
monitor and control this rate.
The following web-accessible tutorials regarding the use of Excel 2010 to
perform “What-If analysis” may be helpful:
1.Introduction to What-If Analysis: http://office.microsoft.com/en-us/excel-
help/introduction-to-what-if-analysis-HA010342628.aspx
2. Using Excel to Perform Scenario Analysis: http://office.microsoft.com/en-
us/excel-help/switch-between-various-sets-of-values-by-using-scenarios-
HP010072669.aspx
us/excel-help/use-goal-seek-to-find-the-result-you-want-by-adjusting-an-input-
value-HP010342990.aspx
5. Using Solver to Perform What-If Analysis:
http://office.microsoft.com/en-us/excel-help/define-and-solve-a-problem-by-
using-solver-HP010342416.aspx


