Chapter 10 – Strategy and the Master Budget
10–31
10-40 Activity–Based Budgeting (ABB) (20-30 Minutes)
1. Budgeted Cost-
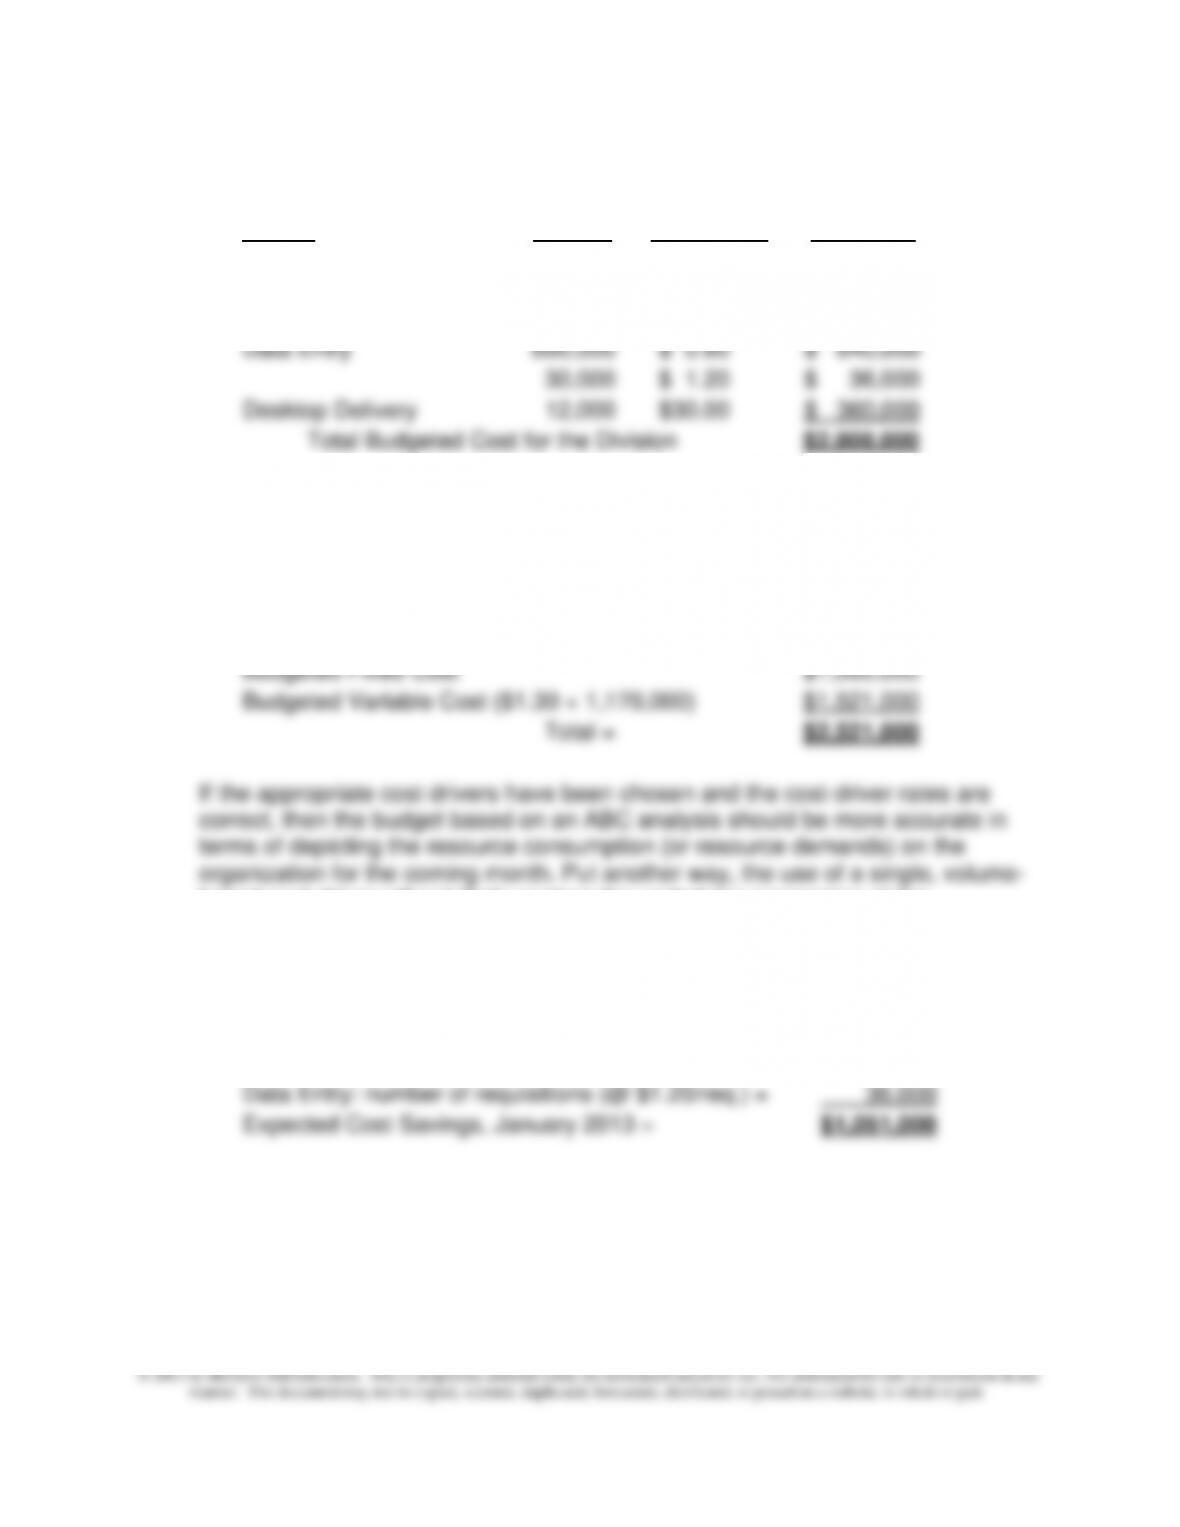
Activity Activity Driver Rate Total Cost
Storage 400,000 $0.4925 $ 197,000
Requisition Handling 30,000 $12.50 $ 375,000
Pick Packing 800,000 $ 1.50 $1,200,000
2. Activity-related data are not available. The only data you have is that budgeted
fixed cost per month is $1,000,000 and budgeted variable cost per carton is
$1.30. Using this approach, what is the estimated cost for the month? Compare
and comment on how your answer here differs from the answer to Requirement 1.
Budgeted Cost for the Month:
based cost driver will not likely capture the underlying economics of the
company’s support activities and associate cost.
3. Expected saving in costs—January 2013:
Requisition Handling (@ $12.50/requisition) = $ 375,000
Data Entry: number of lines (@ $0.80/line) = 640,000
Chapter 10 – Strategy and the Master Budget
10–32
10-40 (Continued)
The ABC cost-rate data included above represent the estimated cost of resources
that are currently supplied by the company but which could be eliminated by the
introduction of an electronic order-processing system. Note, however, that in order
to achieve these savings, management of the company must take actions to cut
model does not reflect the resource demands/resource consumption of the current
process regardingthe processing of customer orders.
Chapter 10 – Strategy and the Master Budget
10-41 Activity–Based Budgeting (ABB) with Kaizen (40 Minutes)
1. Unit-Level: Pick packing, Data entry—Lines
Batch-Level: Requisition handling, Data entry—Requisitions,
Desktop delivery
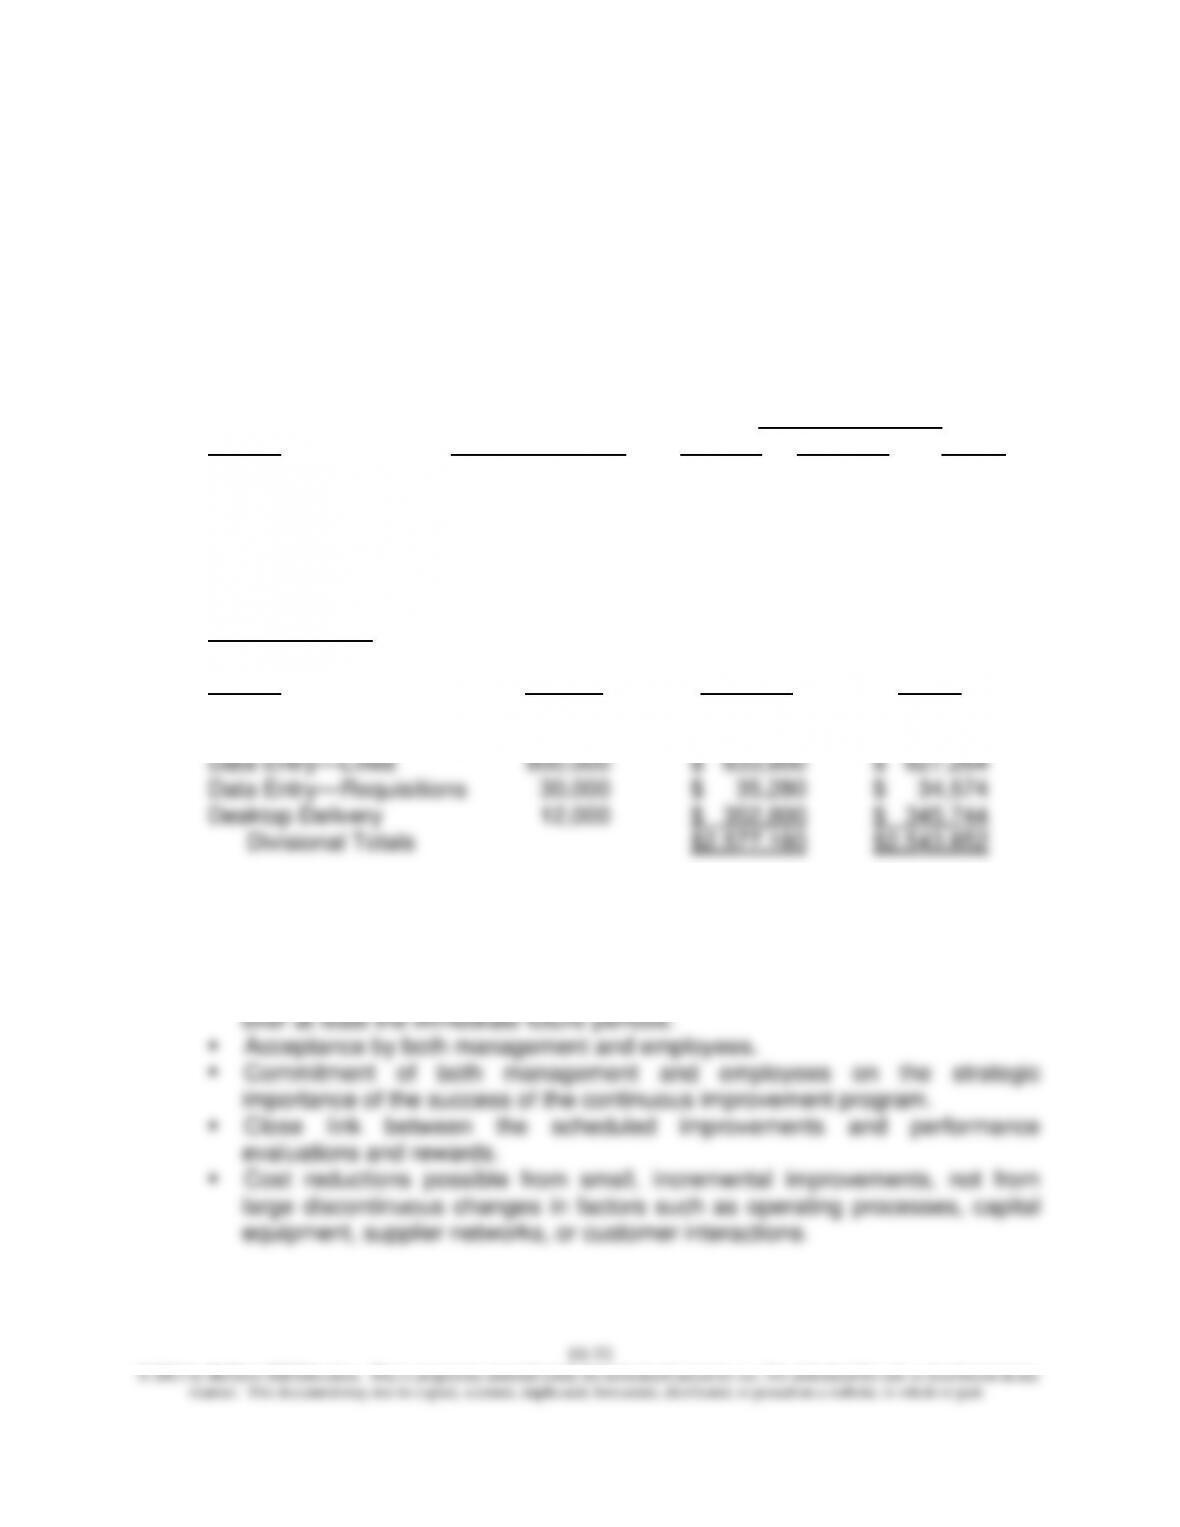
2. Cost-driver rates:
Cost-Reduction Cost-Driver Rates
Activity Rate (per month) January February March
Requisition Handling 98% $12.50 $12.250 $12.0050
Pick Packing 99% $ 1.50 $ 1.485 $ 1.4702
Data Entry—Lines 99% $ 0.80 $ 0.792 $ 0.7841
Data Entry—Requisitions 98% $ 1.20 $ 1.176 $ 1.1525
Desktop Delivery 98% $30.00 $29.400 $28.8120
Budgeted Costs:
Activity
Activity Volume February March
Requisition Handling 30,000 $ 367,500 $ 360,150
Pick Packing 800,000 $1,188,000 $1,176,120
3. Factors that may influence the success of a continuous improvement
(Kaizen)program include:
▪ Reasonable or achievable cost reductions.
▪ Awareness of all employees on the expected (scheduled) cost improvements
© 2013 by McGraw-Hill Education. This is proprietary material solely for authorized instructor use. Not authorized for sale or distribution in any
manner. This document may not be copied, scanned, duplicated, forwarded, distributed, or posted on a website, in whole or part.
10–34
10-41 (Continued)
4. Primary criticisms of Kaizen (continuous improvement) budgets include the
following:
▪ The budgeting process tends to place enormous pressure on employees
Chapter 10 – Strategy and the Master Budget
10–35
10-42 Time-Driven Activity-Based Budgeting (TDABB) (45-60 minutes)
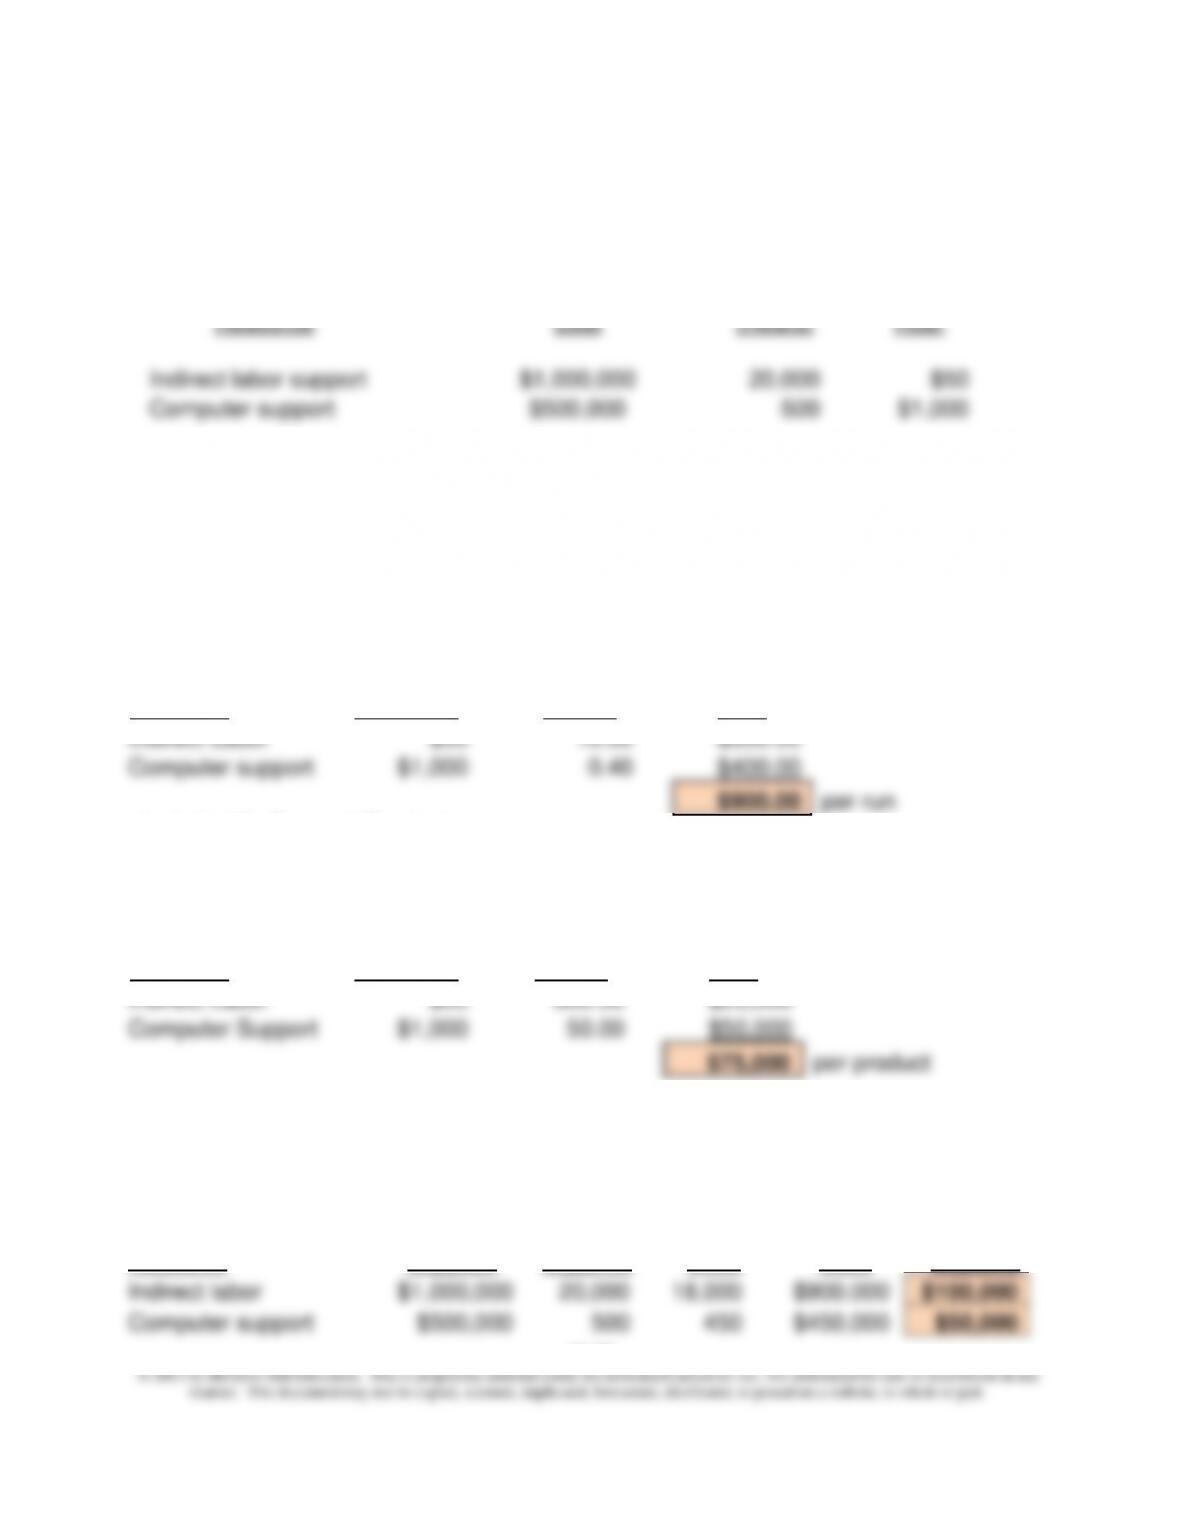
1. Calculation of budgeted resource costs per hour:
(Item 6)
(Item 5)
Practical
Budgeted
Budgeted
Capacity
Cost per
Resource
Cost
(Hours)
Hour
Indirect labor support
$1,000,000
20,000
$50
Computer support
$500,000
500
$1,000
2. Determination of the cost-driver rates for each activity (handle production runs, and
support product):
Activity #1: Handle Production Runs
(From 1
above)
(Item 3a,
4a)
Unit
Budgeted
Budgeted
Times
Cost-Driver
Resource
Cost/Hour
(hours)
Rate
Indirect Labor
$50
10.00
$500.00
Computer support
$1,000
0.40
$400.00
$900.00
per run
Activity #2: Support Products
(From 1
above)
(Item 3b,
4b)
Unit
Budgeted
Budgeted
Times
Cost-Driver
Resource
Cost/Hour
(hours)
Rate
Indirect Labor
$50
500.00
$25,000
Computer Support
$1,000
50.00
$50,000
$75,000
per product
3. Cost of unused capacity for the quarter, by resource:
(Item 6)
(Item 5)
(Given)
Cost of
Resource
Resource
Cost of
Cost of
Resource
Units
Units
Resources
Unused
Resource
Supplied
Supplied
Used
Used
Capacity
Indirect labor
$1,000,000
20,000
18,000
$900,000
$100,000
Computer support
$500,000
500
450
$450,000
$50,000
Chapter 10 – Strategy and the Master Budget
10–42 (Continued)
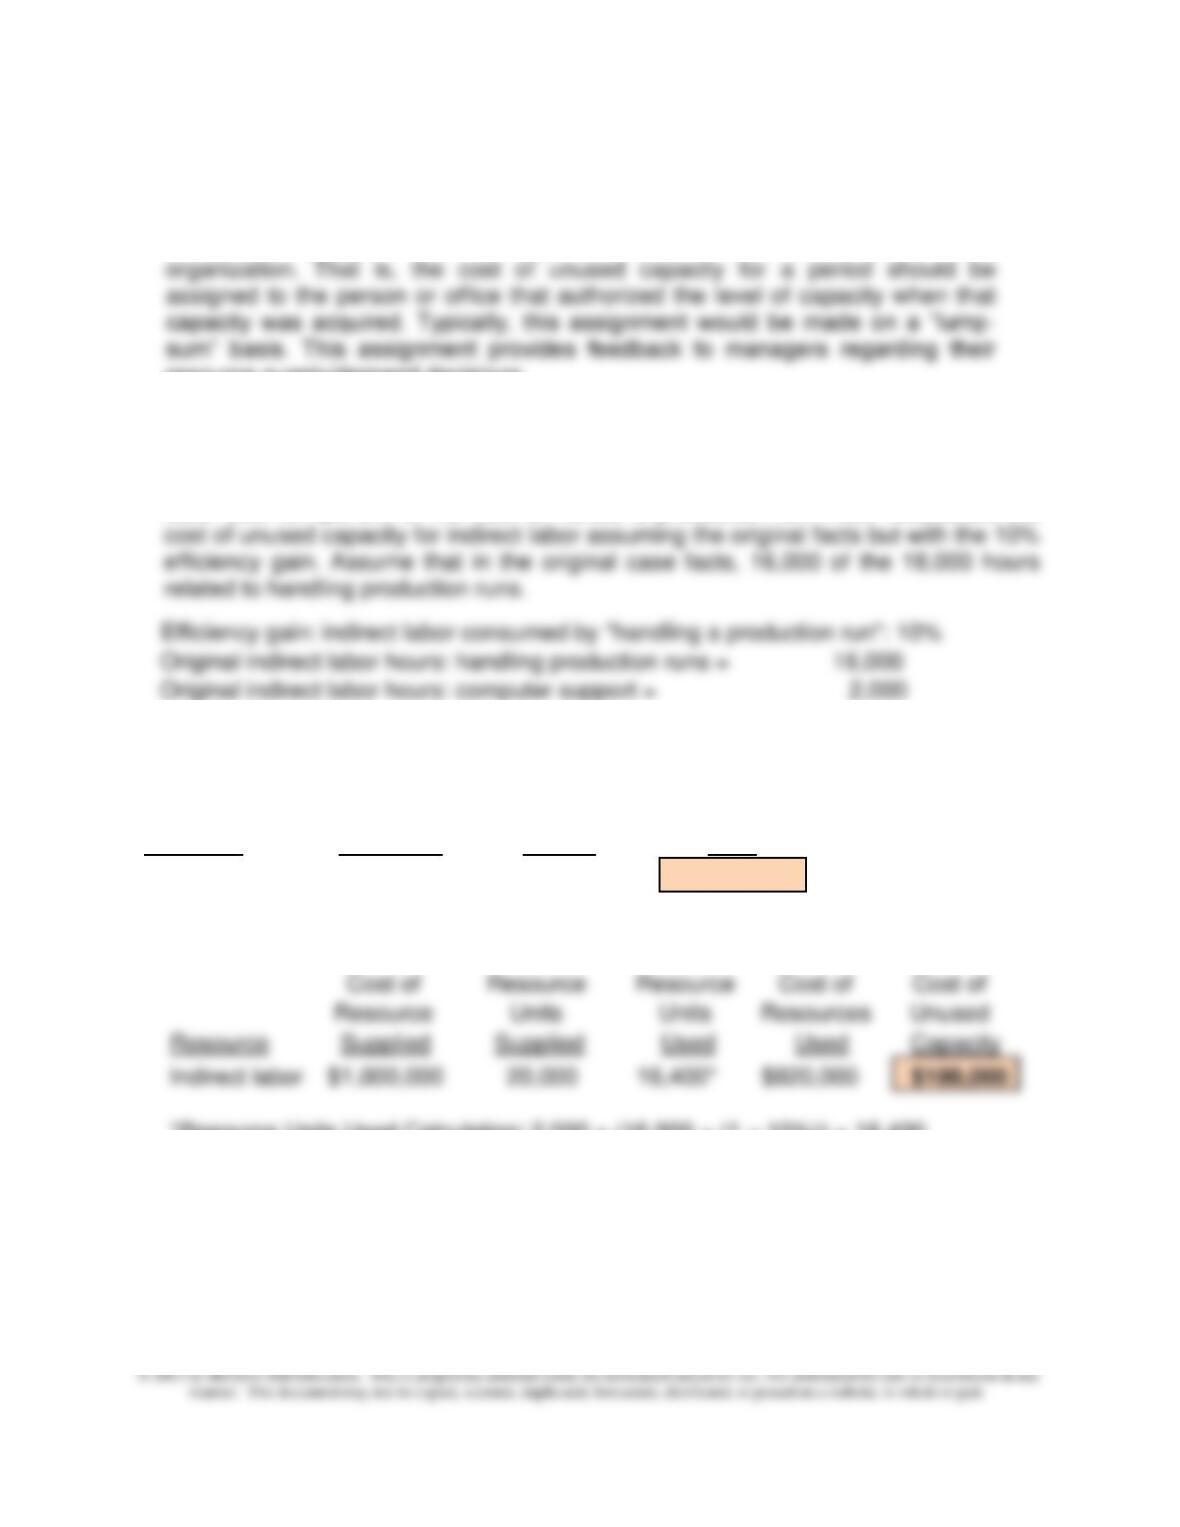
4. After implementing a TQM program, the company was able to implement process–
efficiency changes, the end result of which was a 10% reduction in the indirect labor
time associated with the activity “handling production runs.” Re-estimate the indirect
labor cost component of the cost to handle a production run. Also, recalculate the
Generally speaking, the cost of unused capacity should not be assigned to
actual units produced or customers served during the period. However, the cost
of unused capacity should not be ignored—it is someone’s responsibility in the
organization. That is, the cost of unused capacity for a period should be
assigned to the person or office that authorized the level of capacity when that
capacity was acquired. Typically, this assignment would be made on a “lump–
sum” basis. This assignment provides feedback to managers regarding their
resource supply/demand decisions.
Chapter 10 – Strategy and the Master Budget
10–37
10-43 Rolling Financial Forecasts (20 minutes)
1. “Rolling forecasts” of sales:
Month of
Forecast for Month of
Forecast
January
February
March
April
May
June
December
100
95
100
110
120
125
January
90
100
105
110
120
February
95
105
105
120
March
105
100
110
April
90
105
May
105
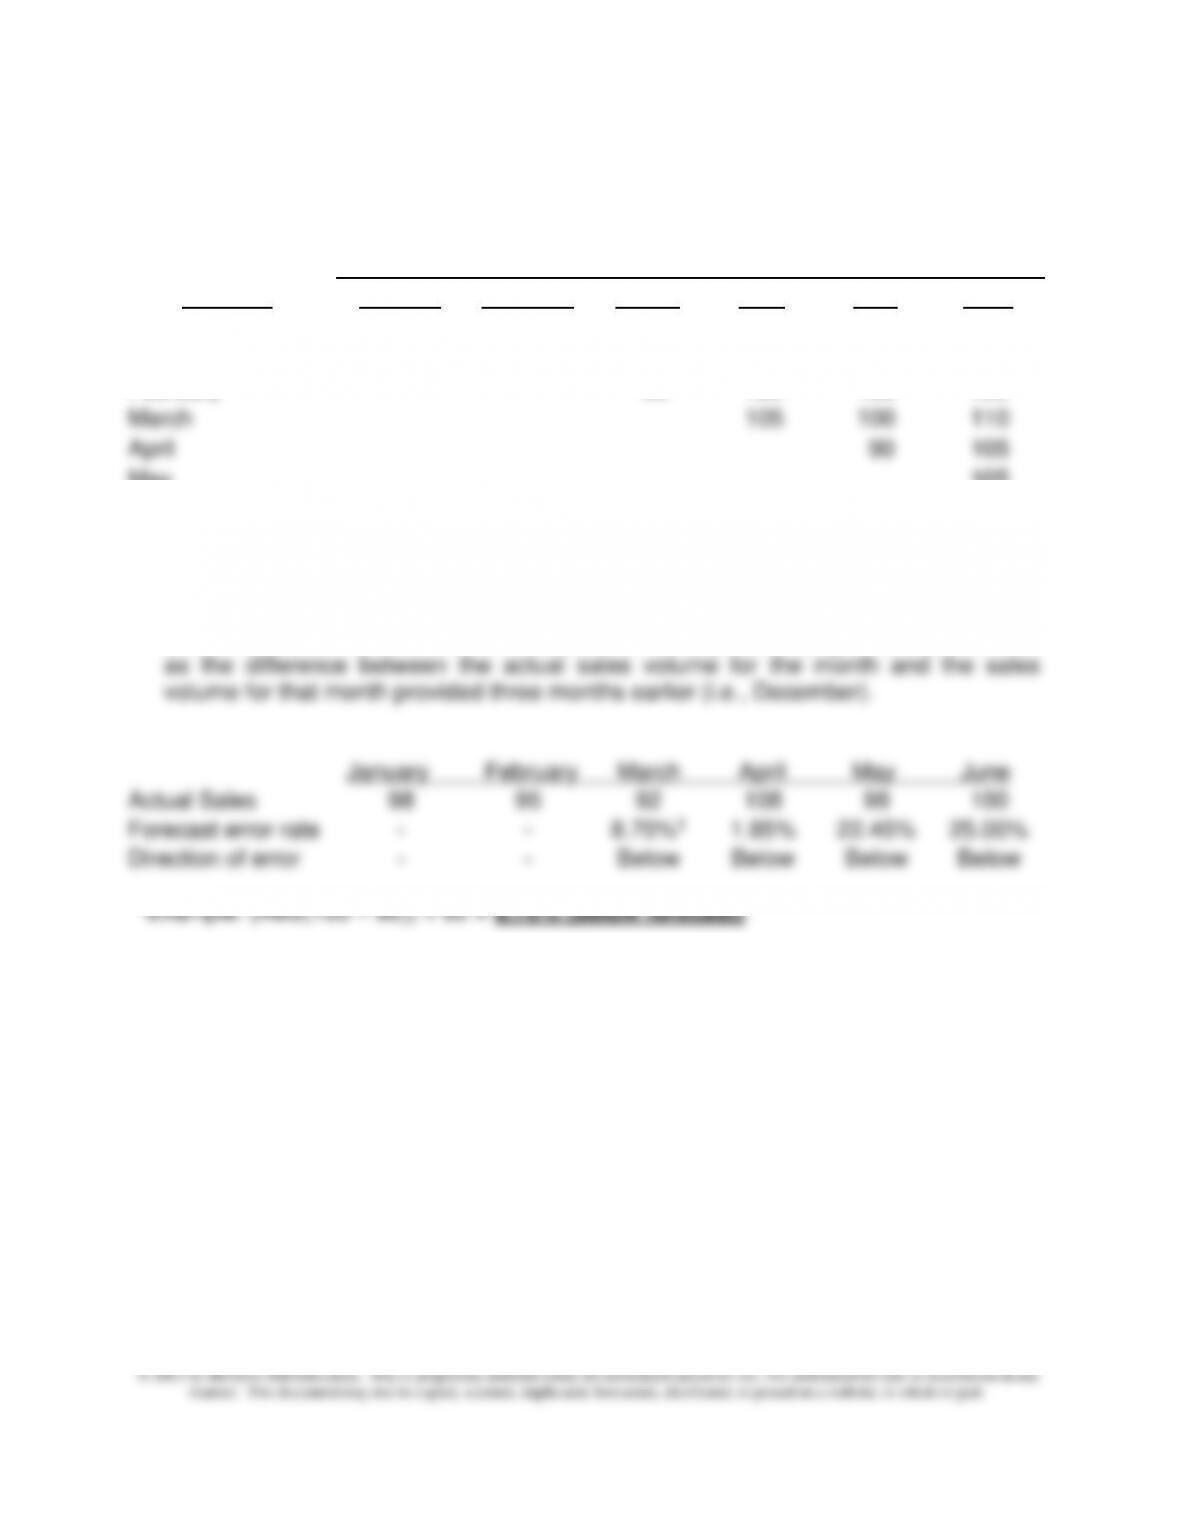
2. Three-month forecast error rates, March through June. (Note: Error rate = 1 –
absolute forecast error.) For example, the forecast error rate for March’s sales is
found by dividing the absolute value of the forecast error for this month by the actual
sales volume for the month. The forecast error for any month (e.g., March) is defined
Actual Sales
98
95
92
108
98
100
Forecast error rate
–
–
8.70%1
1.85%
22.45%
25.00%
Direction of error
–
–
Below
Below
Below
Below
1Example: (ABS(100 – 92)) ÷ 92 = 8.70% (below forecast)
Chapter 10 – Strategy and the Master Budget
10–38
10-44 Kaizen Budgeting (30-40 minutes)
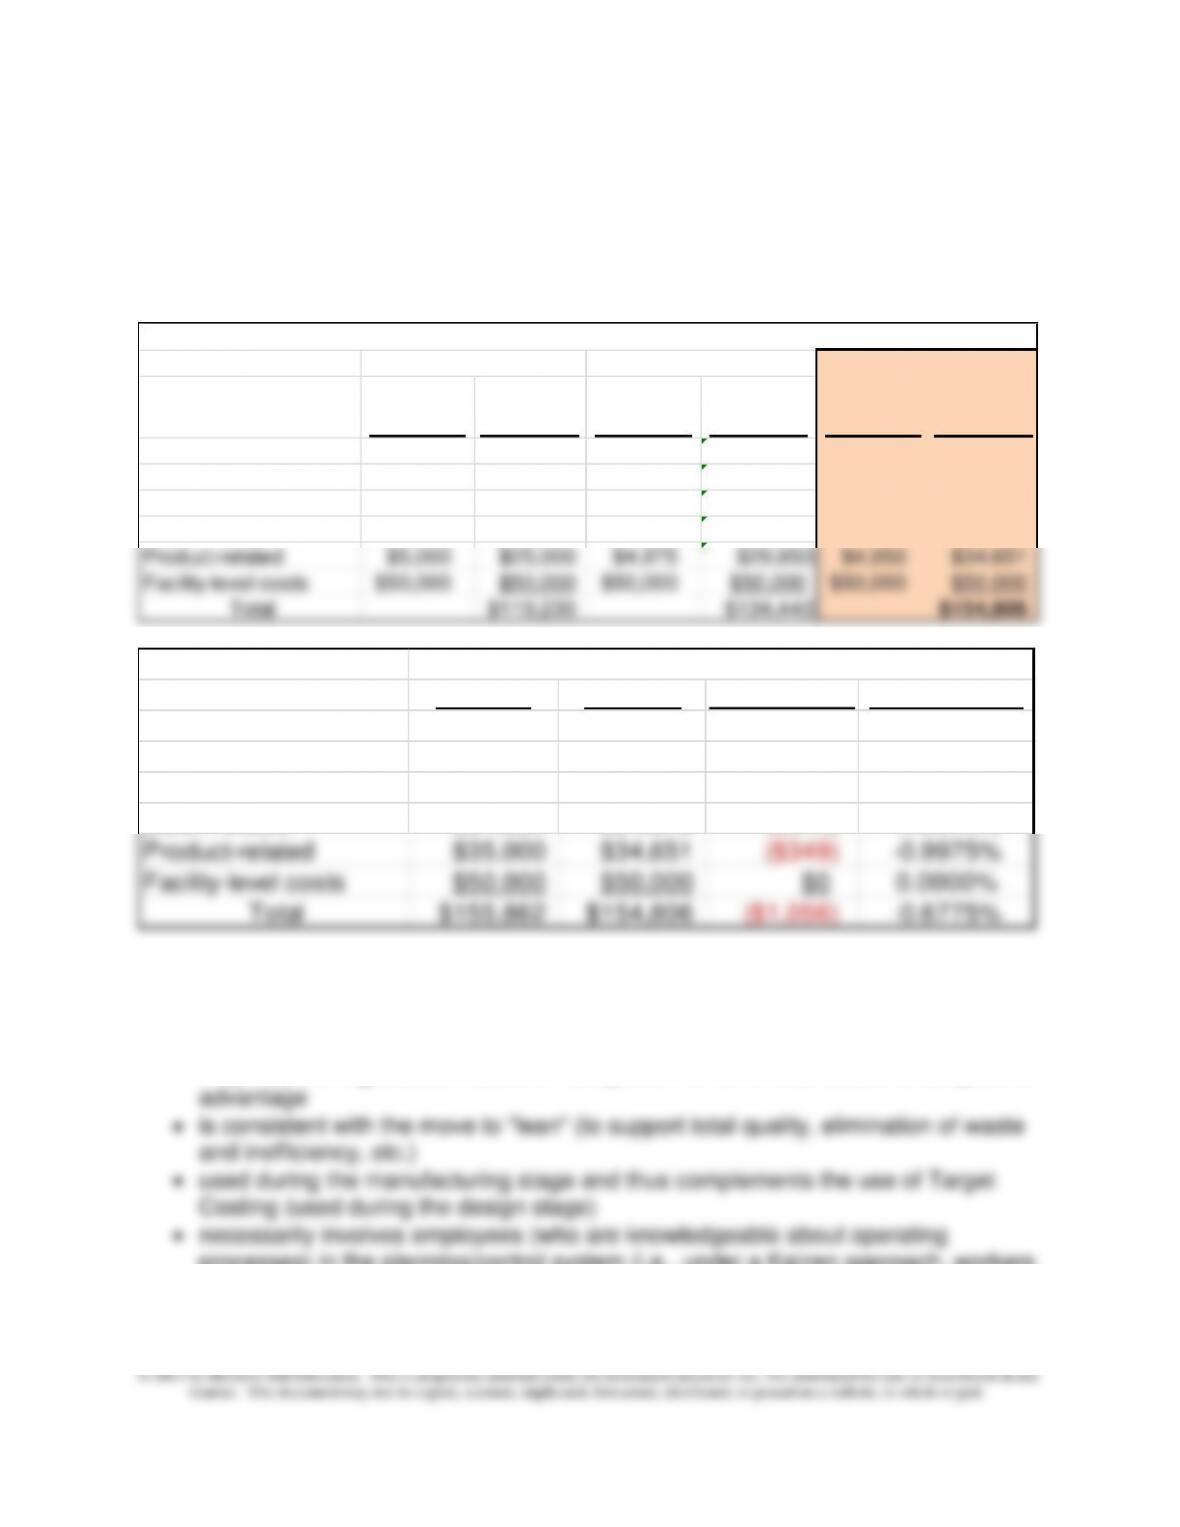
1. Recalculated budgeted factory overhead cost for June, under the assumption that,
starting in May, each budgeted cost-driver rate decreases by 0.5% relative to the
preceding month.
Cost Pools
Activity-
Cost Rate
Budgeted
Overhead
Activity-
Cost Rate
Budgeted
Overhead
Activity-
Cost Rate
Budgeted
Overhead
Semi-skilled, hour-relate
$0.60 $6,750 $0.597 $8,358 $0.594 $10,841
Skilled, hour-related $0.20 $900 $0.199 $1,114 $0.198 $1,445
Machine-hour-related $3.20 $21,280 $3.184 $26,172 $3.168 $33,297
Batch–related $1,700 $15,300 $1,692 $18,945 $1,683 $24,572
Product–related $5,000 $25,000 $4,975 $29,850 $4,950 $34,651
Facility-level costs $50,000 $50,000 $50,000 $50,000 $50,000 $50,000
Total $119,230 $134,440 $154,806
April
May
June
Activity-Based Budget (ABB)
Recap:
Cost Pools Original Revised $ Difference % Difference
Semi-skilled, hour-relate
$10,950 $10,841 ($109) –0.9975%
Skilled, hour-related $1,460 $1,445 ($15) –0.9975%
Machine-hour-related $33,632 $33,297 ($335) –0.9975%
Batch-related $24,820 $24,572 ($248) –0.9975%
Product-related $35,000 $34,651 ($349) –0.9975%
Facility-level costs $50,000 $50,000 $0 0.0000%
Total $155,862 $154,806 ($1,056) –0.6775%
Budgeted Amount for June
2. In general, the benefits associated with a move to continuous (i.e., Kaizen) budgeting
include the following:
• helps ensure that the budget is a forward-looking tool
• may help the organization stave off competition or otherwise secure a competitive
processes) in the planning/control system (i.e., under a Kaizen approach, workers
are assumed to have better knowledge as to how cost-saving goals can be
Chapter 10 – Strategy and the Master Budget
10–39
achieved); as such, its use is consistent with theories of decentralization and
worker empowerment
10-44 (Continued)
3. Principal concerns or limitations associate with Kaizen budgeting:
• a Kaizen approach places pressure on employees to meet continually revised (and
4. Examples of how Kerry Company could realize the cost savings referenced above in
Requirement 1: the activity cost rates are calculated as budgeted spending (on
resources) divided by the practical capacity (i.e., supply) of resources acquired.
Therefore, the rate can go down either because total budgeted spending is decreased,
or the supply of activities is increased while holding spending constant. Both would
seem to rest on notions of increasing efficiency. Some examples, referenced to text
Exhibit 10.19 might include the following:
• move to a JIT production system
• incorporate technology into (i.e., automate) the order-processing system used by
• requiring minimum order sizes (to eliminate short, unprofitable, production runs)
• effecting changes in the layout of the facility (e.g., to reduce movement and
storage of inventory
Notice, too, that in order to reduce spending (on resources), management has to take
direct and deliberate action to do so. This is due in large part because some of the
Chapter 10 – Strategy and the Master Budget
10–40
10-45 Resource Capacity Planning (20 minutes)
1. Likely result of the decision to raise prices?
Current calculation, fixed operating cost per meal = $1,100 ÷ 175 meals/day
= $6.29/meal
Recalculated fixed operating cost per meal, based on available capacity (meals per
attempt to recover “cost.” In all likelihood, however, the rising prices of meals would
exacerbate the situation, leading the business to a downward (or what some refer to
as “death”) spiral.
2. Alternative approach for allocating daily fixed operating cost to each meal:
The owners of this business should consider calculating the fixed operating cost per
meal based on “practical capacity.” This practice would avoid the downward business
spiral referred to above and attributable to an escalating “cost” per meal. In fact,
using some notion of capacity would allow the owners to make an assessment of the
Chapter 10 – Strategy and the Master Budget
10–41
10-46 Budgetary Pressure and Ethics (20-30 minutes)
1. The use of alternative accounting methods to manipulate reported earnings is
professionally unethical because it violates the Standards contained in the IMA’s
Statement of Ethical Professional Practice (see: www.imanet.org). The
Competence standard is violated because of failure to perform duties in
objectively.
2. Yes, costs related to revenue should be expensed in the period in which the
revenue is recognized (“matching principle”). Perishable supplies are purchased
for use in the current period, will not provide benefits in future periods, and should
therefore be matched against revenue recognized in the current period. In short,
the accounting treatment for supplies was not in accordance with generally
3. The actions of Gary Woods were appropriate. Upon discovering how supplies
were being accounted for, Wood brought the matter to the attention of his
immediate superior, Gonzales. Upon learning of the arrangement with P&R,
Wood told Gonzales that the action was improper; he then requested that the
accounts be corrected and the arrangement discontinued. Wood clarified the
approaching Lin without Gonzales’s knowledge and by having a confidential
discussion with an impartial advisor.
Chapter 10 – Strategy and the Master Budget
10–42
10–47 Comprehensive Profit Plan (90 minutes)
1. Sales Budget
Spring Manufacturing Company
Sales Budget
2013
C12 D57 Total
Sales (in units) 12,000 9,000 21,000
× Selling Price Per Unit $150 $220
Total Sales Revenue $1,800,000 $1,980,000 $3,780,000
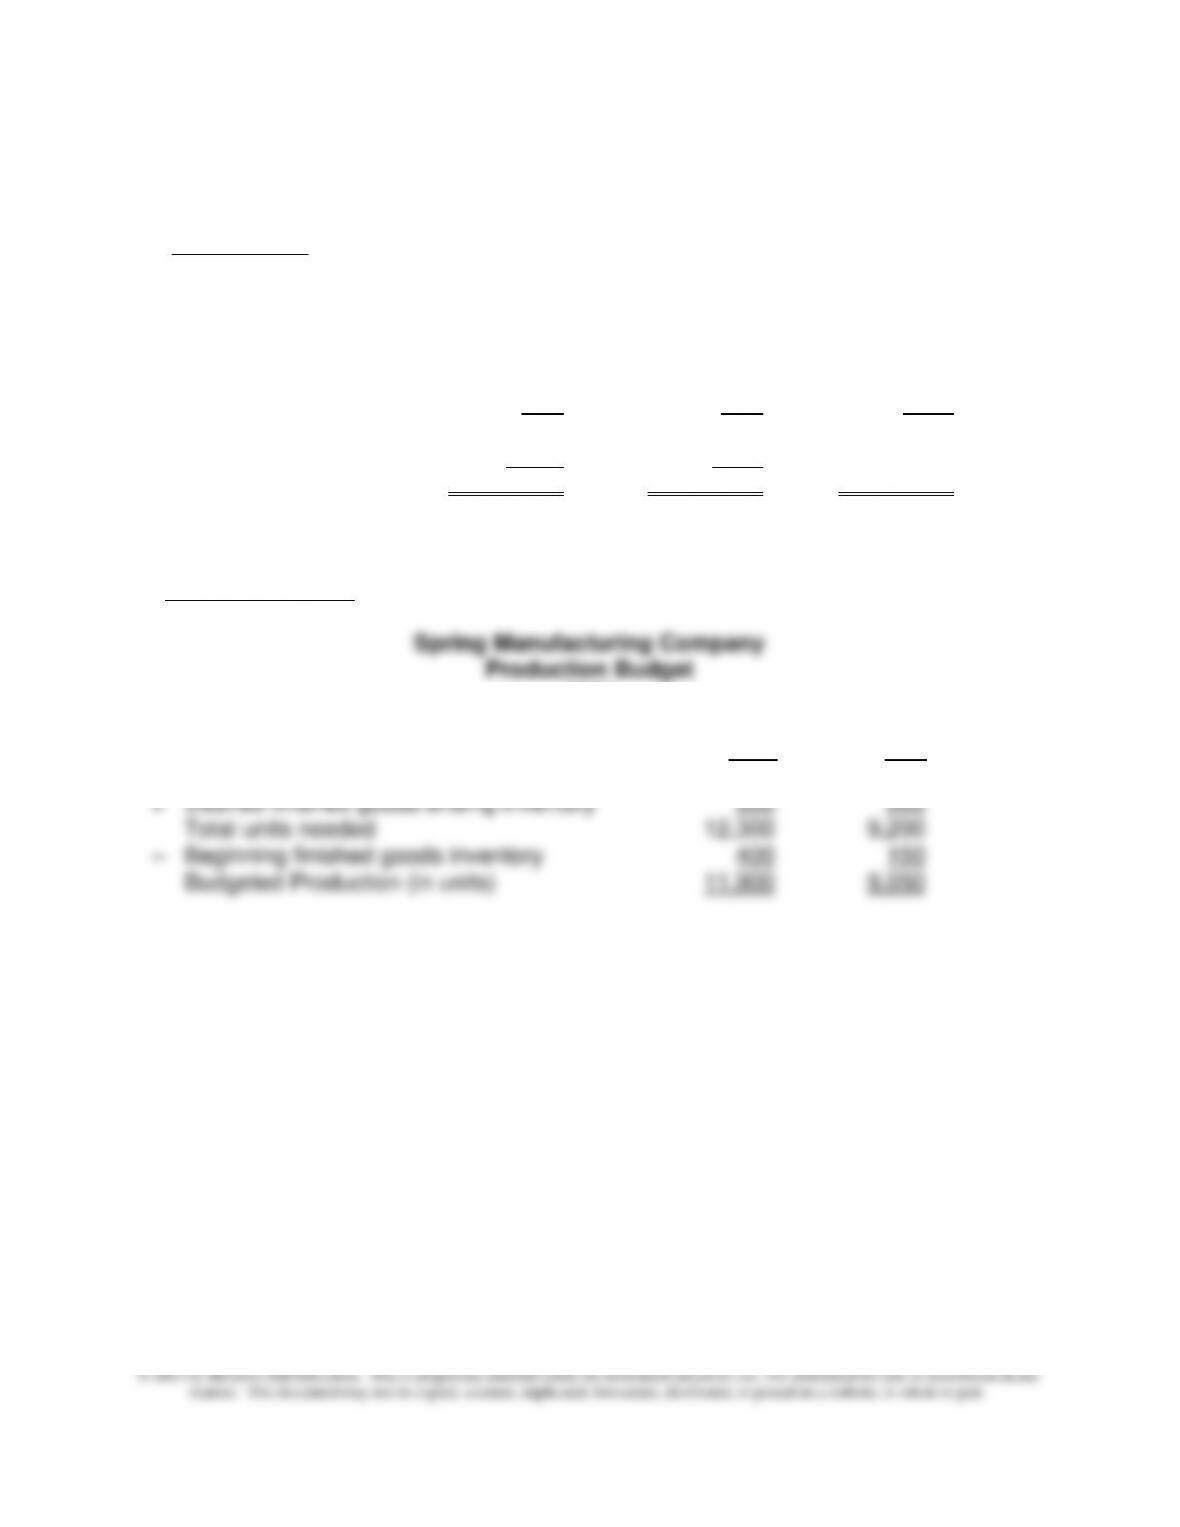
2. Production Budget
2013
C12 D57
Budgeted Sales (in units) 12,000 9,000
10–43
10-47 (Continued-1)
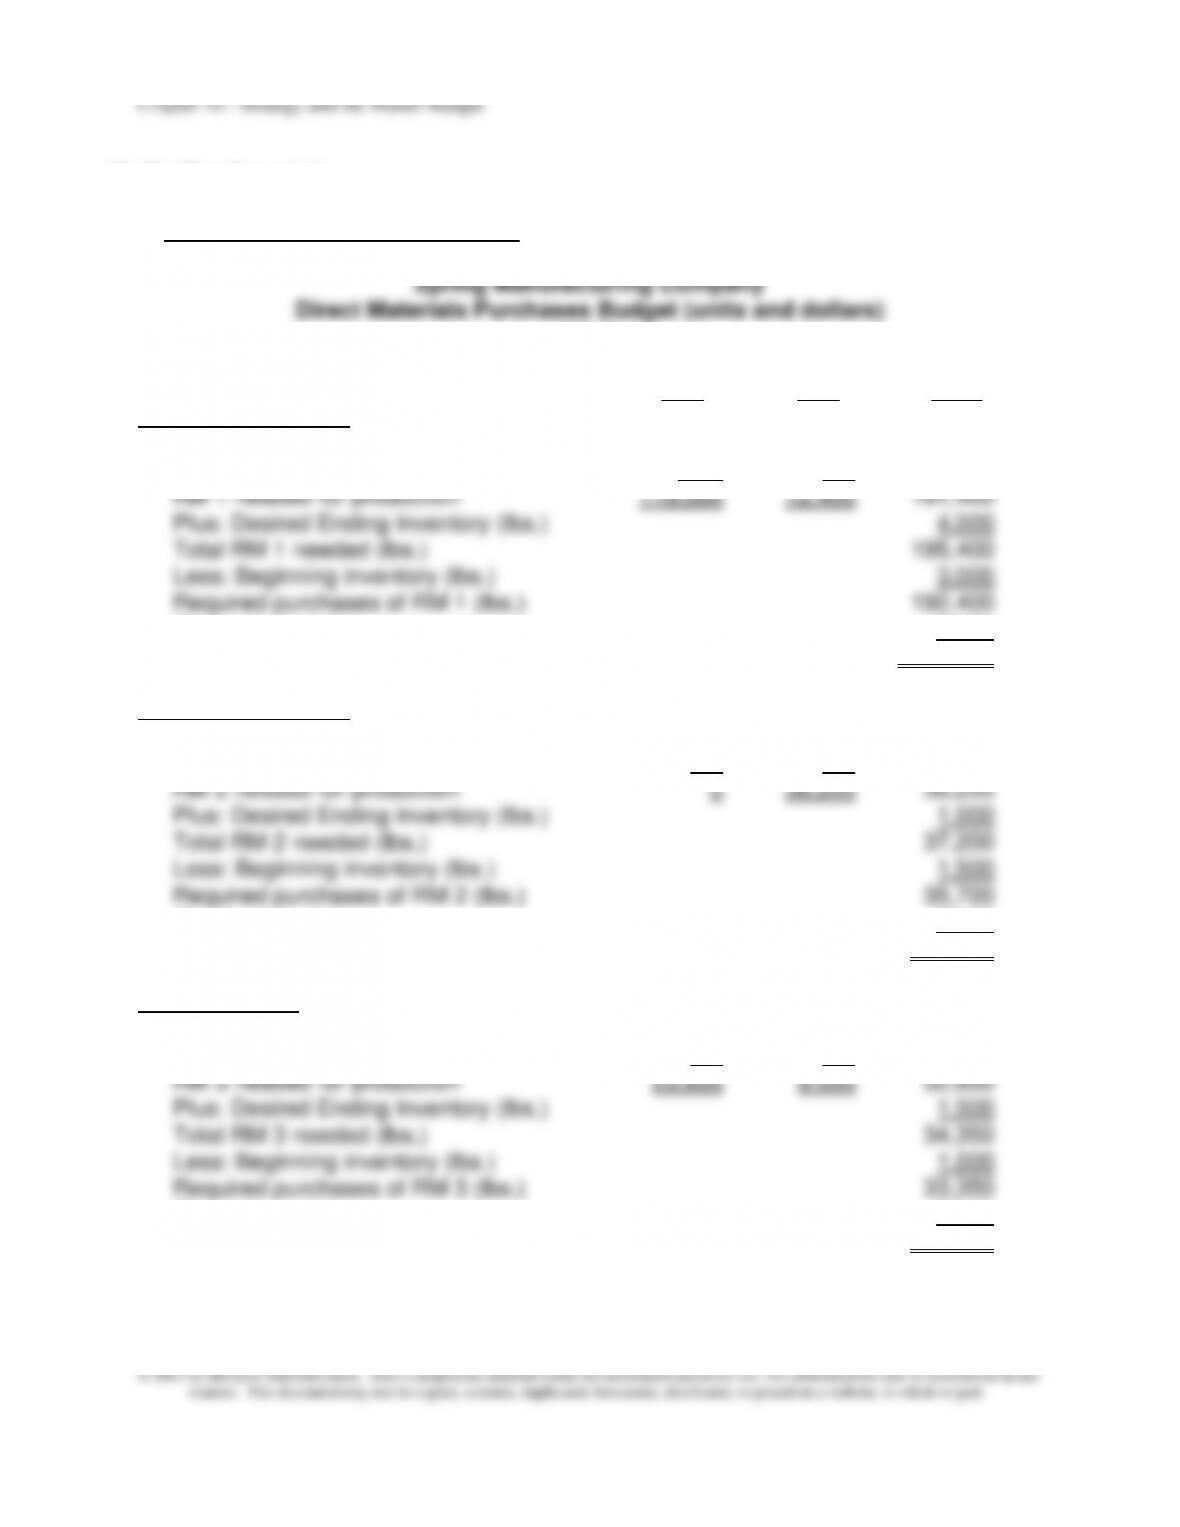
3. Direct Materials Purchases Budget
2013
C12 D57 Total
Raw Material (RM) 1:
Budgeted Production 11,900 9,050
Pounds per Unit × 10 × 8
Cost per pound $2.00
Budgeted purchases, RM 1 $384,800
Raw Material (RM) 2:
Budgeted Production 11,900 9,050
Pounds per Unit × 0 × 4
Cost per pound $2.50
Budgeted purchases, RM 2 $89,250
Raw Material 3:
Budgeted Production 11,900 9,050
Pounds per Unit × 2 × 1
Cost per pound $0.50
Budgeted purchases, RM 3 $16,675
10–44
10–47 (Continued-3)
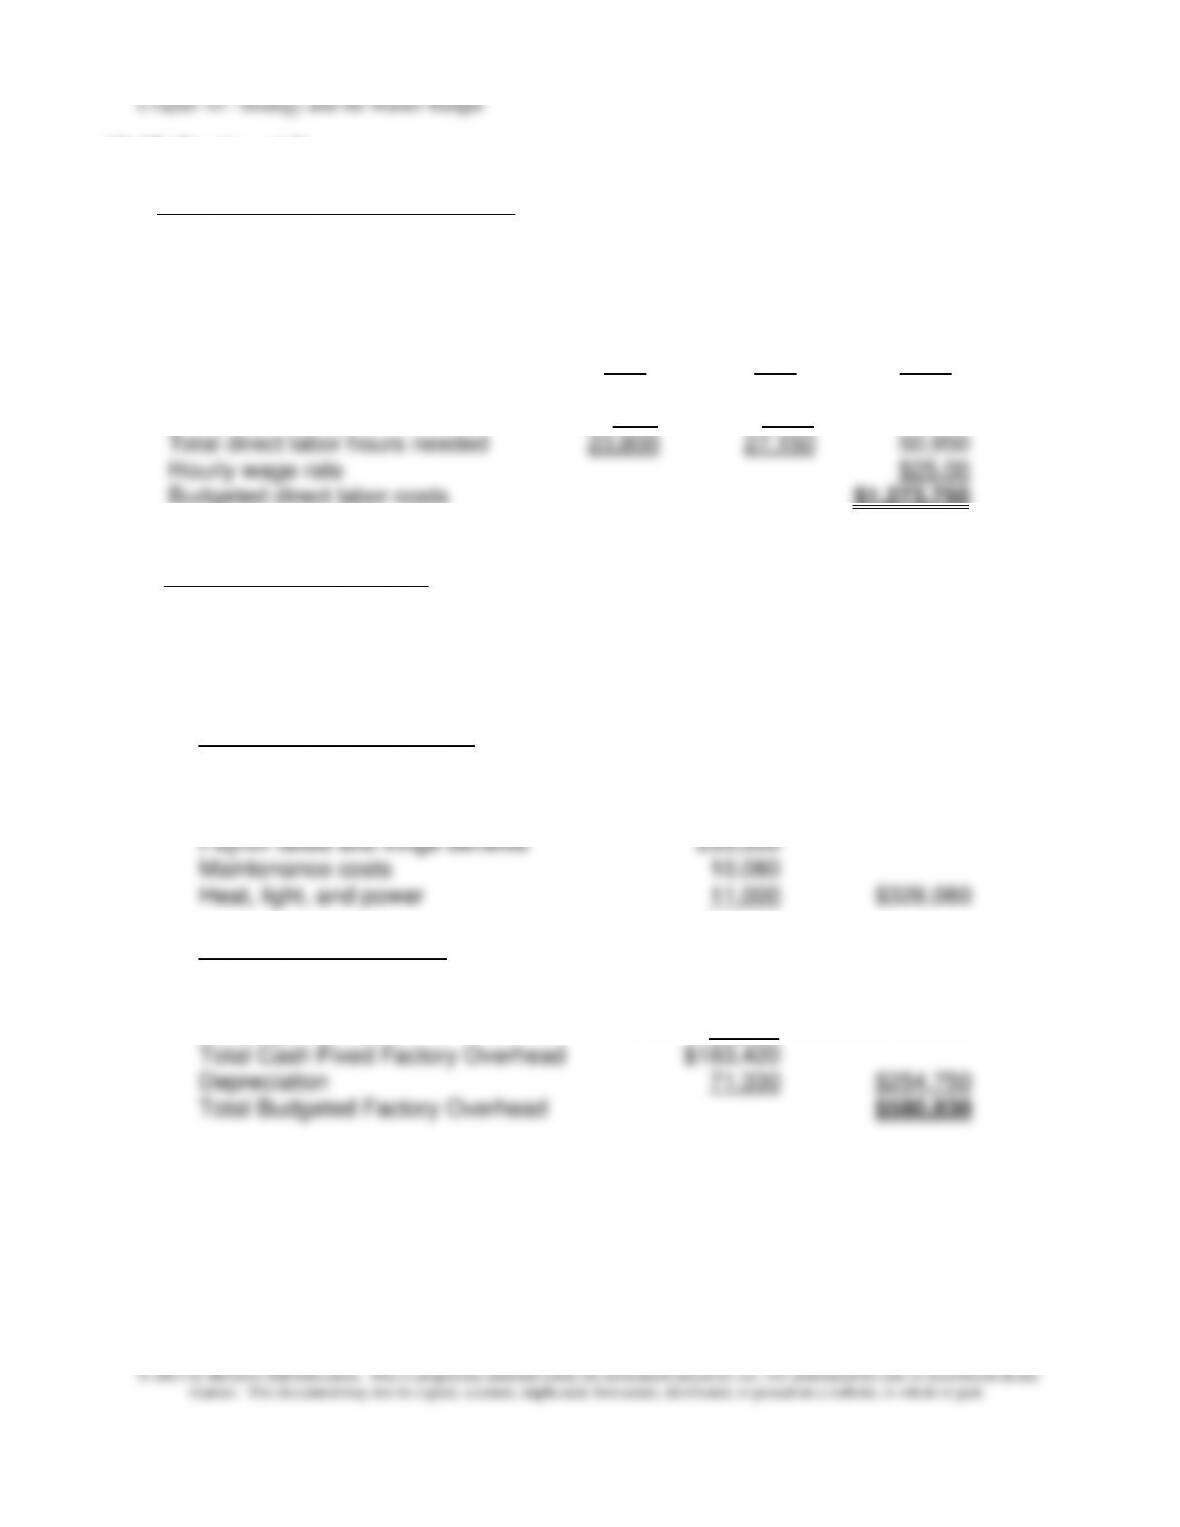
4.Direct Manufacturing Labor Budget
Spring Manufacturing Company
Direct Labor Budget
2013
C12 D57 Total
Budgeted production 11,900 9,050
Direct labor hours per unit × 2 × 3
Budgeted direct labor costs $1,273,750
5. Factory Overhead Budget
Spring Manufacturing Company
Factory Overhead Budget
2013
Variable Factory Overhead:
Indirect materials $10,000
Miscellaneous supplies and tools 5,000
Indirect labor 40,000
Fixed Factory Overhead:
Supervision $120,000
Maintenance costs 20,000
Heat, light, and power 43,420
10–45
10-47 (Continued-4)
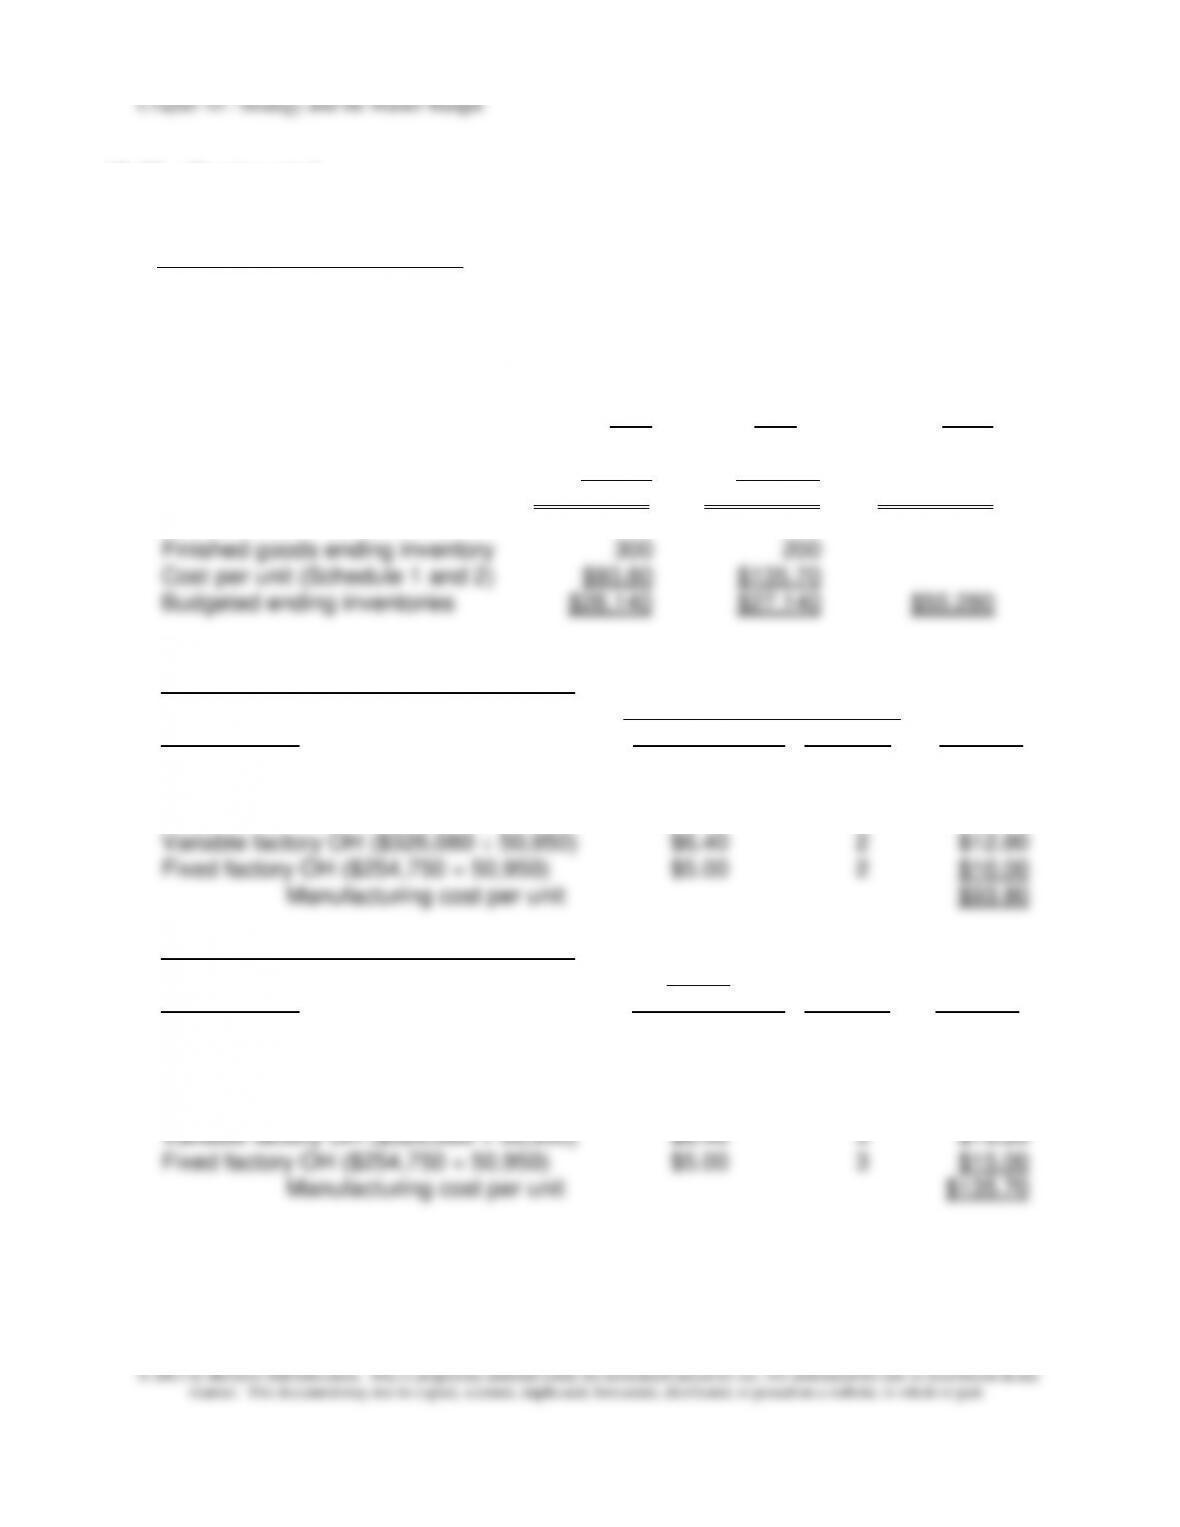
6.Budgeted Cost of Goods Sold
Spring Manufacturing Company
Ending Finished Goods Inventory and Budgeted CGS
2013
C12 D57 Total
Sales volume 12,000 9,000 21,000
Cost per unit (Schedule 1 and 2) $93.80 $135.70
Cost of goods sold $1,125,600 $1,221,300 $2,346,900
Schedule 1: Cost per Unit—Product C12:
Inputs_____ Cost
Cost Element Unit Input Cost Quantity Per Unit
RM-1 $2.00 10 $20.00
RM-3 $0.50 2 $1.00
Direct labor $25.00 2 $50.00
Schedule 2: Cost per Unit—Product D57:
Inputs Cost
Cost Element Unit Input Cost Quantity Per Unit
RM-1 $2.00 8 $16.00
RM-2 $2.50 4 $10.00
RM-3 $0.50 1 $0.50
Direct labor $25.00 3 $75.00