Chapter 10 – Strategy and the Master Budget
10–31 Purchase Discounts (25 minutes)
The financial cost of not taking advantage of the early-payment discount for
purchases made on credit can be approximated by the following formula (we use
the term “approximate” here to denote the fact that the estimate below does not
assume compounding of interest and as such provides a conservative estimate):
1. In the case of 2/10, n/30, the approximate economic cost of not taking
advantage of the early-payment discount is:
= [0.02 ÷ (1 − 0.02)] × [365 ÷ 20] = 0.020408 × 18.25 = 37.25%
Basically, if you choose not to take the early-payment discount, you are giving
up a 2% discount (on the net amount) in return for an extra 20 days in which
of the net bill (the bill without financing cost).
2. In the case of 1/10, n/30, the opportunity cost of not taking advantage of the
early-payment cash discount is:
3. Given the significant opportunity cost of not taking advantage of early-
payment cash discounts, good accounting practice would be to record
Chapter 10 – Strategy and the Master Budget
10–17
10-32 Accounts Receivable Collections and Sensitivity Analysis (50 minutes)
Original Assumptions/Data:
Actual credit sales for March $130,000
Actual credit sales for April $160,000
Estimated credit sales for May $210,000
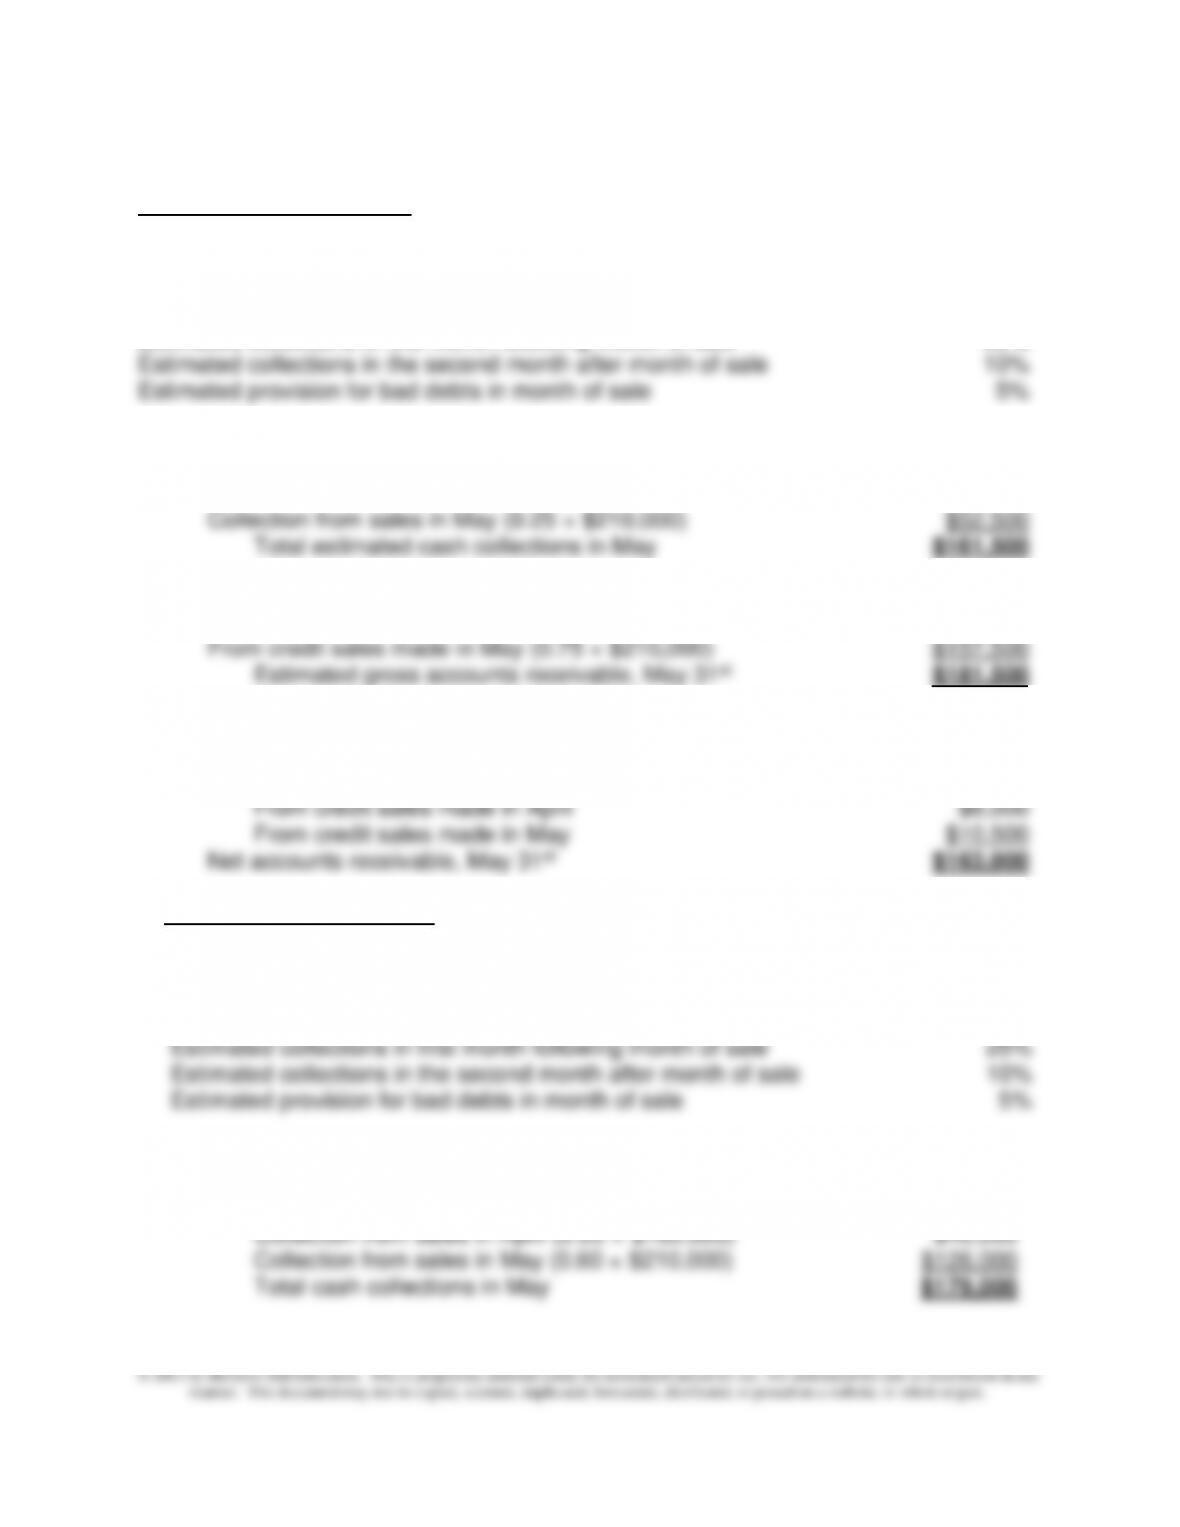
Estimated collections in month of sale 25%
Estimated collections in first month following month of sale 60%
1. Estimated cash receipts from collections in May:
Collection from sales in March (0.10 × $130,000) $13,000
Collection from sales in April (0.60 × $160,000) $96,000
2. Gross accounts receivable, May 31st:
From credit sales made in April (0.15 × $160,000) $24,000
3. Net accounts receivable, May 31st:
Gross accounts receivable, May 31st $181,500
Less: Allowance for uncollectible accounts:
4. Revised data/assumptions:
Actual credit sales for March $130,000
Actual credit sales for April $160,000
Estimated credit sales for May $210,000
Estimated collections in month of sale 60%
a. Estimated cash receipts from collections in May:
Collection from sales in March (0.10 × $130,000) $13,000
Chapter 10 – Strategy and the Master Budget
10–18
10–32 (Continued)
b. Gross accounts receivable, May 31st:
From credit sales made in April (0.15 × $160,000) $24,000
Note to Instructor: An Excel spreadsheet solution file is embedded in this document.
You can open the spreadsheet “object” that follows by doing the following:
1. Right click anywhere in the worksheet area below.
2. Select “worksheet object” and then select “Open.”
3. To return to the Word document, select “File” and then “Close and return
to…” while you are in the spreadsheet mode. The screen should then
return you to the Word document.
5. The principal benefit is the accelerated receipt of cash, which the company can
potentially employ to pay down debt, reduce borrowing, invest, etc. Principal costs
would relate to whatever programs are needed to secure the accelerated collection
Actual credit sales for March
Estimated credit sales for May
Exercise 10-32: Accounts Receivable Collections and Sensitivity Ana
Background
Papst Company is preparing its cash budget for the month of May. The follow
concerning its accounts receivable:
Chapter 10 – Strategy and the Master Budget
10–19
10–33 “What–If” Analysis (20-25 Minutes)
1. The term “what if” analysis is one example of the more general term “sensitivity
analysis” and is used to explore the effects (e.g., on a decision or a budget for an
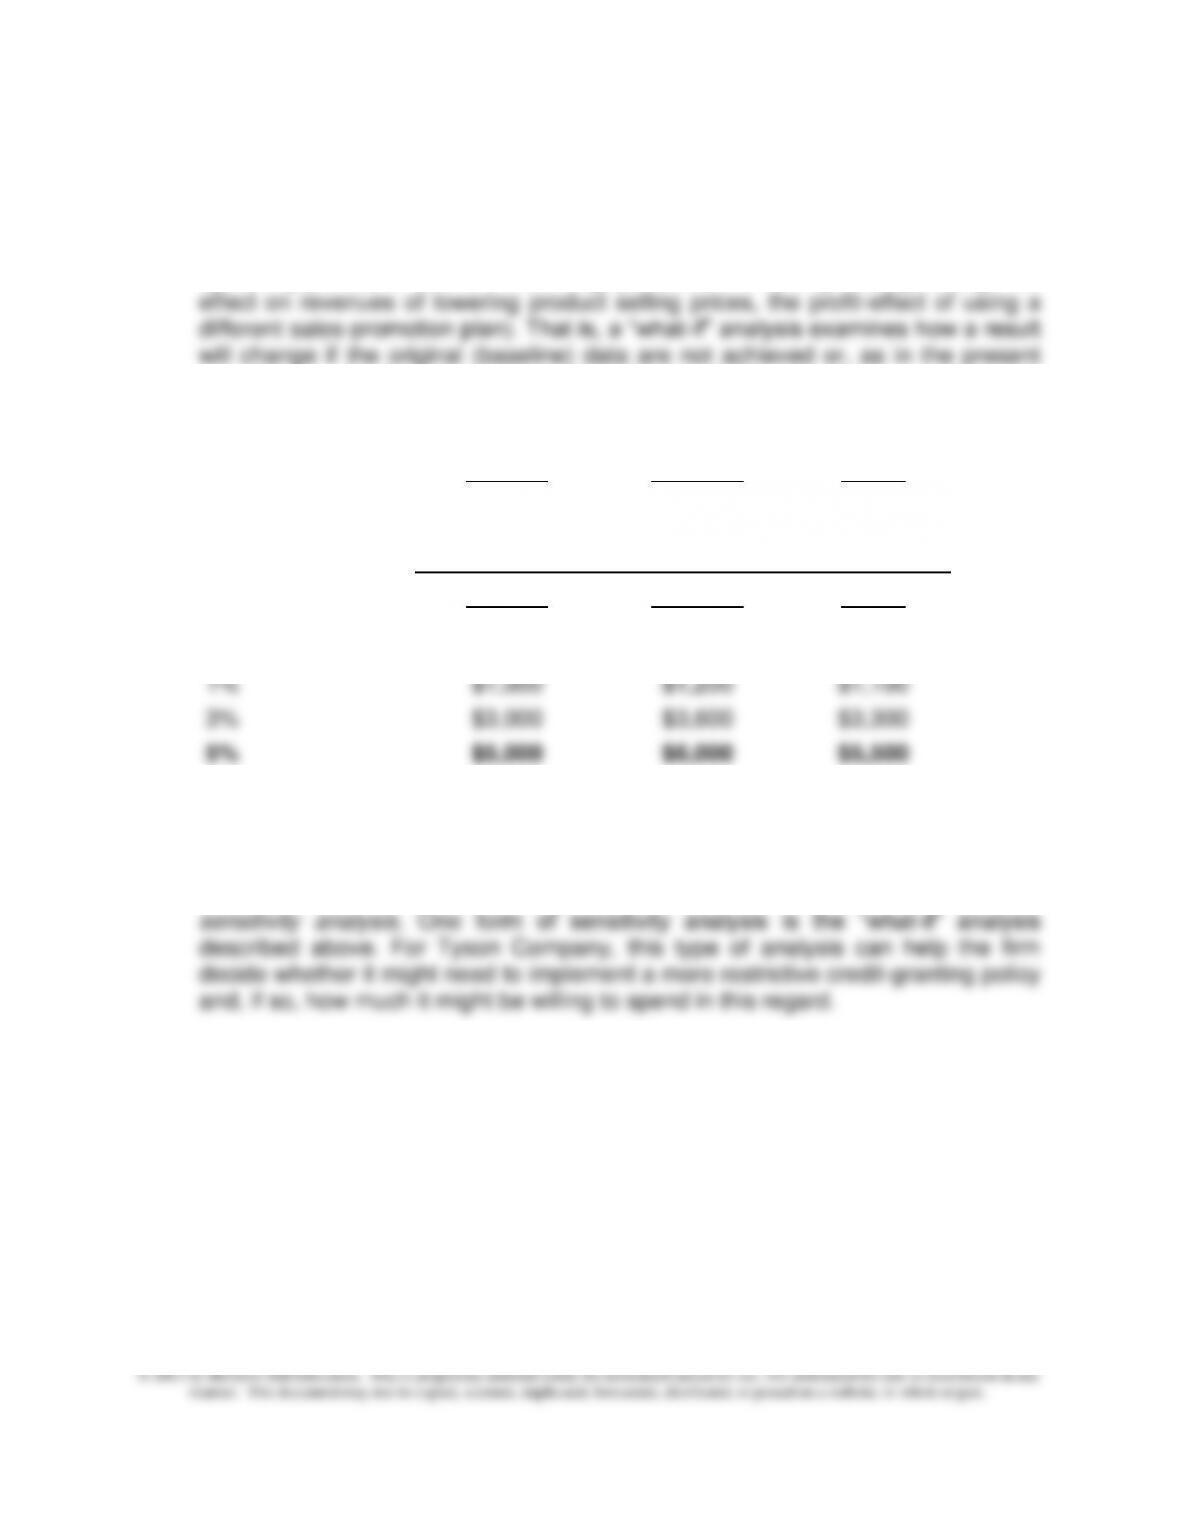
upcoming period) of different marketing, production, or selling strategies (e.g., the
case, if an underlying assumption (viz., rate of bad debts expense) changes.
2. What-if Analysis
January
February
March
Credit Sales
$100,000
$120,000
$110,000
Estimated Bad Debts Expense
January
February
March
Assumed rate of B/D
expense:
1%
$1,000
$1,200
$1,100
3%
$3,000
$3,600
$3,300
5%
$5,000
$6,000
$5,500
8%
$8,000
$9,600
$8,800
3. Managers today work in a world of uncertainty. One way to cope with uncertainty
in the master budgeting process is to model the underlying relationships
associated with the various budgets that are prepared and then to perform
10–20
10-34 Profit Planning and Sensitivity Analysis (40-45 minutes)
1. Sales volume in units:
Let “X” = required sales volume. Thus, when total cost at each alternative cost
structure is the same, we have:
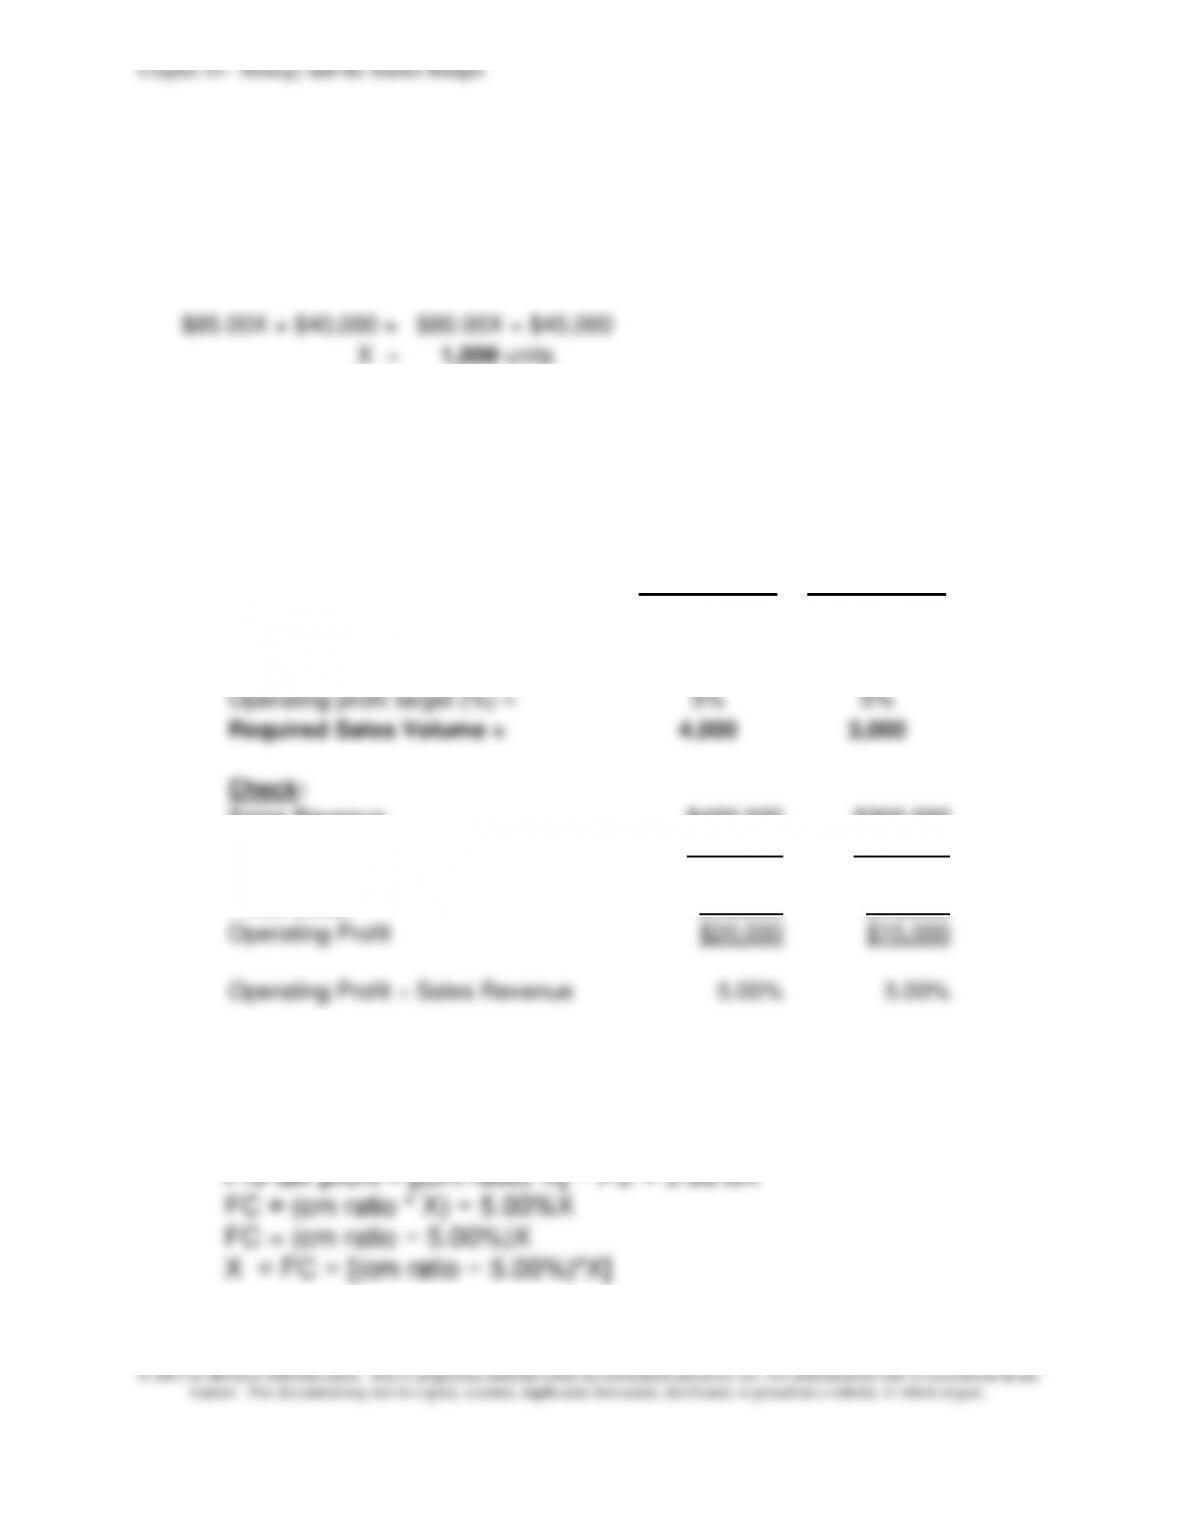
$85.00X + $40,000 = $80.00X + $45,000
X =
1,000 units
2. Sales level needed:
Pre-tax profit = (cm/unit * X) − FC = 5% (sp/unit * X)
0 = [(cm/unit * X) − 5% (sp/unit * X)] − FC
X = FC ÷ [(cm/unit) − 5% (sp/unit)]
Alternative 1
Alternative 2
Selling price/unit =
$100.00
$100.00
Variable cost/unit =
$85.00
$80.00
Contribution margin/unit =
$15.00
$20.00
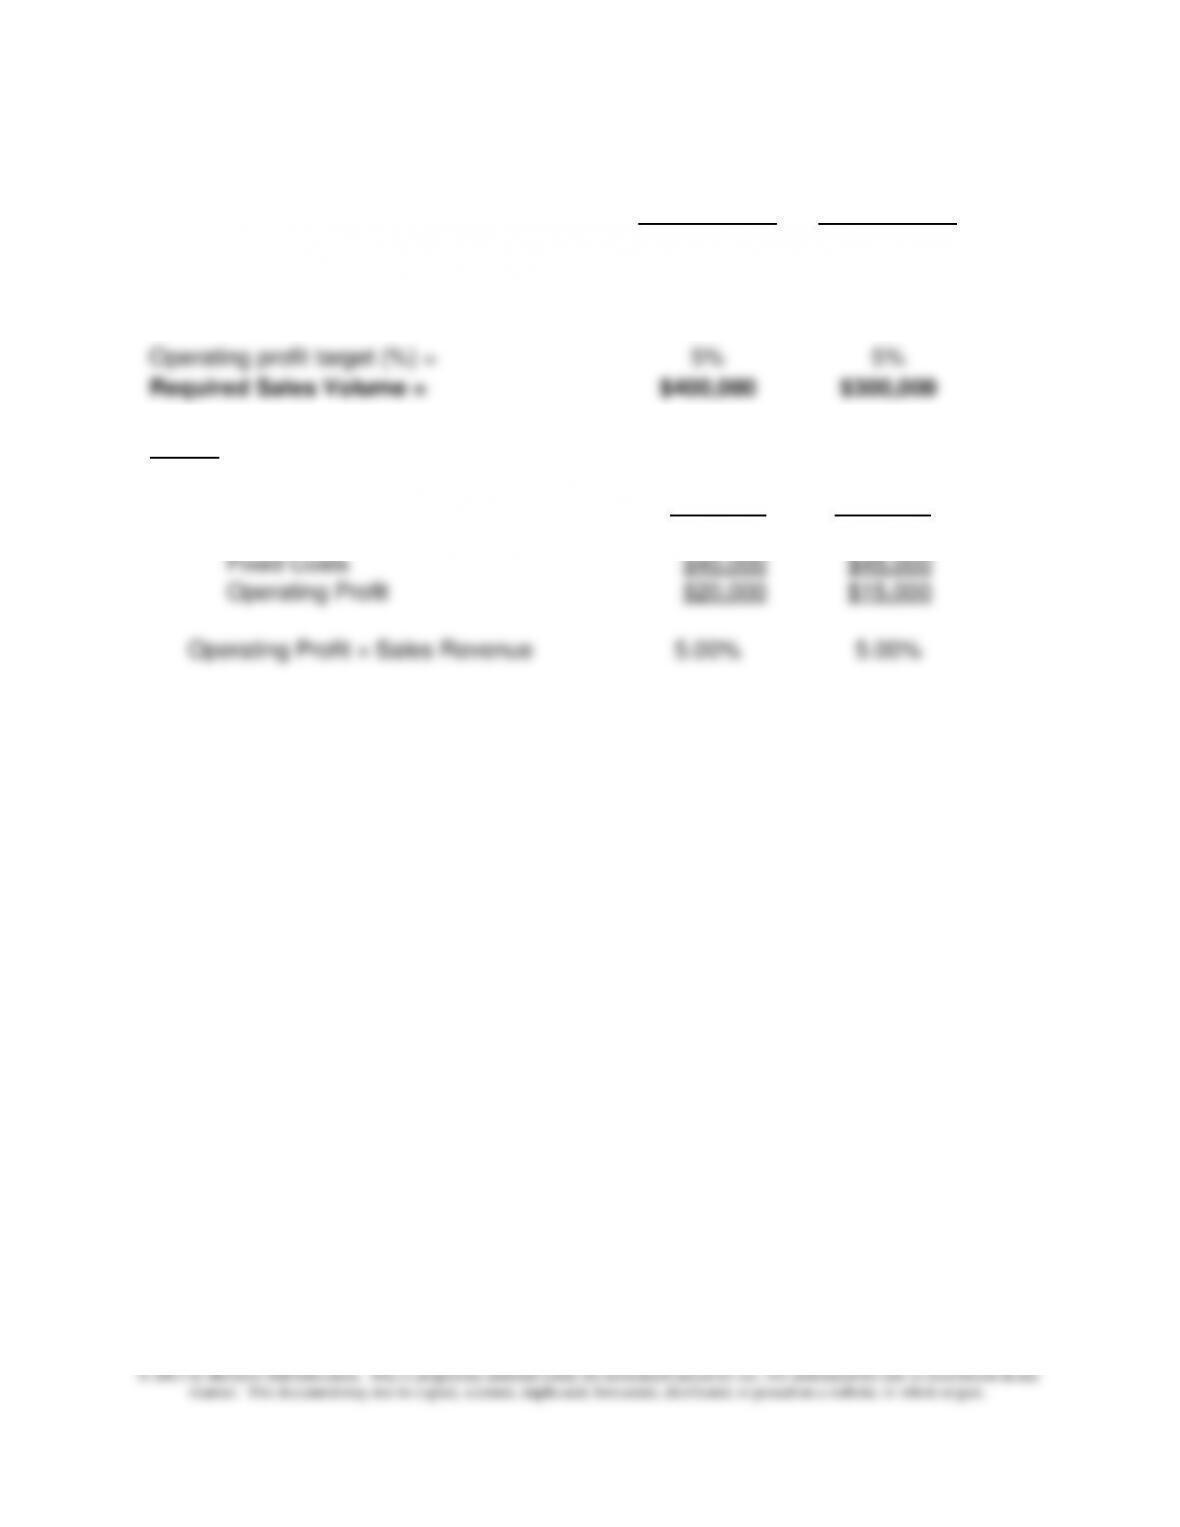
Operating profit target (%) =
5%
5%
Required Sales Volume =
4,000
3,000
Check:
Sales Revenue
$400,000
$300,000
Variable Costs
$340,000
$240,000
CM
$60,000
$60,000
Fixed Costs
$40,000
$45,000
Operating Profit
$20,000
$15,000
Operating Profit ÷ Sales Revenue
5.00%
5.00%
3. Sales volume in dollars needed under each alternative to achieve a profit
goal of 5% on sales.
FC = (cm ratio * X) − 5.00%X
X = FC ÷ [(cm ratio − 5.00%)*X]
Targeted pre-tax profit (% of sales) =
5.00%
5.00%
Let X = sales dollars, then:
Pre–tax profit = [(cm ratio)*X] − FC = 5.00%X
Chapter 10 – Strategy and the Master Budget
10–21
10–34 (Continued)
Alternative 1
Alternative 2
Selling price/unit =
$100.00
$100.00
Contribution margin/unit =
$15.00
$20.00
Contribution margin ratio =
15.00%
20.00%
Operating profit target (%) =
5%
5%
Required Sales Volume =
$400,000
$300,000
Check:
Sales Revenue
$400,000
$300,000
Variable Costs
$340,000
$240,000
CM
$60,000
$60,000
Fixed Costs
$40,000
$45,000
Operating Profit
$20,000
$15,000
Operating Profit ÷ Sales Revenue
5.00%
5.00%

Chapter 10 – Strategy and the Master Budget
10–22
10–35 Scenario Analysis (45-50 minutes)
1. “What-If Analysis,” within the context of budgeting, refers to the process of varying
one or more budget inputs for the purpose of examining the resulting effect on a
variable of interest (e.g., budgeted sales, operating income, or operating cash flows).
Scenario analysis can be viewed as the result of simultaneously changing two or
more inputs and examining the resulting effect on a variable of interest.
The basic version of Excel can perform three kinds of “what–if” analyses: scenarios,
data tables, and Goal Seek. Scenarios and data tables take sets of input values and
determine possible results. A data table works only with one or two variables, but it
can accept many different values for those variables. A scenario can have multiple
variables, but it can accommodate only up to 32 values. Goal Seek works differently
from scenarios and data tables in that it takes a result and determines possible input
values that produce that result. In addition to these three methods, an Excel add-in,
Solver, can be used to perform “what–if” analyses. The Solver add-in is similar to
Goal Seek, but it can accommodate more variables.
See the following tutorials for additional information about performing “what–if”
analyses using Excel 2010:
1. Introduction to What-If Analysis:
http://office.microsoft.com/en-us/excel-help/introduction–to-what-if–analysis-HA010342628.aspx
2. Using Excel to Perform Scenario Analysis:
http://office.microsoft.com/en-us/excel-help/switch-between-various-sets-of-values-by-using-scenarios-
HP010072669.aspx
3. Using Excel to Create Data Tables:
http://office.microsoft.com/en-us/excel-help/calculate-multiple-results-by-using-a-data-table-
HP010342214.aspx
4. Using the Goal Seek Routine in Excel:
http://office.microsoft.com/en-us/excel-help/use-goal-seek-to-find-the-result-you-want-by-adjusting-an–
input-value-HP010342990.aspx
5. Using Solver to Perform What-If Analysis:
http://office.microsoft.com/en-us/excel-help/define-and-solve-a-problem-by-using-solver-
HP010342416.aspx
http://office.microsoft.com/en-us/excel-help/video-use-the-solver-add-in-VA101840549.aspx
Chapter 10 – Strategy and the Master Budget
10–23
10–35 (Continued)
2. Budgeted Operating Income—Current Year:
Sales Revenue (2,500 units × $1,500 per unit) =
$3,750,000
Less: Variable Costs (2,500 units × $1,000 per unit)
$2,500,000
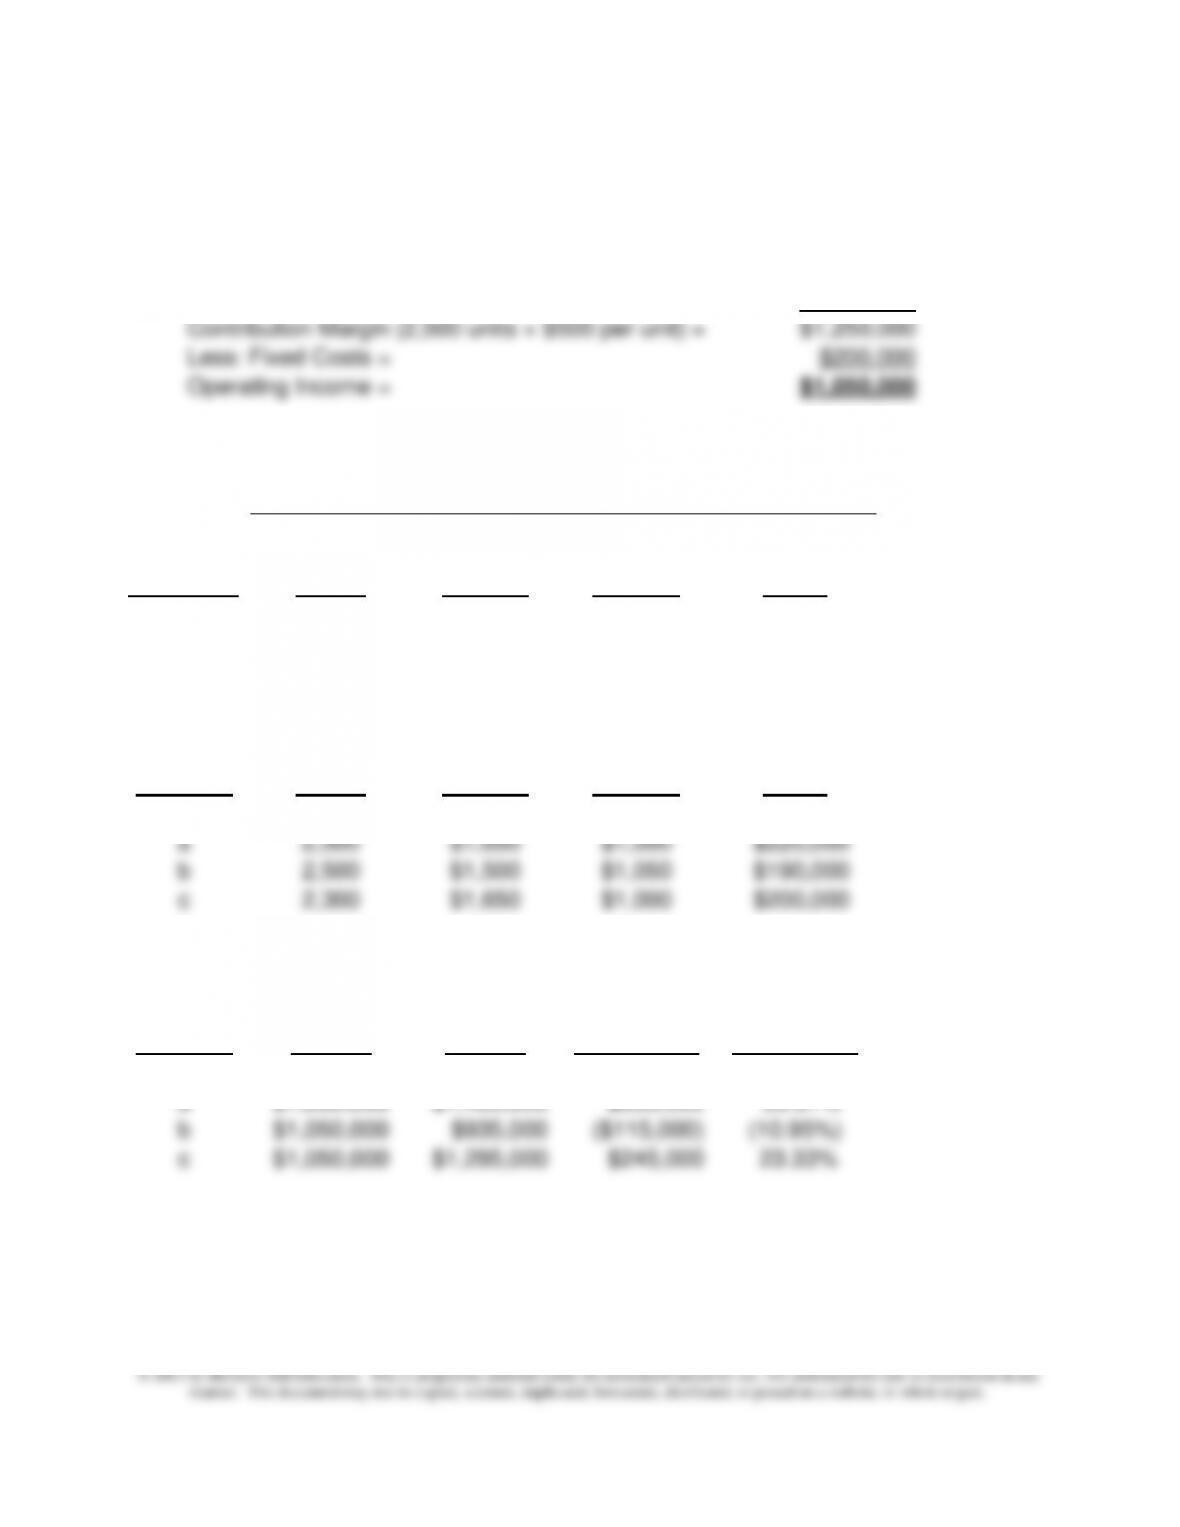
Contribution Margin (2,500 units × $500 per unit) =
$1,250,000
Less: Fixed Costs =
$200,000
Operating Income =
$1,050,000
3. Scenario Analysis:
Percentage Change from Baseline
Sales
Volume
Selling
Price
Variable
Cost
Total Fixed
Scenarios
(units)
per Unit
per Unit
Costs
a
0.00%
10.00%
0.00%
10.00%
b
0.00%
0.00%
5.00%
(5.00%)
c
(8.00%)
10.00%
0.00%
0.00%
Sales
Volume
Selling
Price
Variable
Cost
Total Fixed
Scenario
(units)
per Unit
per Unit
Costs
Baseline
2,500
$1,500
$1,000
$200,000
a
2,500
$1,650
$1,000
$220,000
b
2,500
$1,500
$1,050
$190,000
c
2,300
$1,650
$1,000
$200,000
$ Difference
% Change
Baseline
Operating
Budgeted
Operating
From
Baseline
from
Baseline
Scenario
Income
Income
Op. Income
Op. Income
Baseline
$1,050,000
$1,050,000
$0
0.00%
a
$1,050,000
$1,405,000
$355,000
33.81%
b
$1,050,000
$935,000
($115,000)
(10.95%)
c
$1,050,000
$1,295,000
$245,000
23.33%
Chapter 10 – Strategy and the Master Budget
10–24
10-36 Cash Budgeting: Not-for-Profit Context (30-45 minutes)
1. “Endowment fund:” a gift (contribution) whose principal must be maintained but whose
income may be expended. (You might use the example of an “endowed professorship”
as an example.)
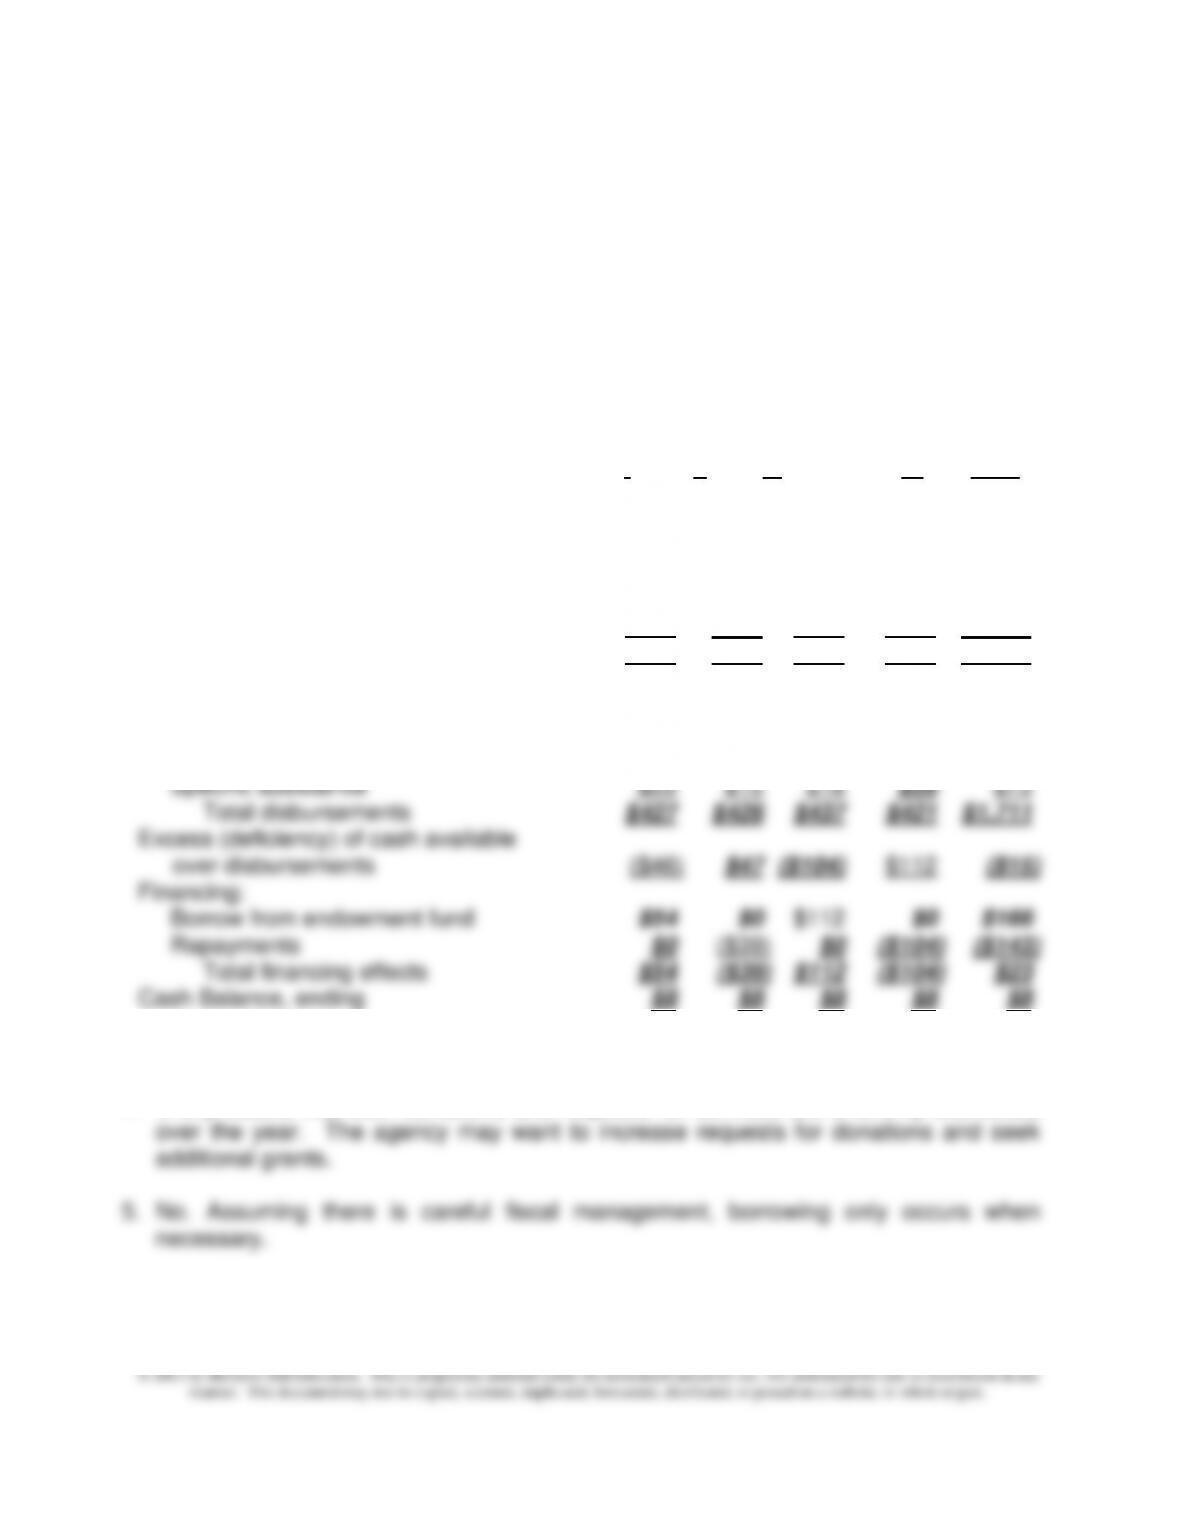
2.
Cash Budget for Tri-County Social Service Agency
2013
(in thousands)
Quarters
I II III IV Year
Cash Balance, beginning $11 $8 $8 $8 $11
Receipts:
Grants $80 $70 $75 $75 $300
Contracts (evenly during year) $20 $20 $20 $20 $80
Mental Health Income (+5 in Qtrs II, III) $20 $25 $30 $30 $105
Charitable donations $250 $350 $200 $400 $1,200
Total Cash Available $381 $473 $333 $533 $1,696
Less: Disbursements:
Salaries and Benefits $335 $342 $342 $346 $1,365
Office expenses $70 $65 $71 $50 $256
Equipment purchases & maintenance $2 $4 $6 $5 $17
3. $23,000.
4. It is probable that both donations and requests for services are unevenly distributed
Chapter 10 – Strategy and the Master Budget
10–25
10-37 Budgeting: Not–for–Profit Sector (20–30 minutes)
1. Stewardship is defined by Merriam-Webster Online Dictionary as “the conducting,
supervising, or managing of something; especially: the careful and responsible
management of something entrusted to one’s care.”
The Socially Responsible Investment Guidelines cited states: “Although it is a
moral and legal fiduciary responsibility of the trustees to ensure an adequate return
on investment for the support of the work of the church, their stewardship
embraces broader moral concerns.” Also, the principles of stewardship lists two
fundamental and interdependent principles: “The Conference should exercise
responsible financial stewardship over its economic resources.” and “The
Conference should exercise ethical and social stewardship in its investment
policy.”
The latter states: “Socially responsible investment involves investment strategies
based on Catholic moral principles. These strategies are based on the moral
traditional Catholic moral teaching, and employing traditional principles on
cooperation and toleration, as well as the duty to avoid scandal, the Conference
can reflect moral and social teaching in investments.”
2. “These two major principles work together to encourage the Conference to identify
investment opportunities that meet both our financial needs and our social criteria.
3. No. (Reasons should vary.)

Chapter 10 – Strategy and the Master Budget
10–26
10–38 Service Firm Budget (60-75 minutes)
1.
Total hours for the budgeted activities:
Hourly
Budgeted Charge
Revenue Rate Required
(Given) (Given) Hours
Business returns $1,000,000 $250 4,000
Complex individual returns $1,200,000 $100 12,000
Simple individual returns $1,640,000 $50 32,800
Professional staff requirements for the budgeted revenue:
Senior
Total Hours Partner Manager
Consultant _Consultant_
Required Each Total Each Total Each
Total Each Total
Business returns 4,000 0.30 1,200 0.20 800 0.50 2,000 0.00
Complex individual returns 12,000 0.05 600 0.15 1,800 0.40 4,800 0.40
Simple individual returns 32,800 0.00 0 0.00 0 0.20 6,560 0.80
Total Hours 48,800 1,800 2,600 13,360
Hours per week 50 45 40
# of weeks needed 36 58 334
Note: Because Consultants can be hired on a part-time basis, we round the calculation
DOWN for this class of labor. The other three labor classes are given (i.e., do not have
to be planned for based on data in the problem).
Since, according to the present staffing plan and anticipated workload needs,
there is an excess of senior consultant hours, the budgeted cost for overtime
hours worked by senior consultants would be $0.
10–27
10–38 (Continued)
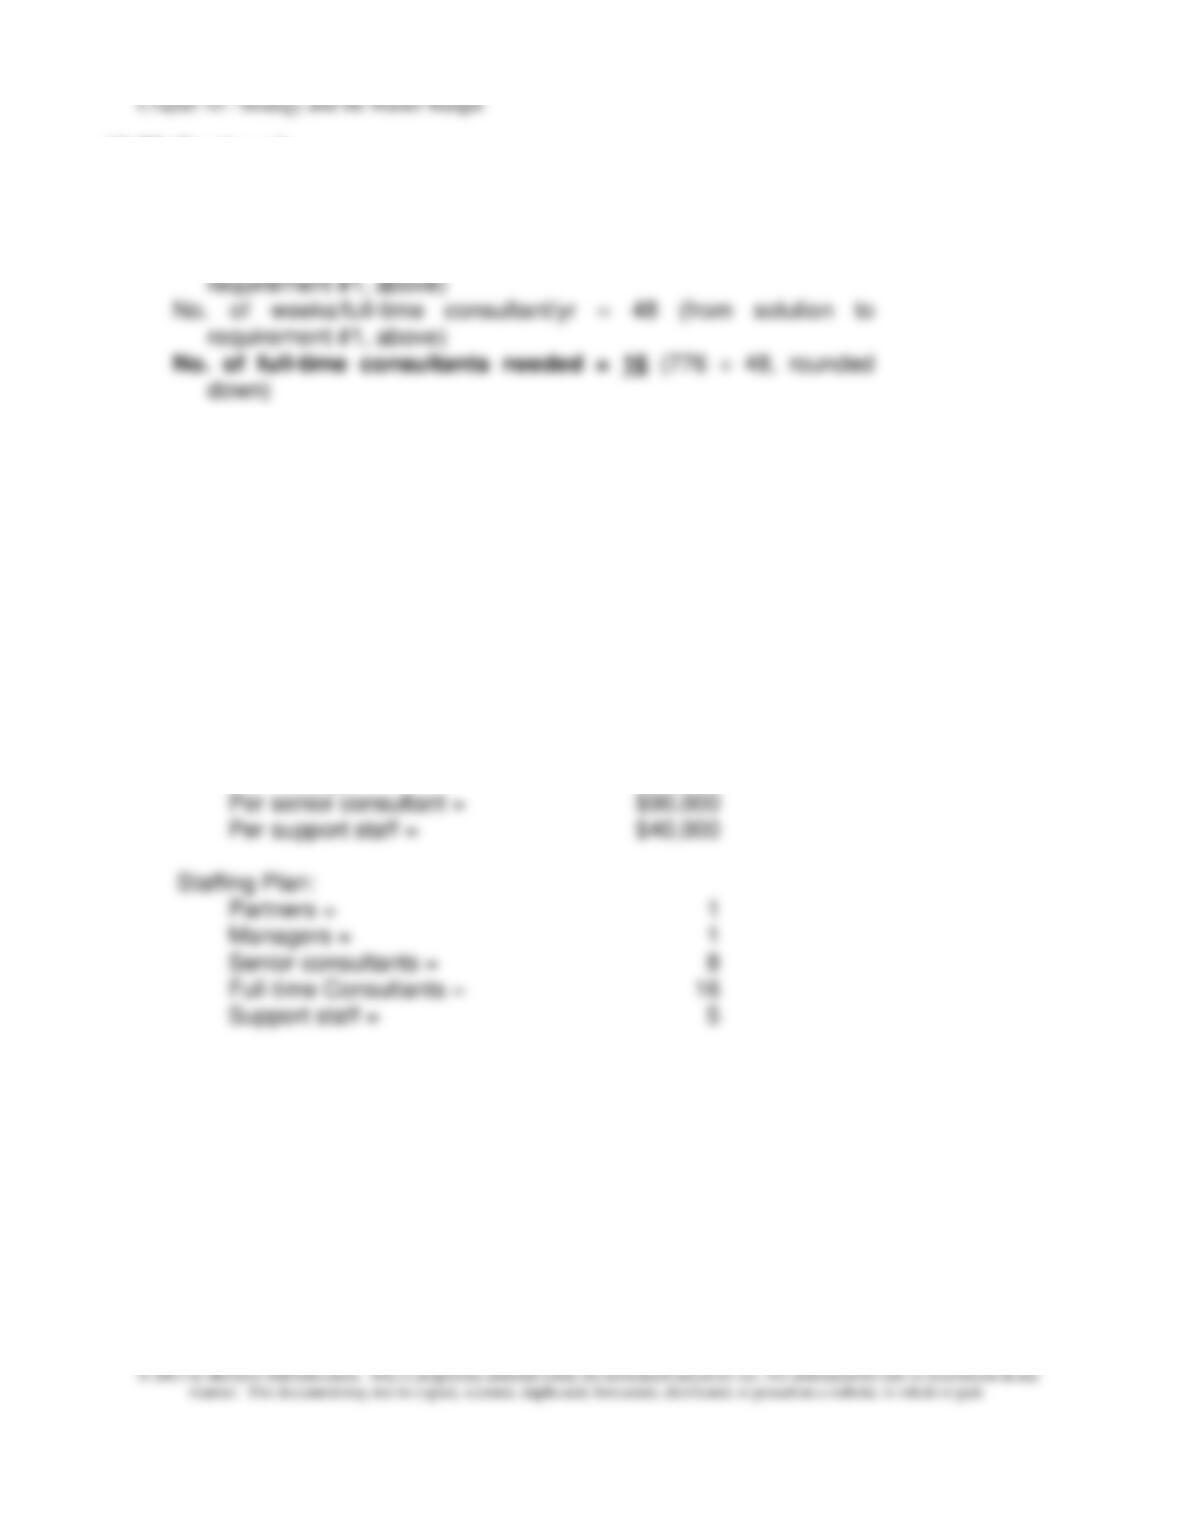
2. Number of full-time consultants needed for the year:
No. of consultant-weeks needed for the yr = 776 (from solution to
requirement #1, above)
No. of weeks/full-time consultant/yr = 48 (from solution to
requirement #1, above)
No. of full-time consultants needed = 16 (776 ÷ 48, rounded
down)
3. The manager’s total compensation, assuming that the revenues from preparing tax
returns remains the same:
Consultant’s pay:
Earning per year =
$60,000
Hrs. worked/year =
1,920
Hourly pay rate =
$31.25
No. of PT hours, consultants =
320
Annual Salaries:
Per partner = $250,000
Per manager = $90,000
Chapter 10 – Strategy and the Master Budget
10–28
10–38 (Continued-2)
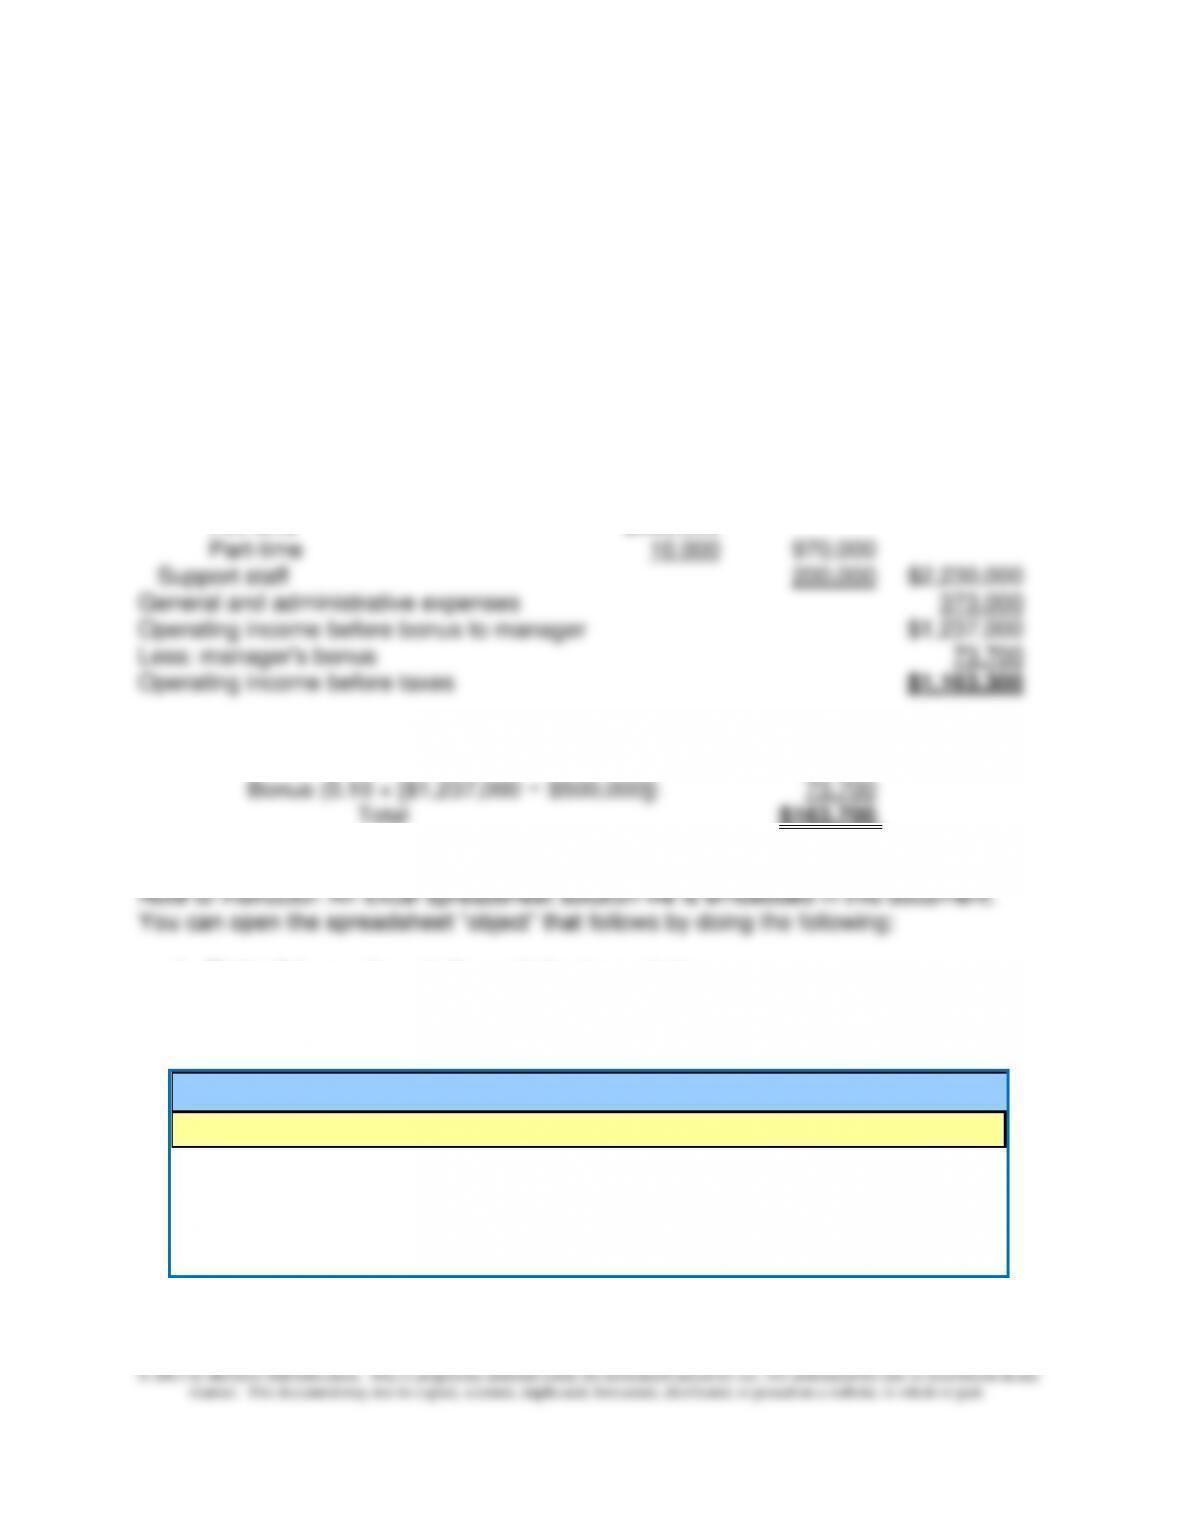
AccuTax, Inc.
Budgeted Operating Income
For the Year ended August 31, 2013
Revenue $3,840,000
Payroll expenses:
Partner $250,000
Manager 90,000
Senior consultants—base pay 720,000
Senior consultants—pay for overtime hours 0
Consultants:
Full-time $960,000
Total compensation for the manager:
Salary (given) $90,000
1. Right click anywhere in the worksheet area below.
2. Select “Worksheet Object,” then “Open.”
3. To return to the Word document, select “File” and then “Close and return to…”
while you are in the spreadsheet mode.
Refer to AccuTax, Inc. in the chapter. One of the partners is plann
remaining partner, plans to add a manager at an annual salary of $
45 hours per week for 45 weeks per year. She plans to change th
Exercise 10-38: Budgeting for a Service Firm
Background
Chapter 10 – Strategy and the Master Budget
10–29
10-39 Budgetary Slack and Zero-Based Budgeting (ZBB) (30 minutes)
1. Budgetary slack is a planned difference between budgeted revenue and expected
revenue, and/or budgeted expenditures and expected expenditures. Budgetary
slack describes the tendency of managers to under-estimate revenues and over-
estimate expenditures during the budgetary process in order to build in
2. a. From the point of view of the business unit manager, budgetary slack provides:
▪ performance that will “look better” in the eyes of their superiors
However, the use of budgetary slack limits the objective evaluation of a
business unit and, therefore, limits the objective evaluation of the performance
of the unit manager. It also becomes more difficult for the business unit
manager to evaluate the performance of subordinates and to use the budget as
a control mechanism over subordinate performance.
b. From the perspective of corporate management, the use of budgetary slack
increases the probability that budgets will be achieved. This increased
probability facilitates the overall corporate budgeting process. Corporate
operating activities.
3. a. Zero-based budgeting (ZBB) is a budgeting technique that evaluates all
proposed operating and administrative expenditures as though they were being
initiated for the first time. Each manager must evaluate the proposed
10–30
10-39 (Continued)
b. Atlantis Laboratories could benefit from ZBB as each of the business unit
managers would be required to identify and justify all proposed expenditures for
the benefits of ZBB outweigh the associated costs.