10–31
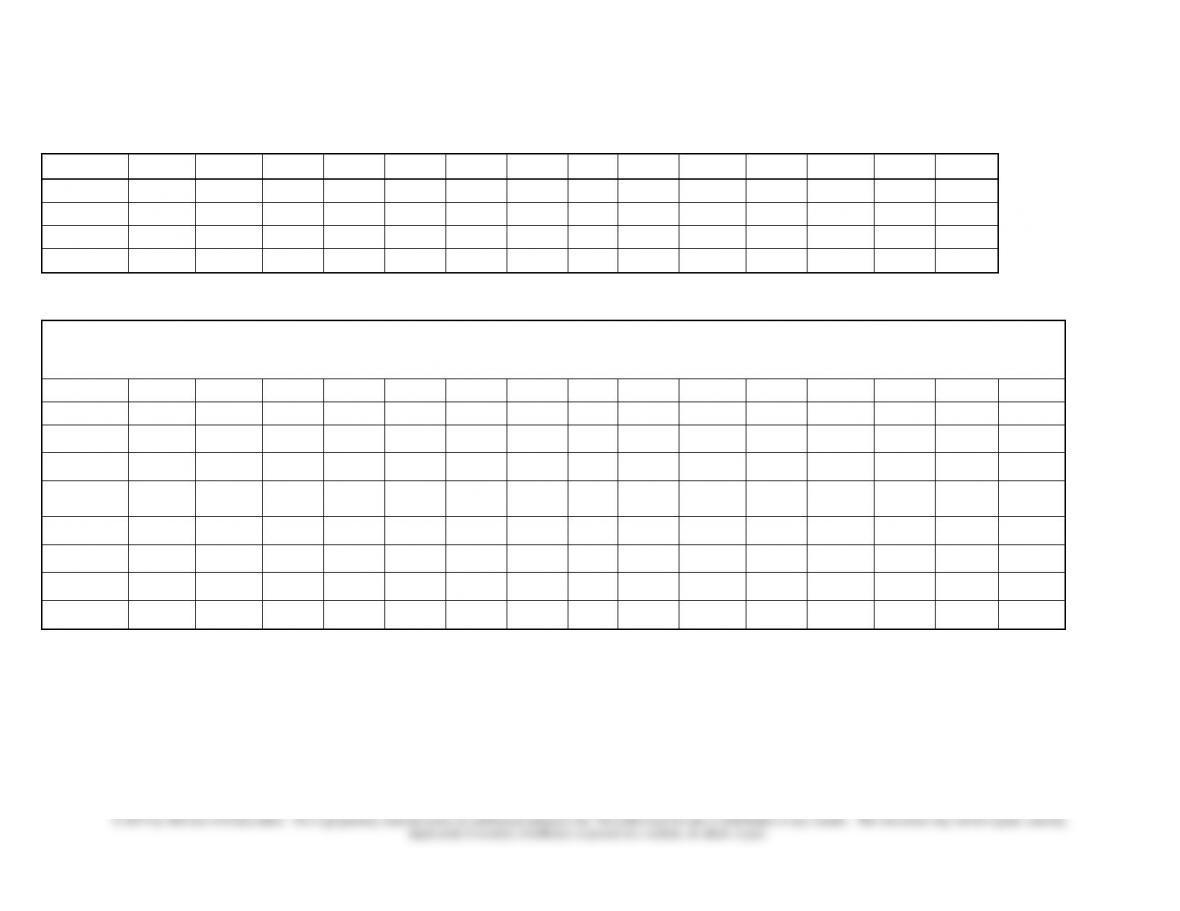
Exhibit 3
Use of Resource Drivers (time or usage) by Activities
A1
A2
A3
A4
A5
A6
A7
A8
A9
A10
A11
A12
A13
Total
Manager
1.00%
14.00%
70.00%
15.00%
100.00%
Advisors
15.00%
15.00%
10.00%
8.00%
5.00%
10.00%
5.00%
17.00%
15.00%
100.00%
Office Staff
10.00%
10.00%
10.00%
25.00%
15.00%
30.00%
100.00%
Reproduction
55.00%
25.00%
10.00%
10.00%
100.00%
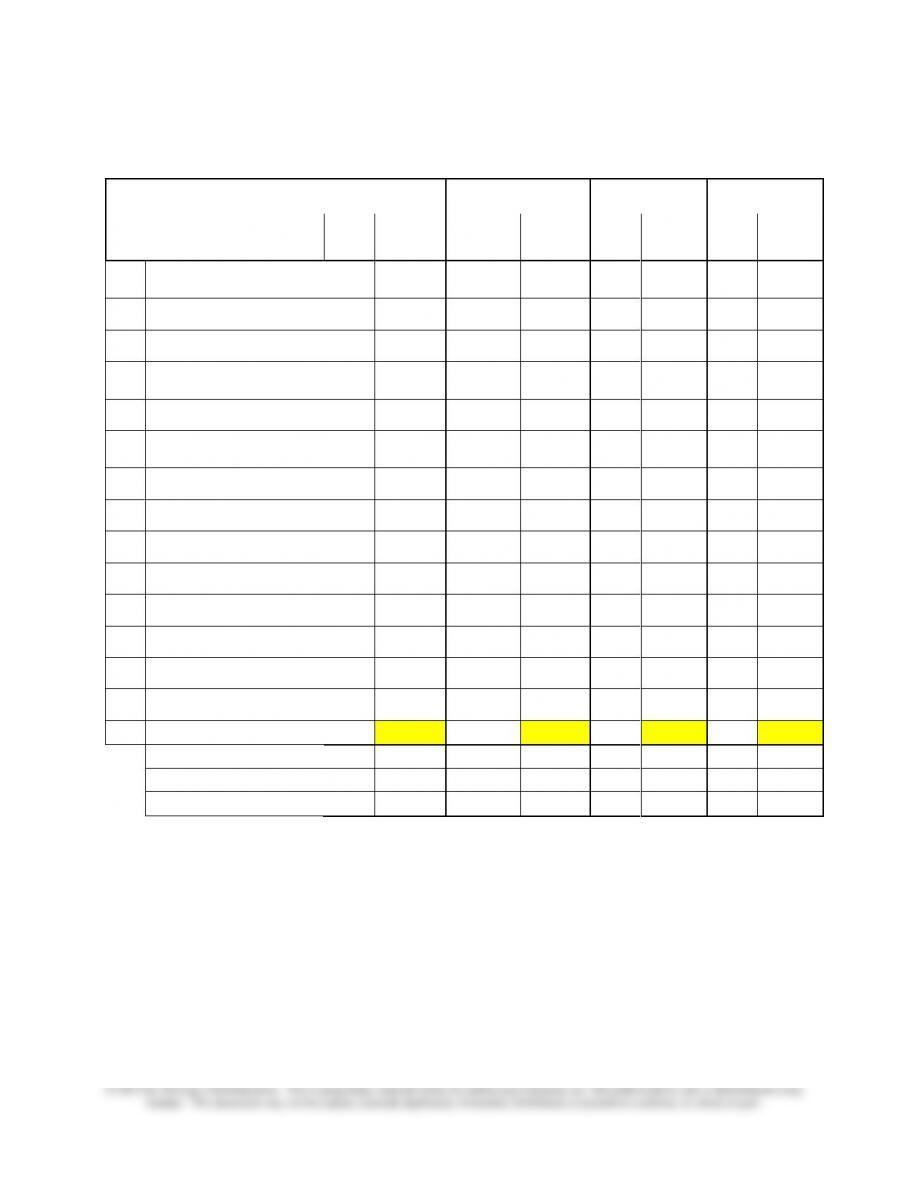
Activity
Costing
Cost Item
Item
Amount
A1
A2
A3
A4
A5
A6
A7
A8
A9
A10
A11
A12
A13
Total
Manager
$ 96,226
$ –
$ –
$ –
$ –
$ –
$ –
$ –
$ 962
$ –
$ 3,472
$ 67,358
$ –
$ 4,434
$ 96,226
Advisors
409,356
61,403
61,403
40,936
32,748
20,468
40,936
–
20,468
69,591
61,403
–
–
–
409,356
Office Staff
106,678
–
10,668
–
–
10,668
10,668
–
–
26,670
16,002
–
32,003
–
106,678
Equipment &
Software
63,840
63,840
63,840
Reproduction
135,000
74,250
–
–
–
33,750
–
–
–
13,500
–
13,500
–
–
135,000
Travel
40,000
40,000
40,000
Hospitality
23,400
23,400
23,400
Total
$874,500
$ 35,653
$ 2,071
$ 0,936
$32,748
$ 4,886
$ 1,603
$ –
$ 1,430
$ 09,760
$ 0,877
$120,858
$ 5,843
$ 7,834
$874,500
10–32
Exhibit 4
Benchmark
COBAA
External
AMC
EDUCATION
Activity Cost Comparisons
$/FTE
$/FTE
$/FTE
$/FTE
Activity
%
6200
%
unknown
%
3400
%
4875
A1
Disseminate graduation
requirements
16%
$
21.88
28%
$ 25.00
25%
$
20.00
20%
$
17.80
A2
Correct graduation checks
8%
11.62
8%
6.40
7%
6.23
A3
Monitor academic progress
5%
6.60
12%
10.50
5%
4.00
2%
1.78
A4
Issue readmission
contracts
4%
5.28
3%
2.23
A5
Enroll freshmen
7%
10.47
12%
9.60
7%
6.23
A6
Review substitution and
waivers
6%
8.32
7%
6.23
A7
Develop advising materials
0
–
1%
1.25
5%
4.45
A8
Update website
2%
3.46
7%
6.00
18%
14.40
15%
13.35
A9
Advise students
13%
17.70
48%
42.00
32%
25.60
29%
25.37
A10
Check prerequisites
10%
14.66
6%
5.34
A11
Recruit students
14%
19.49
A12
Tutor students
11%
15.46
A13
Arrange career fairs
4%
6.10
Miscellaneous other
4%
3.25
Per FTE
100%
$141.05
100%
$88.00
100%
$80.00
100%
$89.00
Student satisfaction
Low
High
High
High
Units at graduation
147
130
136
132
FTF years to graduation
6.8
4.4
5
5

10–33
Exhibit 5
Activity Evaluation Matrix
Performance
Strategic
Non-Strategic
Perform Well
Cell 1
Continue
Cell 2
Drop or Create Niche
Perform Poorly
Cell 3
Improve
Cell 4
Drop
2
10–34
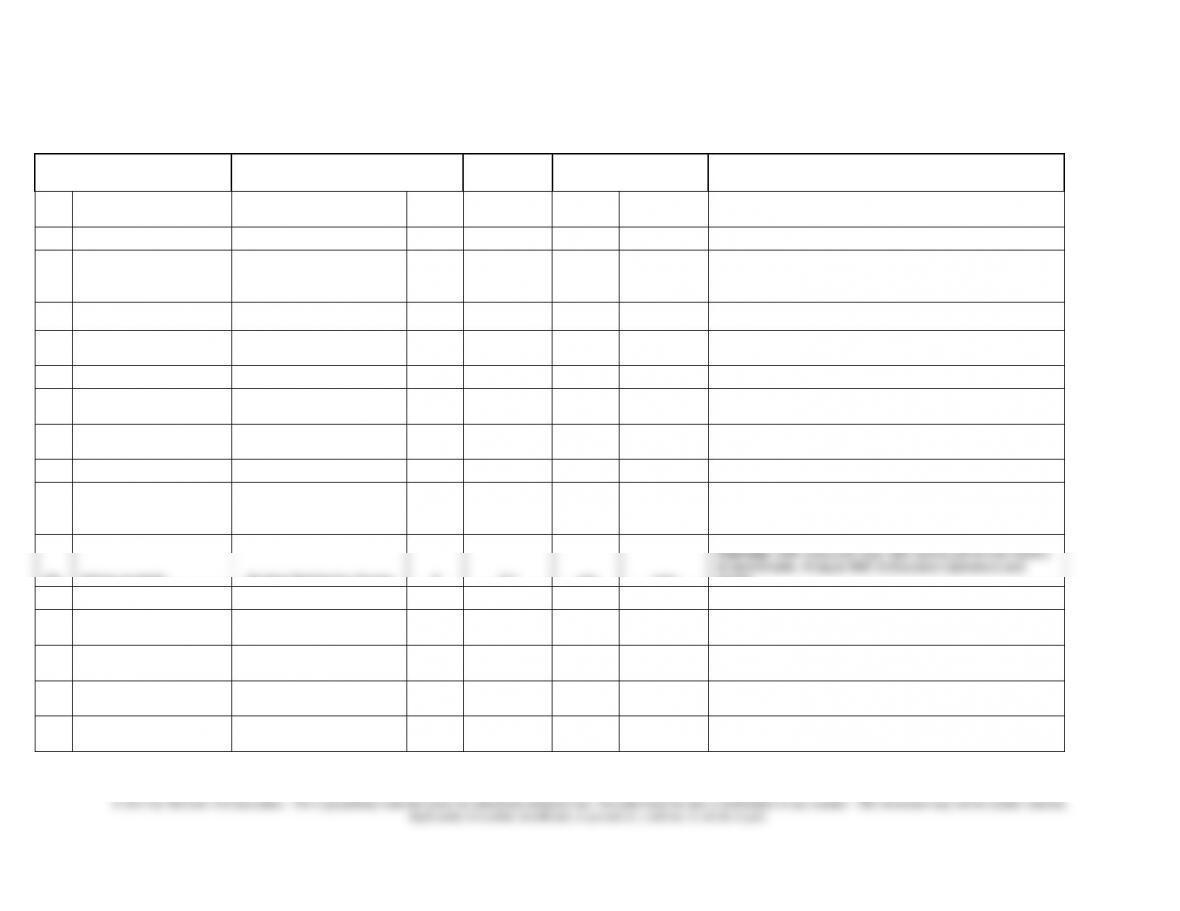
Exhibit 6
COBAA: Activity Evaluation & Suggestions
Activity
University Performance
Measure
Goal
COBAA
Performance
Strategic
Performance
Action Suggested
A1
Disseminate graduation
requirements
Units at graduation
124
units
147
Yes
Poor
Improve. Get details of AMC’s and Education’s operations and
reorganize in a similar way.
Student Satisfaction Survey
5.5
2.6
A2
Correct graduation checks
% needing intervention at
university level
n/a
21%
Short run
yes, long
run no
Poor
Continue until the university revises the graduation check
process. Improve. Study how this activity is performed by AMC
and copy in COBAA.
A3
Monitor academic
progress
Average semesters on
probation
1.5
1.5
yes
good
Continue
A4
Issue readmission
contracts
No measure
n/a
yes
Continue
A5
Enroll freshmen
Freshman satisfaction survey
6
6
yes
good
Continue
A6
Review substitution &
waiver requests
Chair Satisfaction Score
n/a
2.3
no
poor
Drop. Duplicate activity. Department chairs do not like what
COBAA is doing.
A7
Develop advising materials
% major/options with advising
materials
100%
100%
yes
good
Improve. Transfer more items to the Web. Test them with
students so they are user friendly.
Student Satisfaction Survey
5
3.1
marginal
A8
Maintain website
No measure; new initiative
n/a
yes
unknown
Improve. Shift advising materials & paths to graduation on the
Web. Create interactive sections where students can plan their
own four- or five-year plan.
A9
Advise students
Student Satisfaction Survey
5
2.1
yes
poor
Continue. Shift resources here; little activity performed relative
to benchmarks. Analyze AMC & Education operations and
model.
Time to graduation-FTF
5
6.8
A10
Check prerequisites
Student Satisfaction Survey
n/a
2.1
maybe
poor
Continue. Discontinue in long run; computer system should be
reprogrammed. Use student focus group to improve.
A11
Recruit students
% women & other minority
students
n/a
67%
no
good
Drop/ Creative Solution. This activity is done well, transfer
activity to university outreach.
A12
Tutor students
Hours provided
n/a
390
no
good
Drop/ Creative Solution. Transfer to the clubs and redeploy the
computers to the lab or a tutoring room.
A13
Arrange career fairs
% Students with jobs in field
at graduation
n/a
72%
no
good
Drop/Creative Solution. Transfer responsibility to the Career
Center.
2
10–35
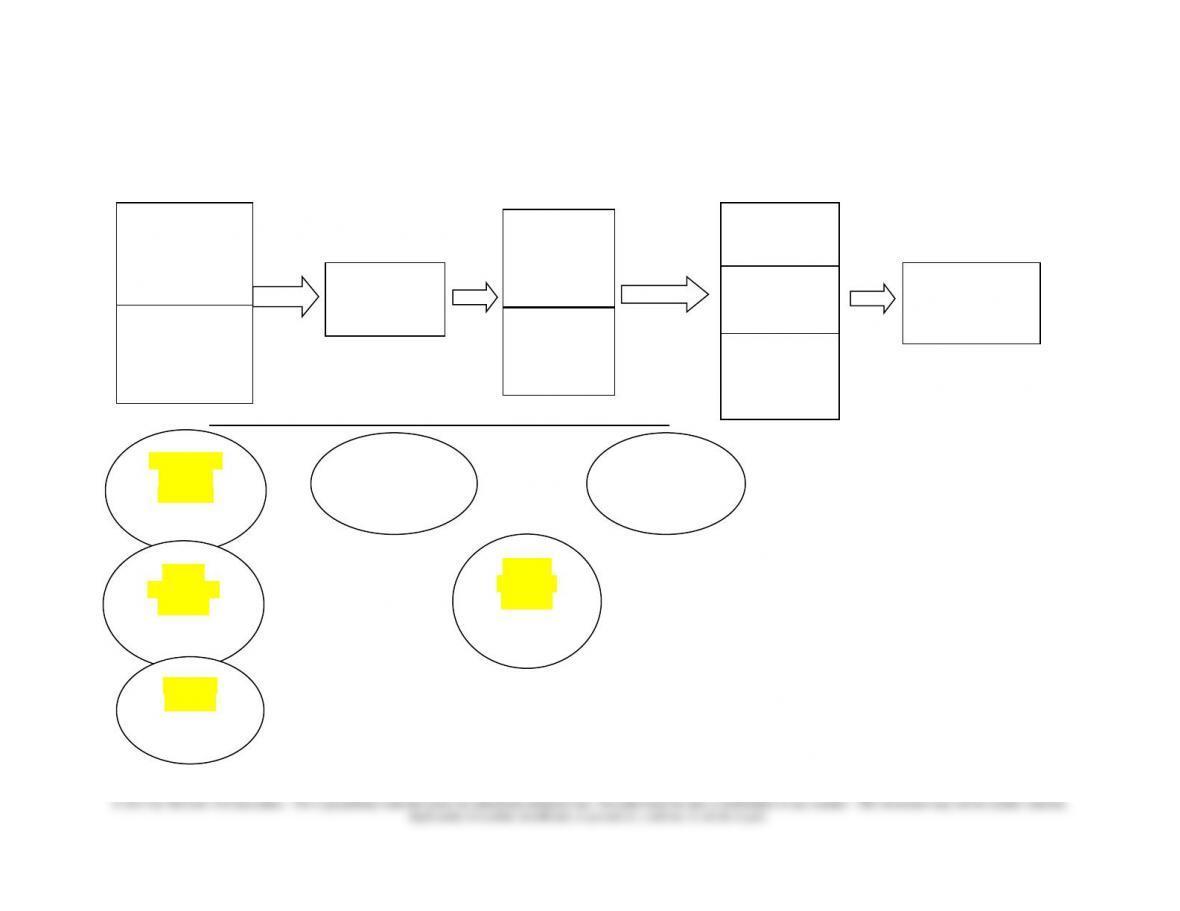
Exhibit 7
Suggested Strategy Map
COBAA STUDENT RESULTS
ACTIVITIES
UNIVERSITY
ACTIVITIES
Understand
Graduation
Requirements &
Course
Prerequisites
Higher GPA
& Academic
Progress
Higher
Retention Rate
Lower Advising
Cost per FTE
Reduced Time
to Graduation
Enrolling in
Proper Courses
Understand how to
use computer
registration
Higher
Student
Satisfaction
Reduced Units
at Graduation
Disseminate
Advising
Materials
A1 A7 &8
Checking
Prerequisites
A10
Graduation
Checks
A2
Monitor
Academic
Progress
A3 &4
Course
Registration
Training
A5
Advising
Students
A9

10–37
Exhibit 8
Summary of Action
COBAA Activities
Performance
Strategic
Non-Strategic
Perform Well
A3, A4, A5
Continue
A11, A12, A13
Creative Solution or Drop
Perform Poorly
A1,A2*,A7,A8, A9, A10
Improve
A2*, A6
Drop
*Shown in two cells: long run, drop; short run, keep.

10–38
Exhibit 9
COBAA
Proposed Budget for 2008
Item
Amount
Change
Revised
Comment
Manager
$ 85,000
$ 85,000
Refocus manager to mission relevant
activities
Advisors
342,000
342,000
85% of manager & 10% of advisors
redeployed by eliminating A6, A11, & A13.
Use time on activities needing
improvement.
Office Staff
73,000
16,500
56,500
Cut 1/2 of part-time hours equal to 1 full-
time equivalent staff person ($33,000 part
time * 1/2)
Equipment & Software
106,400
68,096
38,304
Cut 15 stations used for tutoring; 1 for
headcount reduction; return to physical
plant for redeployment
Reproduction
135,000
13,500
121,500
Remove the amount for A11; ultimately
transfer advising materials to web
Office supplies & phone
69,700
6,970
62,730
Reduce by one headcount
Travel
40,000
40,000
–
Eliminate travel, A11
Hospitality
23,400
23,400
Eliminate hospitality, A13
$874,500
$706,034
Per FTE
$ 141.05
$ 113.88
Budget Reduction
Achieved
19%

10–39
Exhibit 10
COBAA
Scorecard
Perspective
Measures
Financial
Advising cost per FTE
Customer
Student satisfaction with Advising, retention rate, units at graduation, FTF time to
graduate, semesters to graduate for transfer students
Internal
Processes
FTE/Headcount, % advising problems solved by interactive website, % graduation
checks with deficiencies, % student population on probation contracts, % options with
online requirements and suggested paths to graduation
Learning &
Growth
Advisor retention, student suggestions implemented, manager’s report on causes of
student interactions & Web inquiries, # FAQs added to website based on analysis of
frequent causes for questions

10–40
Teaching Notes for Readings
Reading 10-1: “How to Set Up a Budgeting and Planning System”
This article describes the experience in setting up a formal budgeting system for a medium-sized public
utility holding company that provides natural gas storage and transportation services. The task is not as
easy as it might seem. The budget manager had to review the chart of accounts, account classification and
the reporting system of the firm, consider all the users’ diverse information needs, and update the current
accounting information system.
Discussion Questions:
1. What motivates PFG to install a budgeting and planning system?
restoring a common stock dividend. In addition, management wanted to improve expense and cash
flow tracking.
2. Why is flexibility very important for PFG’s budgeting system to be effective?
3. What problems that the budget manager at PFG had to resolve before setting up a budgeting system? Do
you find these problems unique to PFG?
Among the problems that the budget manager at PFG had to resolve include:
b. Divisions have different internal reporting systems and use different accounting software.
The problems that the budget manager at PFG faced were not unique, especially when the firm grew
through mergers and acquisitions.

10–41
4. Why the authors suggest that a thorough review of the firm’s chart of accounts, account
classifications, and reporting systems is a must before initiating a budgeting and planning
system?
Once a system has been installed it is difficult to change. In many cases, a firm’s accounting system
did not keep pace with the changes in the company. Expanded product lines and changes in customers
and geographical areas served could have led to changes in accounting systems. It is best if the budget
manager resolved information classification and reporting issues up front so that budgets are
comparable.
5. Describe budgetary games that people play. What are the reasons for PFG to experience
minimal budgetary gamesmanship?
Budgetary games that people play include padding the budget such as low-balling revenues or
overestimating expenses.
PFG has experienced minimal budgeting gamesmanship for two reasons:

10–42
Reading 10-2: “Strategic Budgeting: A Case Study and Proposed Framework”
This article applies to the budget-preparation process the Critical Chain technique proposed by Eliyahu
Goldratt. All department budgets are reduced by 50%. The savings are grouped in a “Group Budget
Buffer.” Department heads can request additional funds from the buffer but the request would be discussed
openly with other department heads. This reduction method allows costs to be cut where the cuts will not
negatively affect the performance of service departments. At the same time, it identifies areas of “bloat”
where cost reduction can be significant increases communication between departments, lowers overall
spending levels, and assures output integrity.
Discussion Questions:
1. What is the lawnmower method of cost reduction?
This term refers to the process of effecting “across-the-board” cuts in budgetary appropriations when
2. What will be the size of a division’s total budgeted amount after 4 years if the division includes
10% slack each year? after 10 years?
As indicated in Table 1c, with an assumed 10% slack built into the budget each year, the indicated
budget for a Research & Development Division at the end of four years contains slack equal in amount
to 112% of the original budget amount (for year 1). When the time horizon is extrapolated to year 10
(Table 1d), the amount of slack in the budget as a percentage of the original budget amount will have
3. What is the strategic budgeting (SB) model?
This approach to budgeting is borrowed from the “Critical Chain” model for project management
developed by Eliyahu Goldratt in his 1997 book. One way to think of SB is a structure plan to eliminate

10–43
4. What are the strengths of strategic budgeting (SB)? The authors of this article propose the following
benefits of using SB:
(1) Ease of Implementation—especially relative to other approaches to budgeting, such as Zero-Base
Budgeting (ZBB). Note that this conclusion holds particularly for the time of SB implementation
discussed in the article: each subunit initially received a 50% budgetary reduction.
(2) Increased Communication—sharing of information regarding the use of buffer resources helps
achieve coordination of activities and more valid spending (consumption of resources).
(3) Reduced Spending—with traditional approaches to budgeting, managers (having built in slack