Case 10-2: Letsgo Travel Trailers
Data Input Area
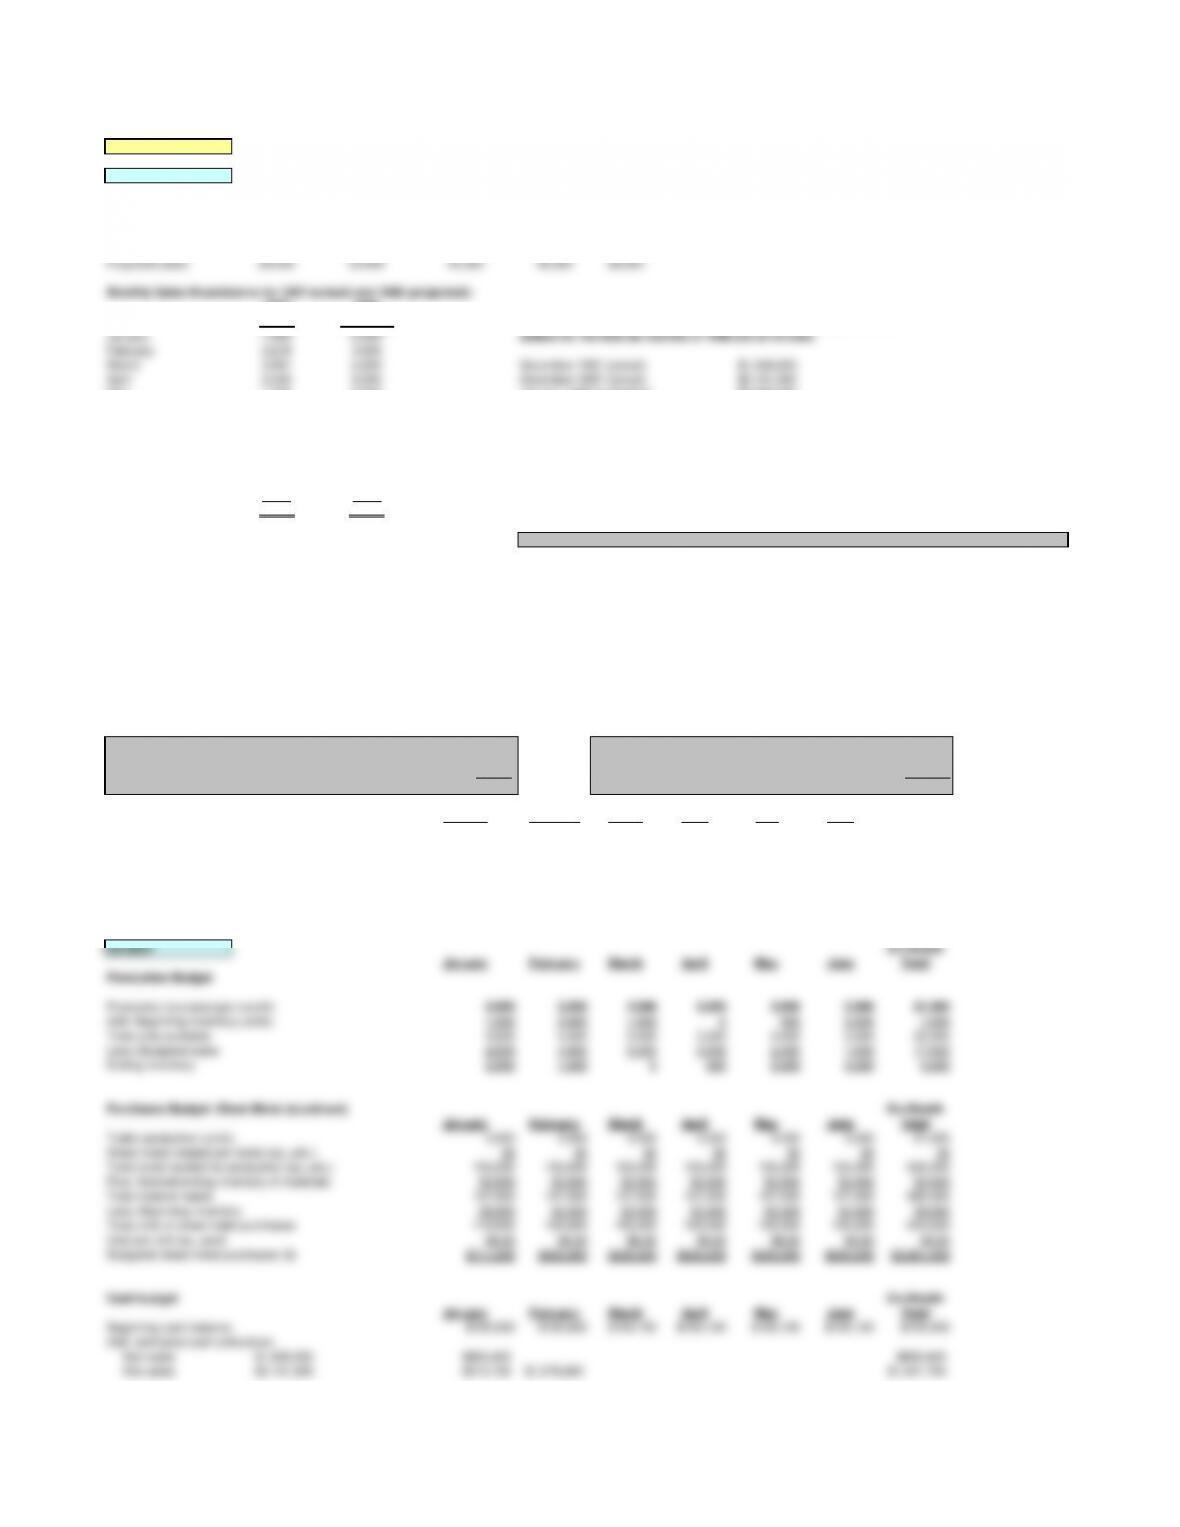
Exhibit 1: Actual and Projected Sales in Number of Trailers
1992 1993 1994 1995 1996 1997
Actual sales 13,765 14,880 15,991 17,809 19,634 23,322
1998 1999 2000 2001 2002
Projected sales 28,000 33,600 40,320 48,384 58,060
Monthly Sales Breakdowns for 1997 (actual) and 1998 (projected):
1997 1998
Actual Projected
Actual sales dollars for last two months of 1997 and budgeted sales
January 1,983 2,500 dollars for the first six months of 1998 are as follows:
February 3,218 4,000
March 3,981 5,000 November 1997 (actual) $1,439,000
April 3,240 3,000 December 1997 (actual) $2,131,000
May 1,755 2,000 January 1998 (budgeted) $2,500,000
June 901 1,000 February 1998 (budgeted) $4,000,000
July 763 1,000 March 1998 (budgeted) $5,000,000
August 611 1,000 April 1998 (budgeted) $3,000,000
September 1,622 2,000 May 1998 (budgeted) $2,200,000
October 1,678 2,000 June 1998 (budgeted) $1,100,000
November 1,439 2,000
December 2,131 2,500 Variable component of targeted ending inventory (% of next month’s sales) = 20%
Totals 23,322 28,000 Fixed component of targeted ending inventory (in units) = 300 units
Budgeted inventory, 12-31-97 1,000 units
Sheet Metal (aluminum) needed per trailer(sq. yds.) = 30
Targeted materials ending inventory (sq. yds.) = 50% times next month’s production needs
Budgeted production, July = 1,000 trailers
Materials inventory (sq. yds.), January 1st = 39,000
Budgeted materials cost/sq. yd. = $6.00
Cash Balance, January 1 = $100,000
Minimum cash balance required = $100,000
Pattern of cash collections (sales on account):
Collected in month of sales = 25%
Collected in month after month of sales = 10%
Collected in second month following month of sales = 60%
Estimated Uncollectible accounts = 5%
Balance of Accounts Payable, 12-31-97 (merchandise) =
$850,000
Budgeted expenses: January February March April May June
Materials purchases $870,000 $1,320,000 $1,110,000 $690,000 $420,000 $330,000
Wages $624,000 $1,008,000 $1,104,000 $672,000 $432,000 $240,000
Heat, light, power $130,000 $195,000 $220,000 $135,000 $110,000 $110,000
Equipment rental $390,000 $390,000 $390,000 $340,000 $340,000 $340,000
Equipment purchases $300,000 $300,000 $300,000 $300,000 $300,000 $300,000
Depreciation $250,000 $250,000 $250,000 $275,000 $275,000 $275,000
Selling & administrative expenses $400,000 $400,000 $400,000 $400,000 $400,000 $400,000
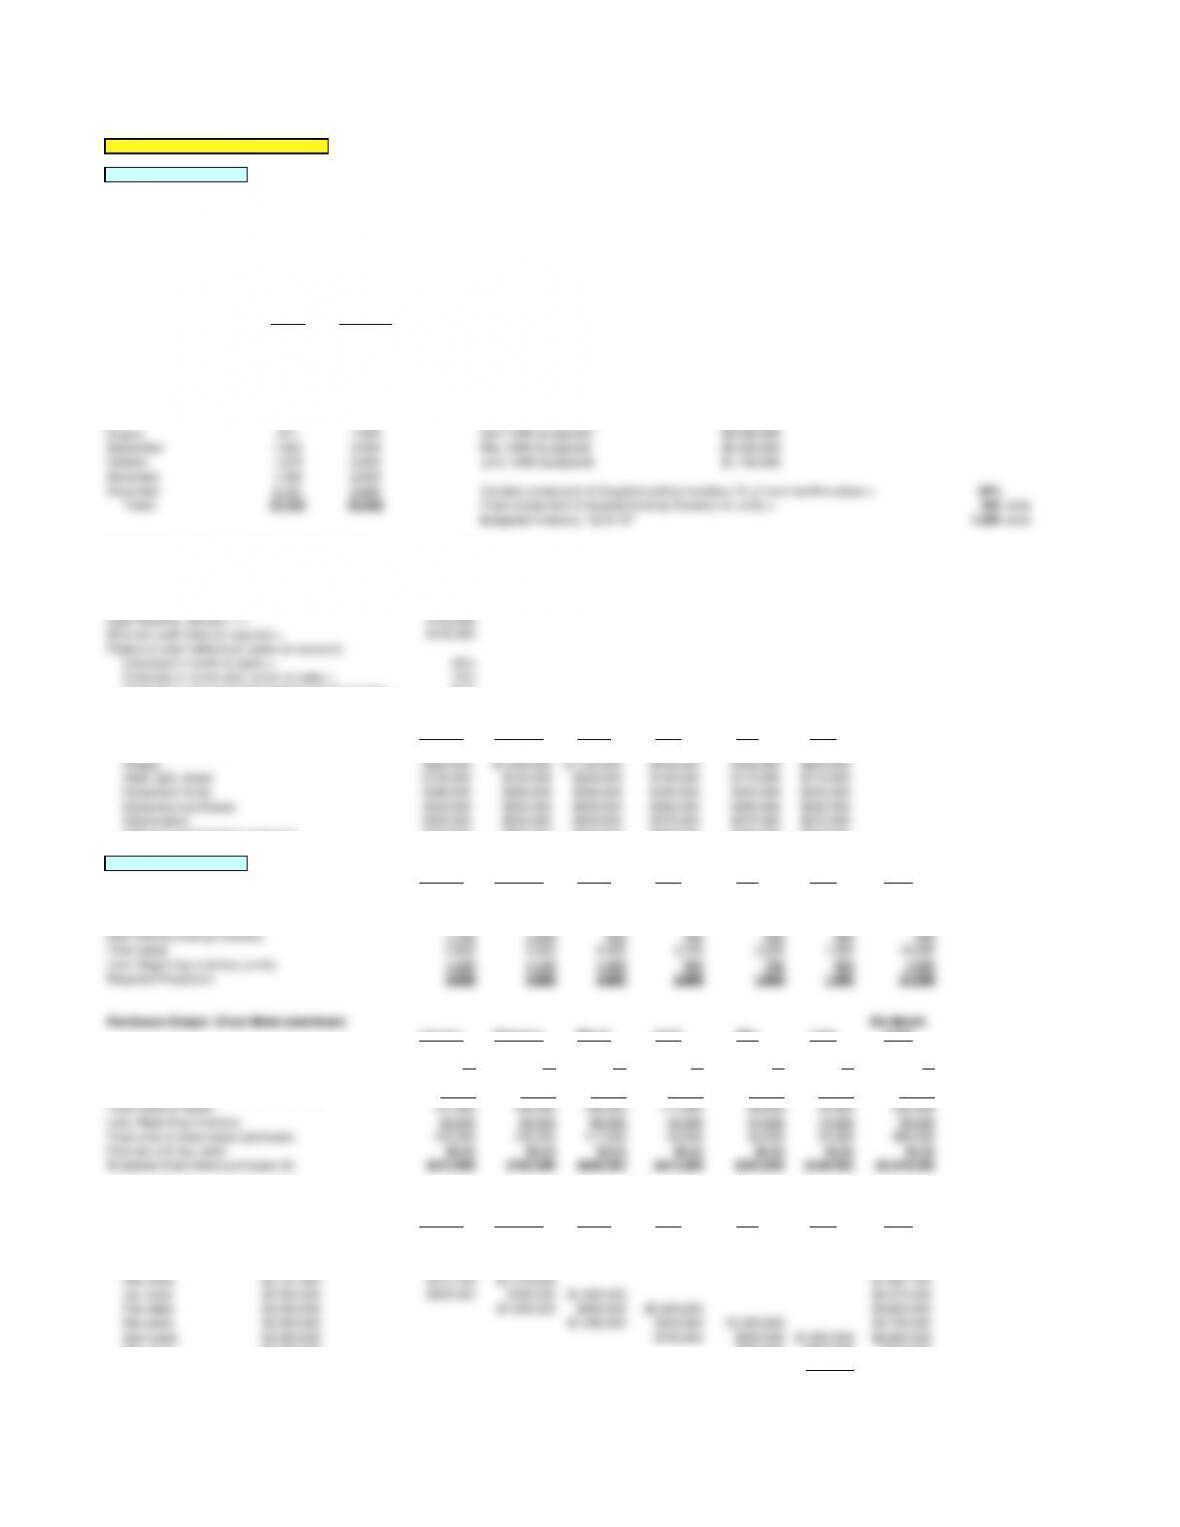
Question 2 Solution Six-Month
January February March April May June Total
Production Budget
Budgeted sales (units) 2,500 4,000 5,000 3,000 2,000 1,000 17,500
Add: Desired ending inventory 1,100 1,300 900 700 500 500 500
Total needs 3,600 5,300 5,900 3,700 2,500 1,500 18,000
Less: Beginning inventory (units) 1,000 1,100 1,300 900 700 500 1,000
Required Production 2,600 4,200 4,600 2,800 1,800 1,000 17,000
Purchases Budget–Sheet Metal (aluminum) Six-Month
January February March April May June Total
Trailer production (units) 2,600 4,200 4,600 2,800 1,800 1,000 17,000
Sheet metal needed per trailer (sq. yds.) 30 30 30 30 30 30 30
Total metal needed for production (sq. yds.) 78,000 126,000 138,000 84,000 54,000 30,000 510,000
Plus: Desired ending inventory of materials 63,000 69,000 42,000 27,000 15,000 15,000 15,000
Total material needs 141,000 195,000 180,000 111,000 69,000 45,000 525,000
Less: Beginning inventory 39,000 63,000 69,000 42,000 27,000 15,000 39,000
Total units of sheet metal purchases 102,000 132,000 111,000 69,000 42,000 30,000 486,000
Cost per unit (sq. yard) $6.00 $6.00 $6.00 $6.00 $6.00 $6.00 $6.00
Budgeted sheet metal purchases ($) $612,000 $792,000 $666,000 $414,000 $252,000 $180,000 $2,916,000
Cash budget Six-Month
January February March April May June Total
Beginning cash balance $100,000 $100,500 $100,100 $100,100 $100,100 $100,100 $100,000
Add: estimated cash collections:
Nov sales $1,439,000 $863,400 $863,400
Dec sales $2,131,000 $213,100 $1,278,600 $1,491,700
Jan sales $2,500,000 $625,000 $250,000 $1,500,000 $2,375,000
Feb sales $4,000,000 $1,000,000 $400,000 $2,400,000 $3,800,000
Mar sales $5,000,000 $1,250,000 $500,000 $3,000,000 $4,750,000
April sales $3,000,000 $750,000 $300,000 $1,800,000 $2,850,000
May sales $2,200,000 $550,000 $220,000 $770,000
June sales $1,100,000 $275,000 $275,000
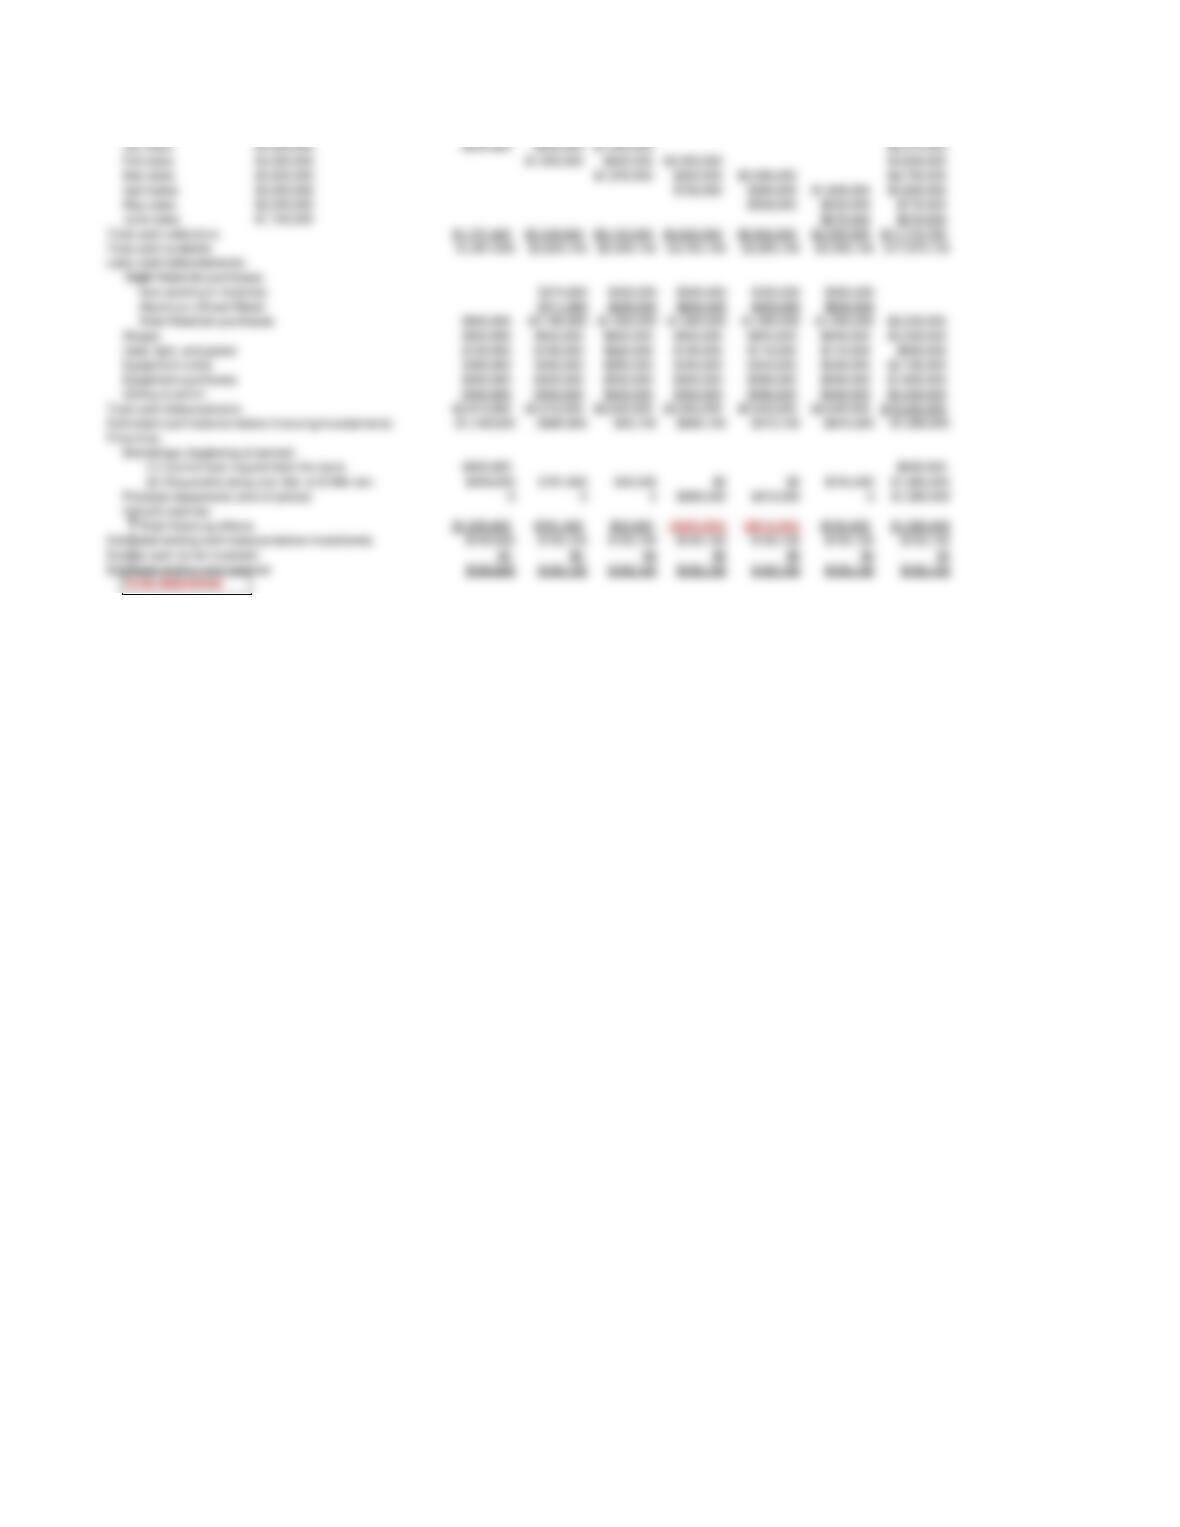
Total cash collections $1,701,500 $2,528,600 $3,150,000 $3,650,000 $3,850,000 $2,295,000 $17,175,100
Total cash available $1,801,500 $2,629,100 $3,250,100 $3,750,100 $3,950,100 $2,395,100 $17,275,100
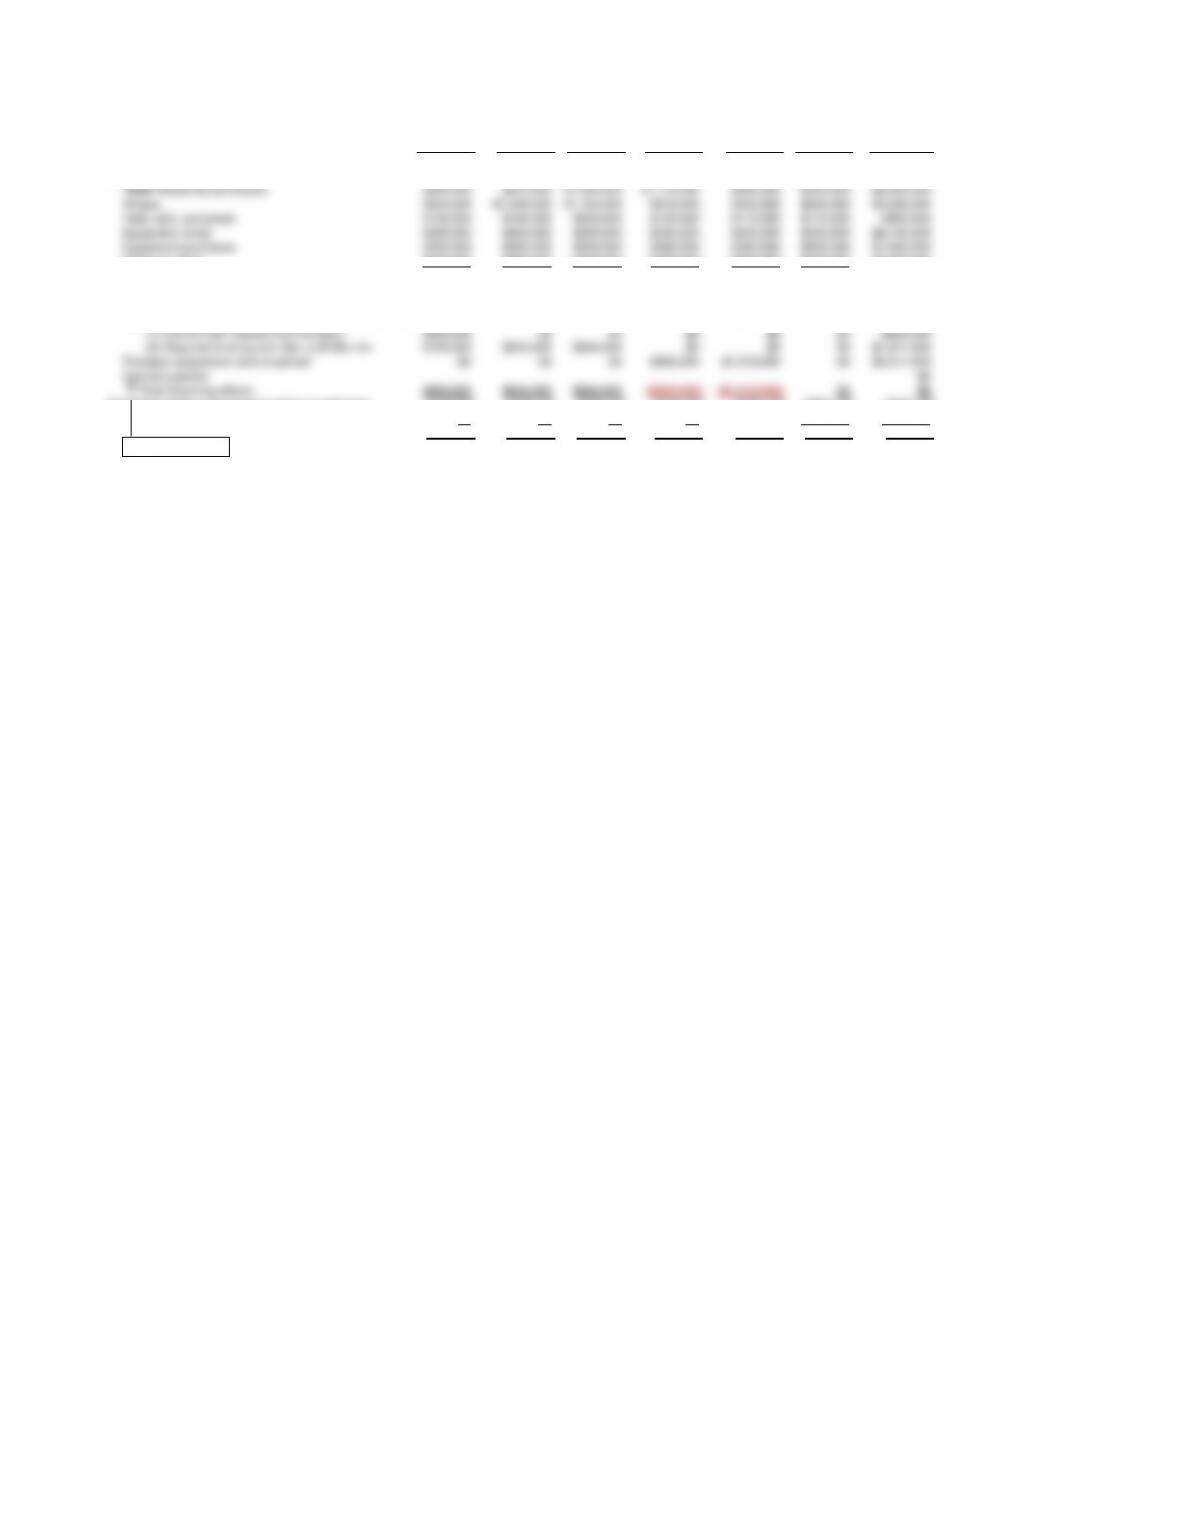
Less: cash disbursements:
Total Mataerials purchases $850,000 $870,000 $1,320,000 $1,110,000 $690,000 $420,000 $5,260,000
Wages $624,000 $1,008,000 $1,104,000 $672,000 $432,000 $240,000 $4,080,000
Heat, light, and power $130,000 $195,000 $220,000 $135,000 $110,000 $110,000 $900,000
Equipment rental $390,000 $390,000 $390,000 $340,000 $340,000 $340,000 $2,190,000
Equipment purchases $300,000 $300,000 $300,000 $300,000 $300,000 $300,000 $1,800,000
Selling & admin. $400,000 $400,000 $400,000 $400,000 $400,000 $400,000 $2,400,000
Total cash disbursements $2,694,000 $3,163,000 $3,734,000 $2,957,000 $2,272,000 $1,810,000 $16,630,000
Estimated cash balance before financing/investements: -$892,500 -$533,900 -$483,900 $793,100 $1,678,100 $585,100 $645,100
Financing:
Borrowings (beginning of period):
(1) Current loan r equest from the bank $800,000 $0 $0 $0 $0 $0 $800,000
(2) Required to bring end. Bal. to $100k min. $193,000 $634,000 $584,000 $0 $0 $0 $1,411,000
Principal repayments (end of period) $0 $0 $0 $693,000 $1,518,000 $0 $2,211,000
Interest expense $0
Total fina ncing effects $993,000 $634,000 $584,000 ($693,000) ($1,518,000) $0 $0
Estimated ending cash balance before investments $100,500 $100,100 $100,100 $100,100 $160,100 $585,100 $645,100
Excess cash (to be invested) $0 $0 $0 $0 $60,000 $485,000 $545,000
Estimated ending cash balance $100,500 $100,100 $100,100 $100,100 $100,100 $100,100 $100,100
To be determined
Question 3 (a)
Data Input Area
Exhibit 1: Actual and Projected Sales in Number of Trailers
1992 1993 1994 1995 1996 1997
Actual sales 13,765 14,880 15,991 17,809 19,634 23,322
1998 1999 2000 2001 2002
Projected sales 28,000 33,600 40,320 48,384 58,060
Monthly Sales Breakdowns for 1997 (actual) and 1998 (projected):
1997 1998
Actual Projected Actual sales dollars for last two months of 1997 and budgeted sales
January 1,983 2,500 dollars for the first six months of 1998 are as follows:
February 3,218 4,000
March 3,981 5,000 November 1997 (actual) $1,439,000
April 3,240 3,000 December 1997 (actual) $2,131,000
May 1,755 2,000 January 1998 (budgeted) $2,500,000
June 901 1,000 February 1998 (budgeted) $4,000,000
July 763 1,000 March 1998 (budgeted) $5,000,000
August 611 1,000 April 1998 (budgeted) $3,000,000
September 1,622 2,000 May 1998 (budgeted) $2,200,000
October 1,678 2,000 June 1998 (budgeted) $1,100,000
November 1,439 2,000
December 2,131 2,500 Variable component of targeted ending inventory (% of next month‘s sales) = 20%
Totals 23,322 28,000 Fixed component of targeted ending inventory (in units) = 300 units
Budgeted inventory, 12-31-97 1,000 units
Budgeted production (constant per month) = 3,000 units
Sheet Metal (aluminum) needed per trailer(sq. yds.) = 30
Targeted materials ending inventory (sq. yds.) = 50% times next month’s production needs
Budgeted production, July = 3,000 trailers
Materials inventory (sq. yds.), January 1st = 39,000
Budgeted materials cost/sq. yd. = $6.00
Cash Balance, January 1 = $100,000
Minimum cash balance required = $100,000
Pattern of cash collections (sales on account):
Collected in month of sales = 25%
Collected in month after month of sales = 10%
Collected in second month following month of sales = 60%
Estimated Uncollectible accounts =
5%
Balance of Accounts Payable, 12-31-97 (merchandise) = $850,000
Budgeted expenses: January February March April May June
Merchandise purchases $870,000 $1,320,000 $1,110,000 $690,000 $420,000 $330,000
Wages $624,000 $1,008,000 $1,104,000 $672,000 $432,000 $240,000
Heat, light, power $130,000 $195,000 $220,000 $135,000 $110,000 $110,000
Equipment rental $390,000 $390,000 $390,000 $340,000 $340,000 $340,000
Equipment purchases $300,000 $300,000 $300,000 $300,000 $300,000 $300,000
Depreciation $250,000 $250,000 $250,000 $275,000 $275,000 $275,000
Selling & administrative expenses $400,000 $400,000 $400,000 $400,000 $400,000 $400,000
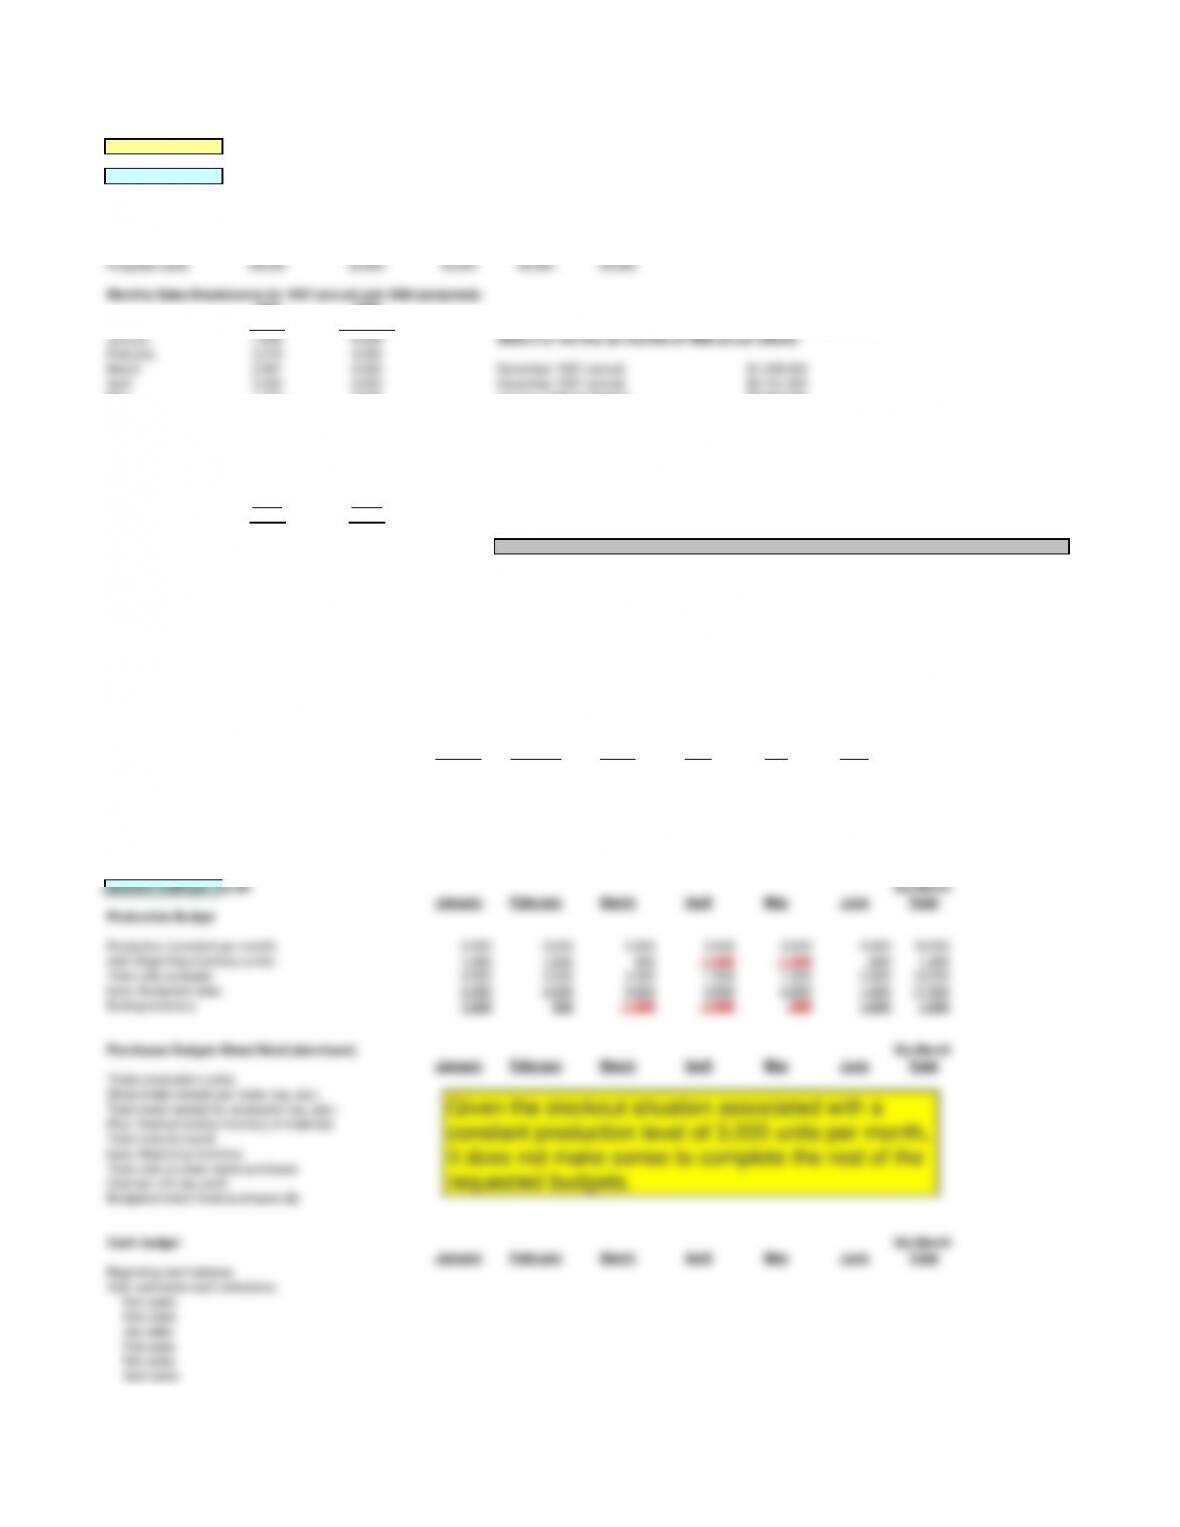
Solution 3,000 per month Six-Month
January February March April May June Total
Production Budget
Production (constant per month) 3,000 3,000 3,000 3,000 3,000 3,000 18,000
Add: Beginning inventory (units) 1,000 1,500 500 -1,500 -1,500 -500 1,000
Total units available 4,000 4,500 3,500 1,500 1,500 2,500 19,000
Less: Budgeted sales 2,500 4,000 5,000 3,000 2,000 1,000 17,500
Ending inventory 1,500 500 -1,500 -1,500 -500 1,500 1,500
Purchases Budget–Sheet Metal (aluminum) Six-Month
January February March April May June Total
Trailer production (units)
Sheet metal needed per trailer (sq. yds.)
Total metal needed for production (sq. yds.)
Plus: Desired ending inventory of materials
Total material needs
Less: Beginning inventory
Total units of sheet metal purchases
Cost per unit (sq. yard)
Budgeted sheet metal purchases ($)
Cash budget Six-Month
January February March April May June Total
Beginning cash balance
Add: estimated cash collections:
Nov sales
Dec sales
Jan sales
Feb sales
Mar sales
April sales
Given the stockout situation associated with a
constant production level of 3,000 units per month,
it does not make sense to complete the rest of the
requested budgets.
May sales
June sales
Total cash collections
Total cash available
Less: cash disbursements:
Total Merchandise purchases
Wages
Heat, light, and power
Equipment rental
Equipment purchases
Selling & admin.
Total cash disbursements
Estimated cash balance before financing/investements:
Financing:
Borrowings (beginning of period):
(1) Current loan request from the bank
(2) Required to bring end. Bal. to $100k min.
Principal repayments (end of period)
Interest expense
Total financing effects
Estimated ending cash balance before investments
Excess cash (to be invested)
Estimated ending cash balance
To be determined
Question 3 (b)
Data Input Area
Exhibit 1: Actual and Projected Sales in Number of Trailers
1992 1993 1994 1995 1996 1997
Actual sales 13,765 14,880 15,991 17,809 19,634 23,322
1998 1999 2000 2001 2002
Projected sales 28,000 33,600 40,320 48,384 58,060
Monthly Sales Breakdowns for 1997 (actual) and 1998 (projected):
1997 1998
Actual Projected Actual sales dollars for last two months of 1997 and budgeted sales
January 1,983 2,500 dollars for the first six months of 1998 are as follows:
February 3,218 4,000
March 3,981 5,000 November 1997 (actual) $1,439,000
April 3,240 3,000 December 1997 (actual) $2,131,000
May 1,755 2,000 January 1998 (budgeted) $2,500,000
June 901 1,000 February 1998 (budgeted) $4,000,000
July 763 1,000 March 1998 (budgeted) $5,000,000
August 611 1,000 April 1998 (budgeted) $3,000,000
September 1,622 2,000 May 1998 (budgeted) $2,200,000
October 1,678 2,000 June 1998 (budgeted) $1,100,000
November 1,439 2,000
December 2,131 2,500
Totals 23,322 28,000
Budgeted inventory, 12-31-97 1,000 units
Budgeted production (constant per month) = 3,500 units
Sheet Metal (aluminum) needed per trailer(sq. yds.) = 30
Targeted materials ending inventory (sq. yds.) = 50% times next month’s production needs
Budgeted production, July = 3,500 trailers
Materials inventory (sq. yds.), January 1st = 39,000
Budgeted materials cost/sq. yd. = $6.00
Cash Balance, January 1 = $100,000
Minimum cash balance required = $100,000
Pattern of cash collections (sales on account):
Collected in month of sales = 25%
Collected in month after month of sales = 10%
Collected in second month following month of sales = 60%
Estimated Uncollectible accounts = 5%
Balance of Accounts Payable, 12-31-97 (merchandise) = $850,000
Budgeted labor (wage) cost per unit, January-June (original case facts): Ratio of Total Material Purchases to Aluminum Purchases:
Total Wages Paid, January-June period = $4,080,000
Total Material Purchases, March through June =
$3,540,000
Total Units Produced, January-June period =
17,000 Total Aluminum Purchases, Feb. through May = 2124000
Average Wage Cost per Unit Produced = $240
Ratio of Total Purchases to Alum. Pu rchases =
166.67%
Budgeted expenses: January February March April May June
Materials purchases
Wages $840,000 $840,000 $840,000 $840,000 $840,000 $840,000
Heat, light, power $130,000 $195,000 $220,000 $135,000 $110,000 $110,000
Equipment rental $390,000 $390,000 $390,000 $340,000 $340,000 $340,000
Equipment purchases $300,000 $300,000 $300,000 $300,000 $300,000 $300,000
Depreciation $250,000 $250,000 $250,000 $275,000 $275,000 $275,000
Selling & administrative expenses $400,000 $400,000 $400,000 $400,000 $400,000 $400,000
Solution Six-Month
January February March April May June Total
Production Budget
Production (constant per month) 3,500 3,500 3,500 3,500 3,500 3,500 21,000
Add: Beginning inventory (units) 1,000 2,000 1,500 0 500 2,000 1,000
Total units available 4,500 5,500 5,000 3,500 4,000 5,500 22,000
Less: Budgeted sales 2,500 4,000 5,000 3,000 2,000 1,000 17,500
Ending inventory 2,000 1,500 0 500 2,000 4,500 4,500
Purchases Budget–Sheet Metal (aluminum) Six-Month
January February March April May June Total
Trailer production (units) 3,500 3,500 3,500 3,500 3,500 3,500 21,000
Sheet metal needed per trailer (sq. yds.) 30 30 30 30 30 30 30
Total metal needed for production (sq. yds.) 105,000 105,000 105,000 105,000 105,000 105,000 630,000
Plus: Desired ending inventory of materials 52,500 52,500 52,500 52,500 52,500 52,500 52,500
Total material needs 157,500 157,500 157,500 157,500 157,500 157,500 682,500
Less: Beginning inventory 39,000 52,500 52,500 52,500 52,500 52,500 39,000
Total units of sheet metal purchases 118,500 105,000 105,000 105,000 105,000 105,000 643,500
Cost per unit (sq. yard) $6.00 $6.00 $6.00 $6.00 $6.00 $6.00 $6.00
Budgeted sheet metal purchases ($) $711,000 $630,000 $630,000 $630,000 $630,000 $630,000 $3,861,000
Cash budget Six-Month
January February March April May June Total
Beginning cash balance $100,000 $100,500 $100,100 $100,100 $100,100 $100,100 $100,000
Add: estimated cash collections:
Nov sales $1,439,000 $863,400 $863,400
Dec sales $2,131,000 $213,100 $1,278,600 $1,491,700
Jan sales $2,500,000 $625,000 $250,000 $1,500,000 $2,375,000
Feb sales $4,000,000 $1,000,000 $400,000 $2,400,000 $3,800,000
Mar sales $5,000,000 $1,250,000 $500,000 $3,000,000 $4,750,000
April sales $3,000,000 $750,000 $300,000 $1,800,000 $2,850,000
May sales $2,200,000 $550,000 $220,000 $770,000
June sales $1,100,000 $275,000 $275,000
Total cash collections $1,701,500 $2,528,600 $3,150,000 $3,650,000 $3,850,000 $2,295,000 $17,175,100
Total cash available $1,801,500 $2,629,100 $3,250,100 $3,750,100 $3,950,100 $2,395,100 $17,275,100
Less: cash disbursements:
Total Materials purchases:
Non-aluminum materials $474,000 $420,000 $420,000 $420,000 $420,000
Aluminum (Sheet Metal) $711,000 $630,000 $630,000 $630,000 $630,000
Total Materials purchases $850,000 $1,185,000 $1,050,000 $1,050,000 $1,050,000 $1,050,000 $6,235,000
Wages $840,000 $840,000 $840,000 $840,000 $840,000 $840,000 $5,040,000
Heat, light, and power $130,000 $195,000 $220,000 $135,000 $110,000 $110,000 $900,000
Equipment rental $390,000 $390,000 $390,000 $340,000 $340,000 $340,000 $2,190,000
Equipment purchases $300,000 $300,000 $300,000 $300,000 $300,000 $300,000 $1,800,000
Selling & admin. $400,000 $400,000 $400,000 $400,000 $400,000 $400,000 $2,400,000
Total cash disbursements $2,910,000 $3,310,000 $3,200,000 $3,065,000 $3,040,000 $3,040,000 $18,565,000
Estimated cash balance before financing/investements: -$1,108,500 -$680,900 $50,100 $685,100 $910,100 -$644,900 -$1,289,900
Financing:
Borrowings (beginning of period):
(1) Current loan request from the bank $800,000 $800,000
(2) Required to bring end. Bal. to $10 0 k min. $409,000 $781,000 $50,000 $0 $0 $745,000 $1,985,000
Principal repayments (end of period) 0 0 0 $585,000 $810,000 0 $1,395,000
Interest expense
Total financing effects $1,209,000 $781,000 $50,000 ($585,000) ($810,000) $745,000 $1,390,000
Estimated ending cash balance before investments $100,500 $100,100 $100,100 $100,100 $100,100 $100,100 $100,100
Excess cash (to be invested) $0 $0 $0 $0 $0 $0 $0
Estimated ending cash balance $100,500 $100,100 $100,100 $100,100 $100,100 $100,100 $100,100
To be determined