Chapter 08S – The Transportation Model
8S–11
(i) Evaluate the empty cells using the following formula:
Cell Evaluation = Cell Cost – (Row Index + Column Index)
Cell
Evaluation
1-1
8 – (0 + 7) = 1
2-2
1 – (-5 + 2) = 4
2-3
3 – (-5 + 5) = 3
3-3
6 – (0 + 5) = 1
Optimal Solution
From:
To:
1
2
3
Supply
8
2
5
1
15
75
90
2
1
3
2
105
105
7
2
6
3
45
60
105
Demand
150
75
75
300 \ 300
8S–12
2. A toy manufacturer wants to open a third warehouse. The new warehouse will supply 500
units per week. Two locations are being studied, N1 and N2. Transportation costs for location
N1 to stores A, B, & C are $6, $8, and $7 per unit, respectively. Transportation costs for
location N2 to stores A, B, & C are $10, $6, and $4 per unit, respectively. Select the location
for the third warehouse that will minimize total transportation cost.
Location N1 Option
From:
To:
A
B
C
Supply
8
3
7
1
500
5
10
9
2
400
6
8
7
N1
500
Demand
400
600
350
1,350 \ 1,400
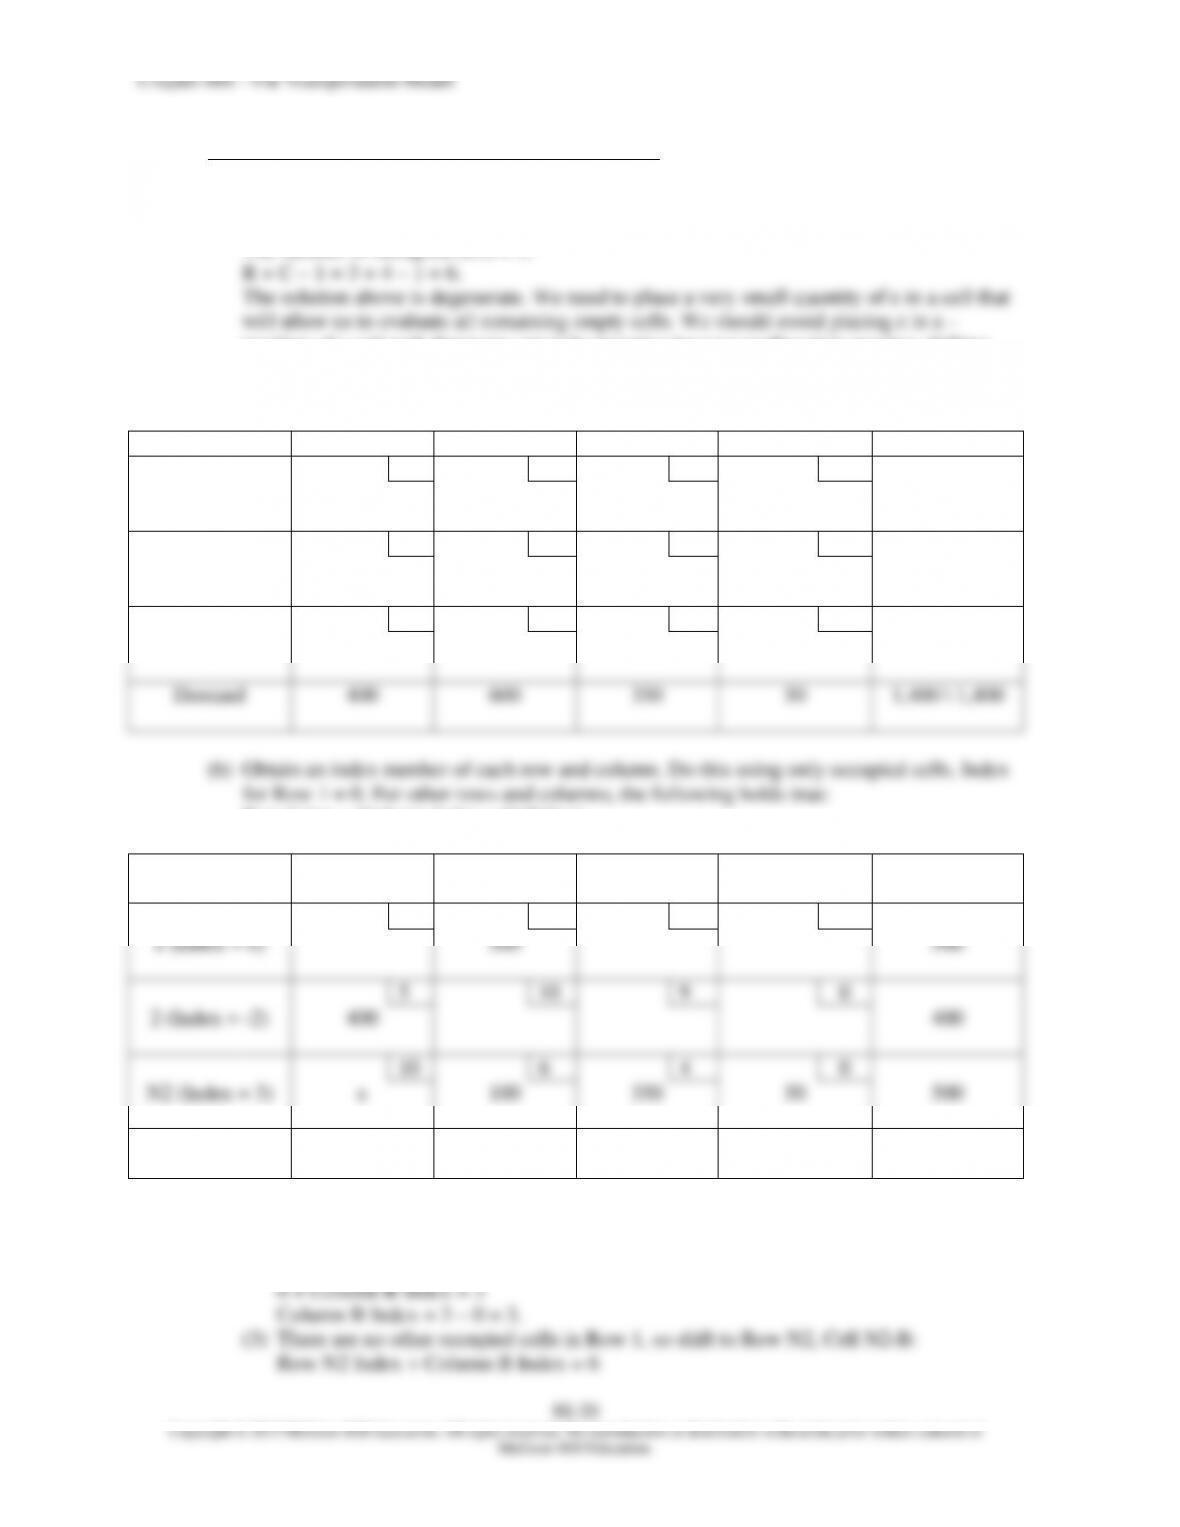
(a) Check to see if supply and demand are equal. They are not equal—supply exceeds
demand. We need to add a dummy warehouse with demand of 50 as shown below. Note:
We make assignments to dummy cells last.
From:
To:
A
B
C
Dummy
Supply
8
3
7
0
1
500
5
10
9
0
2
400
6
8
7
0
N1
500
Demand
400
600
350
50
1,400 \ 1,400
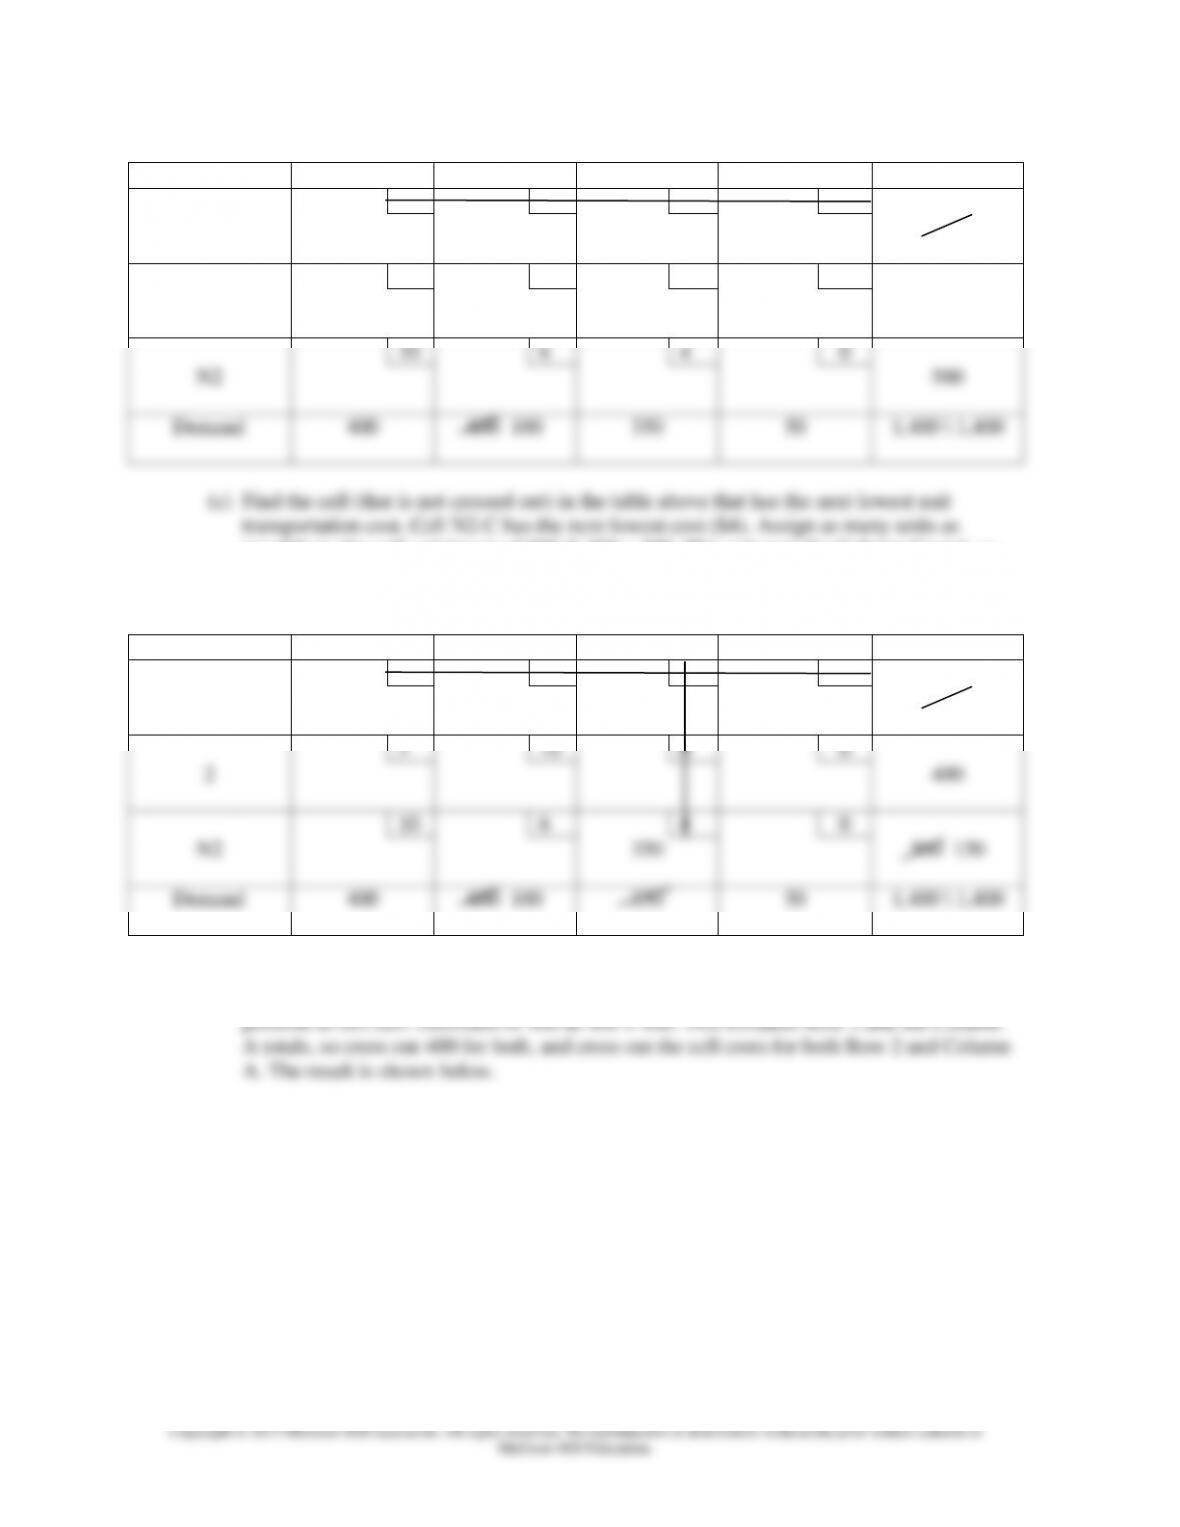
(b) Find the cell in the table above that has the lowest unit transportation cost. Cell 1-B has
the lowest cost ($3). Assign as many units as possible to this cell: minimum of 500 & 600
= 500. This exhausts the Row 1 total, so cross out 500, and cross out the cell costs for
Row 1. Revise the Column B total to 100. The result is shown below.
Chapter 08S – The Transportation Model
8S–13
From:
To:
A
B
C
Dummy
Supply
8
3
7
0
1
500
500
5
10
9
0
2
400
6
8
7
0
N1
500
Demand
400
600 100
350
50
1,400 \ 1,400
A totals, so cross out 400 for both, and cross out the cell costs for Row 2 and Column A.
The result is shown below.
From:
To:
A
B
C
Dummy
Supply
8
3
7
0
1
500
500
5
10
9
0
2
400
400
6
8
7
0
N1
500
Demand
400
600 100
350
50
1,400 \ 1,400
The result is shown below.
From:
To:
A
B
C
Dummy
Supply
8
3
7
0
1
500
500
5
10
9
0
2
400
400
6
8
7
0
N1
350
500 150
Demand
400
600 100
350
50
1,400 \ 1,400
8S–14
Copyright © 2015 McGraw-Hill Education. All rights reserved. No reproduction or distribution without the prior written consent of
McGraw-Hill Education.
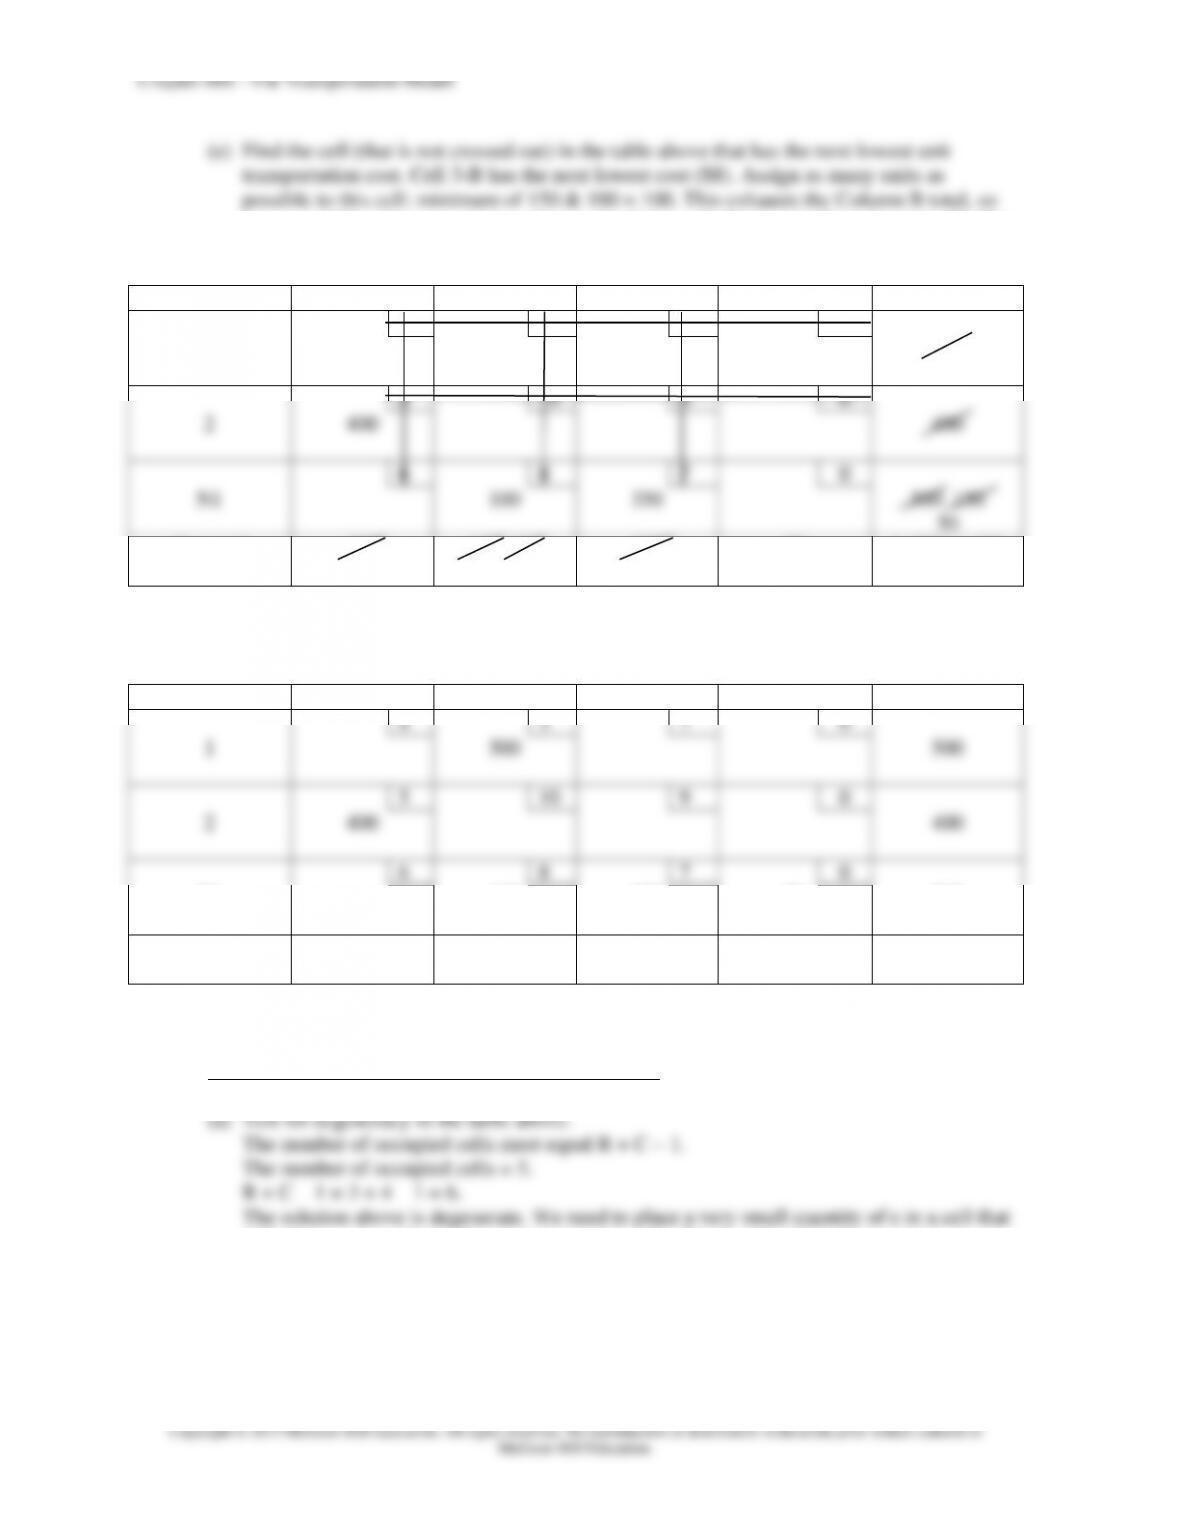
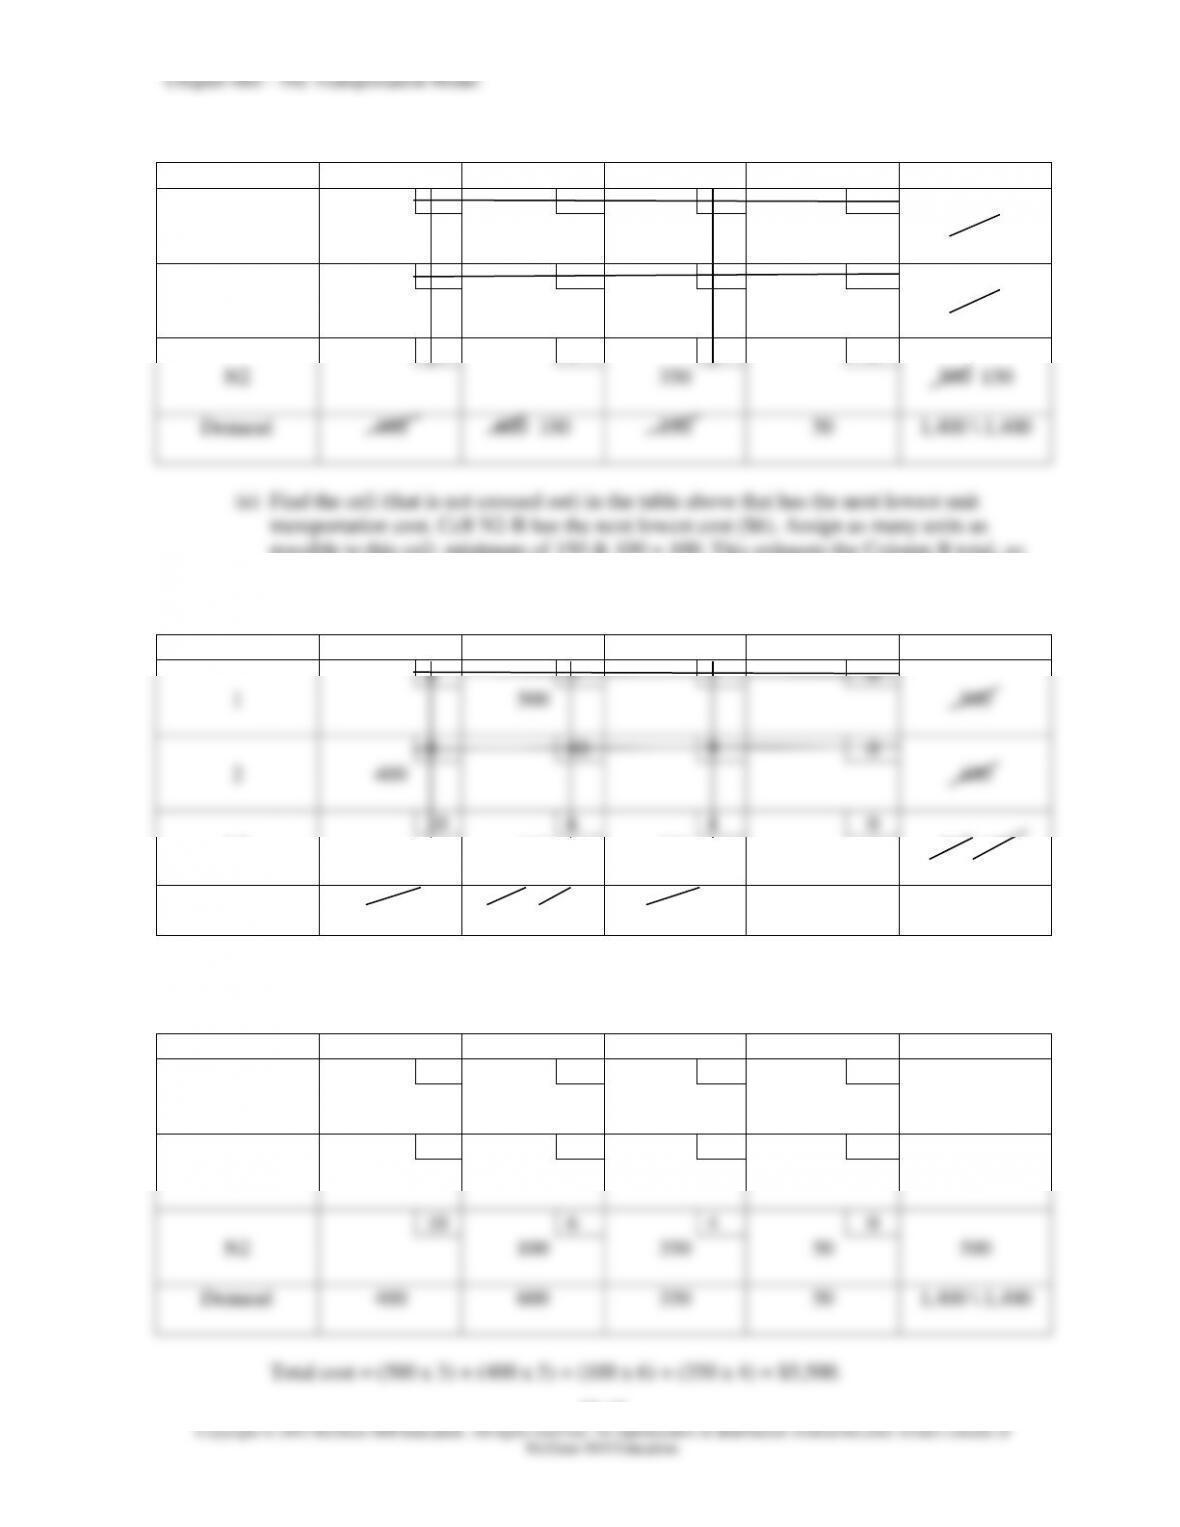
(e) Find the cell (that is not crossed out) in the table above that has the next lowest unit
transportation cost. Cell 3-B has the next lowest cost ($8). Assign as many units as
possible to this cell: minimum of 150 & 100 = 100. This exhausts the Column B total, so
cross out 100, and cross out the cell costs for Column B. Revise the Row 3 total to 50. The
result is shown below.
From:
To:
A
B
C
Dummy
Supply
8
3
7
0
1
500
500
5
10
9
0
2
400
400
6
8
7
0
N1
100
350
500 150
50
Demand
400
600 100
350
50
1,400 \ 1,400
(f) Assign the extra 50 units of supply from Row N1 to N1-Dummy. The initial solution is
shown below:
From:
To:
A
B
C
Dummy
Supply
8
3
7
0
1
500
500
5
10
9
0
2
400
400
6
8
7
0
N1
100
350
50
500
Demand
400
600
350
50
1,400 \ 1,400
Total cost = (500 x 3) + (400 x 5) + (100 x 8) + (350 x 7) = $6,750.
Step 2: Evaluate empty cells with the MODI method:
will allow us to evaluate all remaining empty cells. We should avoid placing ε in a –
position of a cell path that turns out to be negative because reallocation requires shifting
the smallest quantity in a minus position. We can place the ε in Cell N1-A as shown
below:
Chapter 08S – The Transportation Model
From:
To:
A
B
C
Dummy
Supply
8
3
7
0
1
500
500
5
10
9
0
2
400
400
6
8
7
0
N1
ε
100
350
50
500
Demand
400
600
350
50
1,400 \ 1,400
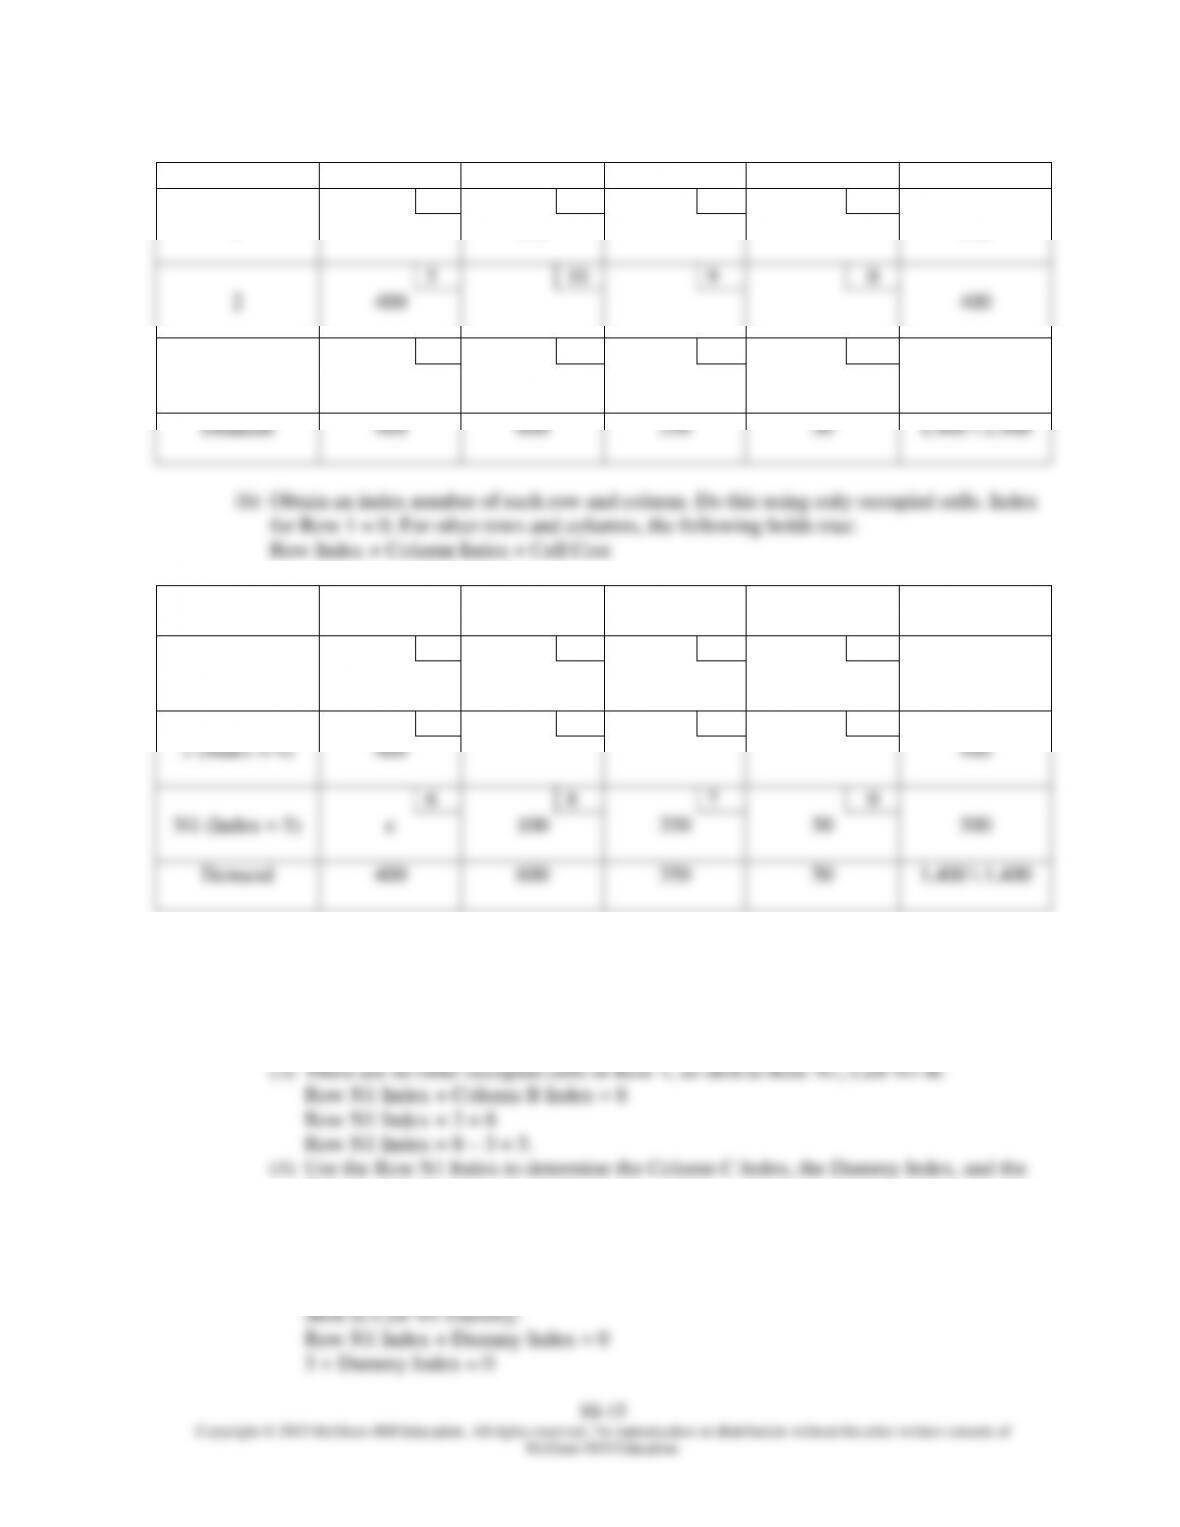
From:
To:
A
(Index = 1)
B
(Index = 3)
C
(Index = 2)
Dummy
(Index = –5)
Supply
8
3
7
0
1 (Index = 0)
500
500
5
10
9
0
2 (Index = 4)
400
400
6
8
7
0
N1 (Index = 5)
ε
100
350
50
500
Demand
400
600
350
50
1,400 \ 1,400
(1) Row 1 Index = 0.
(2) Shift to Cell 1-B:
Row 1 Index + Column B Index = 3
0 + Column B Index = 3
Column B Index = 3 – 0 = 3.
Column A Index:
Shift to Cell N1-C:
Row N1 Index + Column C Index = 7
5 + Column C Index = 7
Column C Index = 7 – 5 = 2.
Chapter 08S – The Transportation Model
8S–16
Dummy Index = 0 – 5 = -5.
Shift to Cell N1-A:
Row N1 Index + Column A Index = 6
Row 2 Index = 5 – 1 = 4.
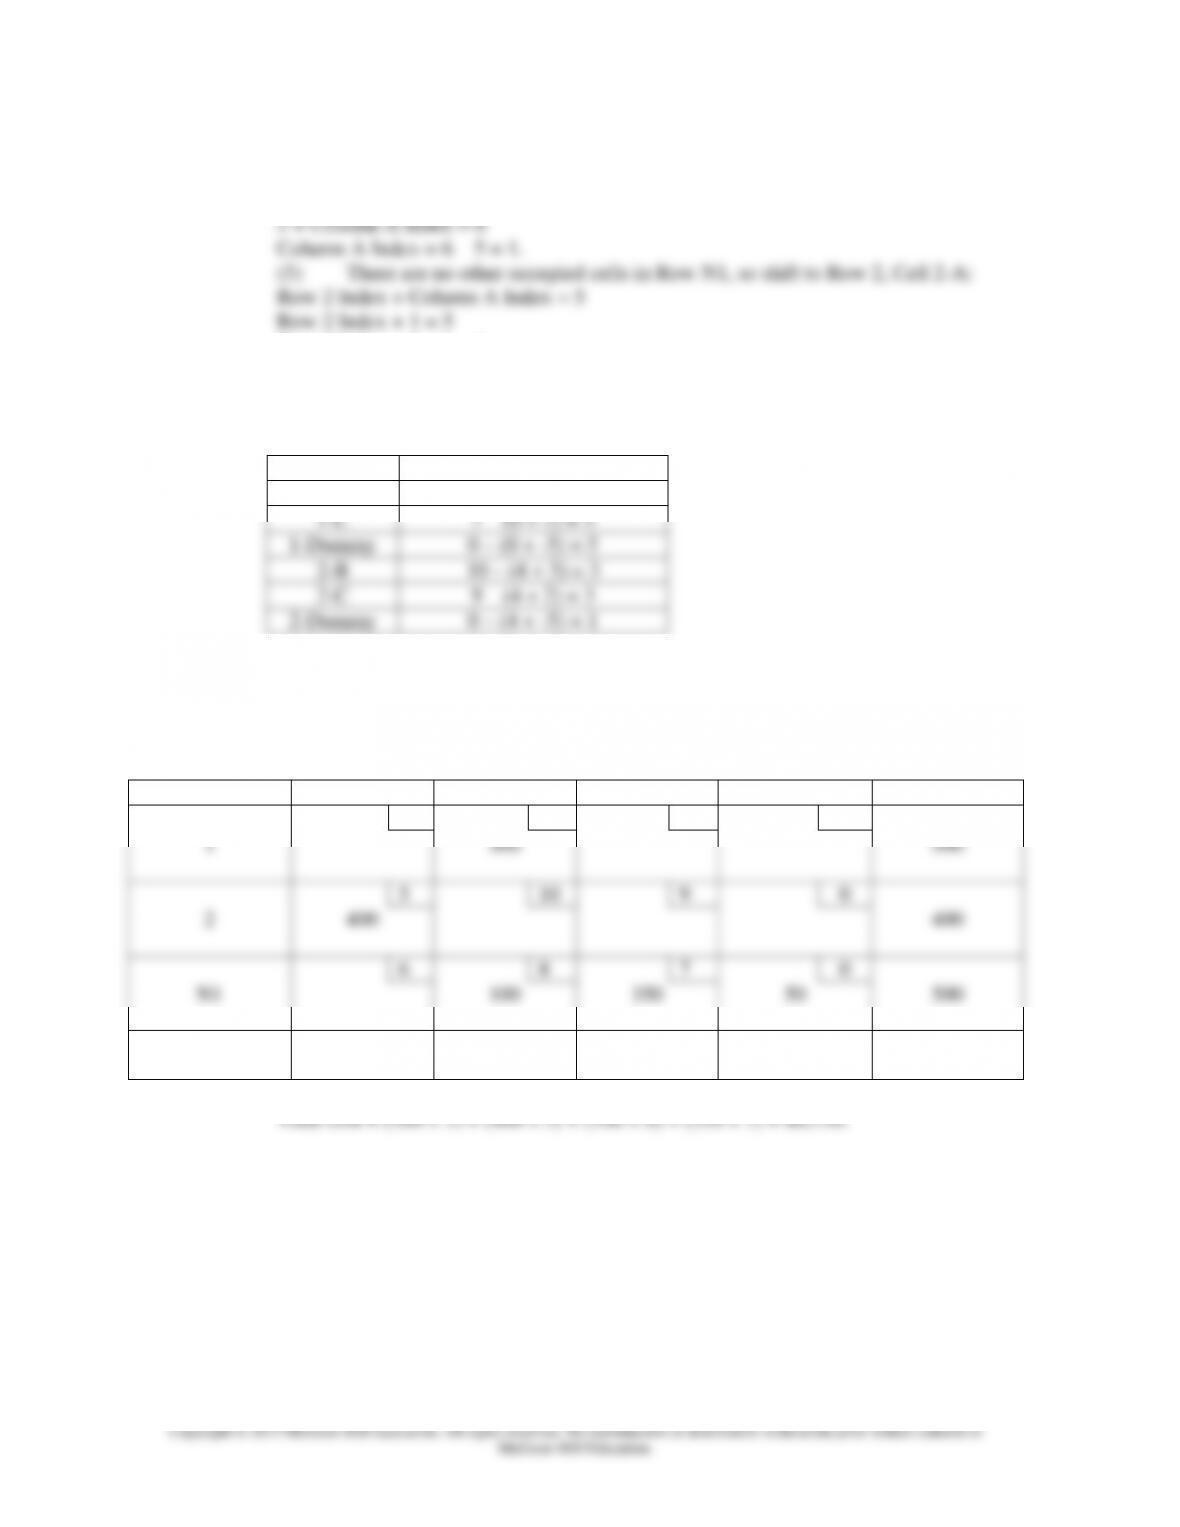
(c) Evaluate the empty cells using the following formula:
Cell Evaluation = Cell Cost – (Row Index + Column Index)
Cell
Evaluation
1-A
8 – (0 + 1) = 7
1-C
7 – (0 + 2) = 5
1-Dummy
0 – (0 + –5) = 5
2-B
10 – (4 + 3) = 3
2-C
9 – (4 + 2) = 3
2-Dummy
0 – (4 + –5) = 1
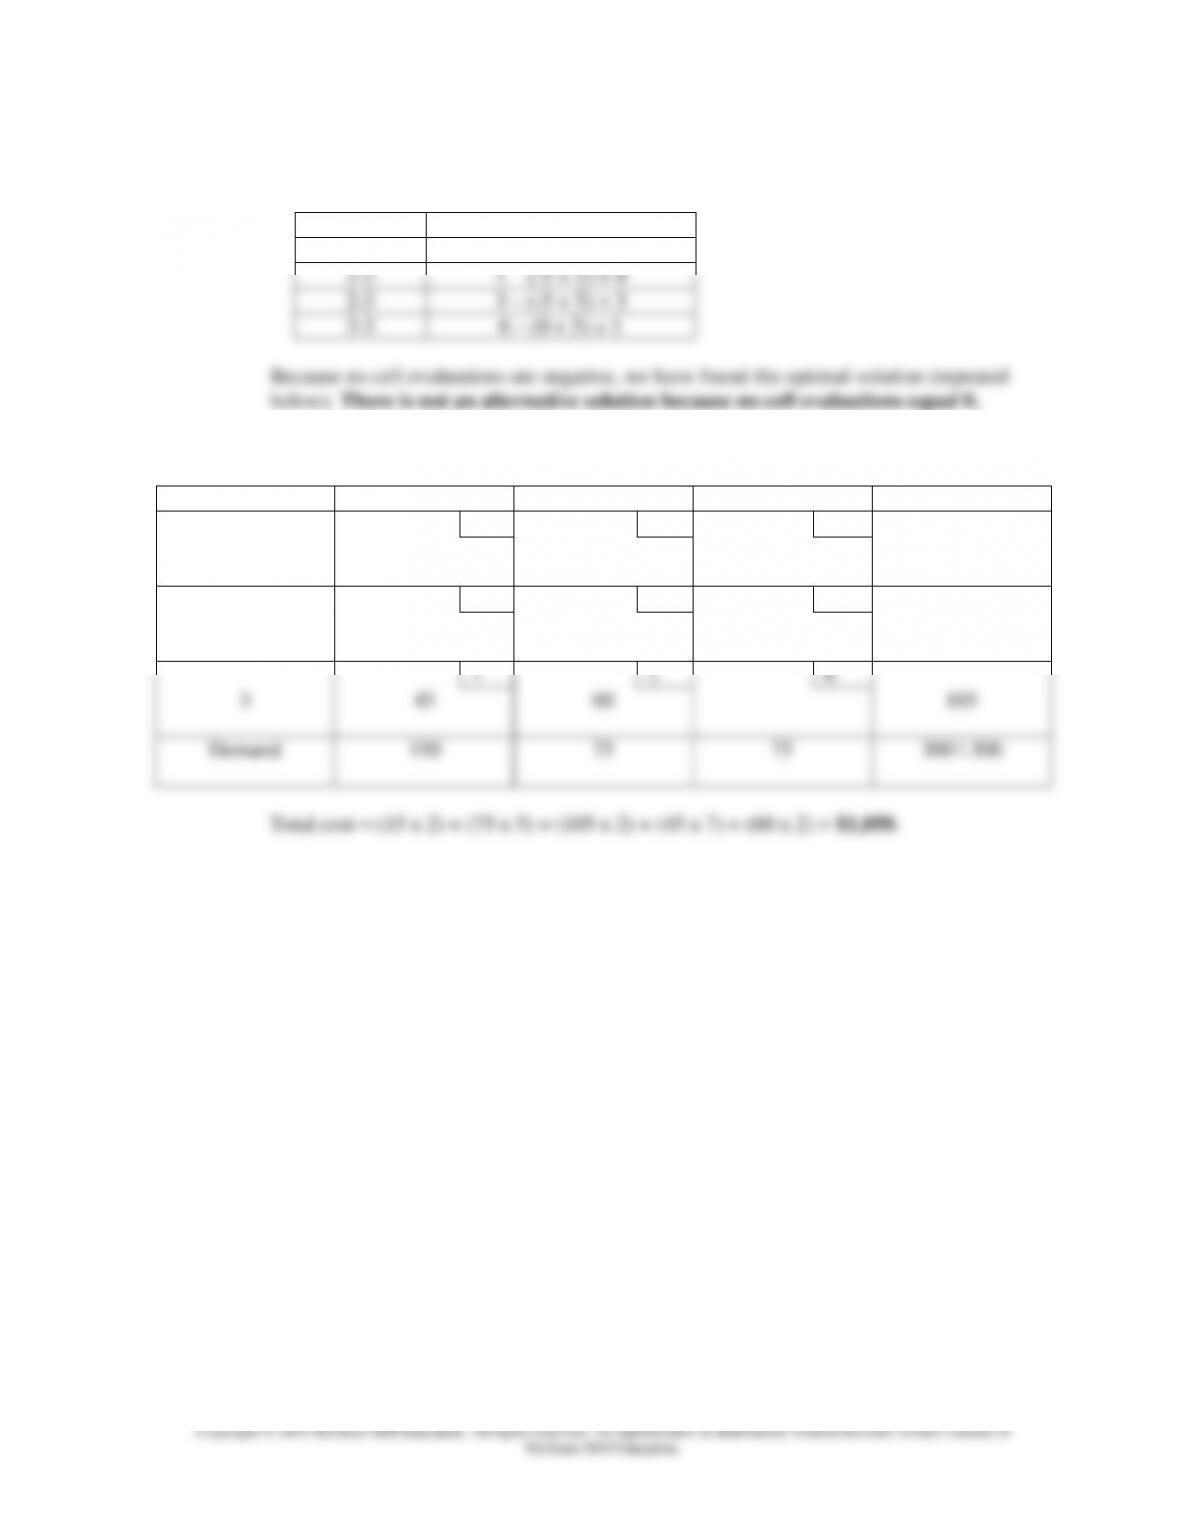
Because no cell evaluations are negative, we have found the minimum cost solution for
N1 (repeated below).
Location N1 Option
From:
To:
A
B
C
Dummy
Supply
8
3
7
0
1
500
500
5
10
9
0
2
400
400
6
8
7
0
N1
100
350
50
500
Demand
400
600
350
50
1,400 \ 1,400
Total cost = (500 x 3) + (400 x 5) + (100 x 8) + (350 x 7) = $6,750.
Chapter 08S – The Transportation Model
8S–17
Location N2 Option
From:
To:
A
B
C
Supply
8
3
7
1
500
5
10
9
2
400
10
6
4
N2
500
Demand
400
600
350
1,350 \ 1,400
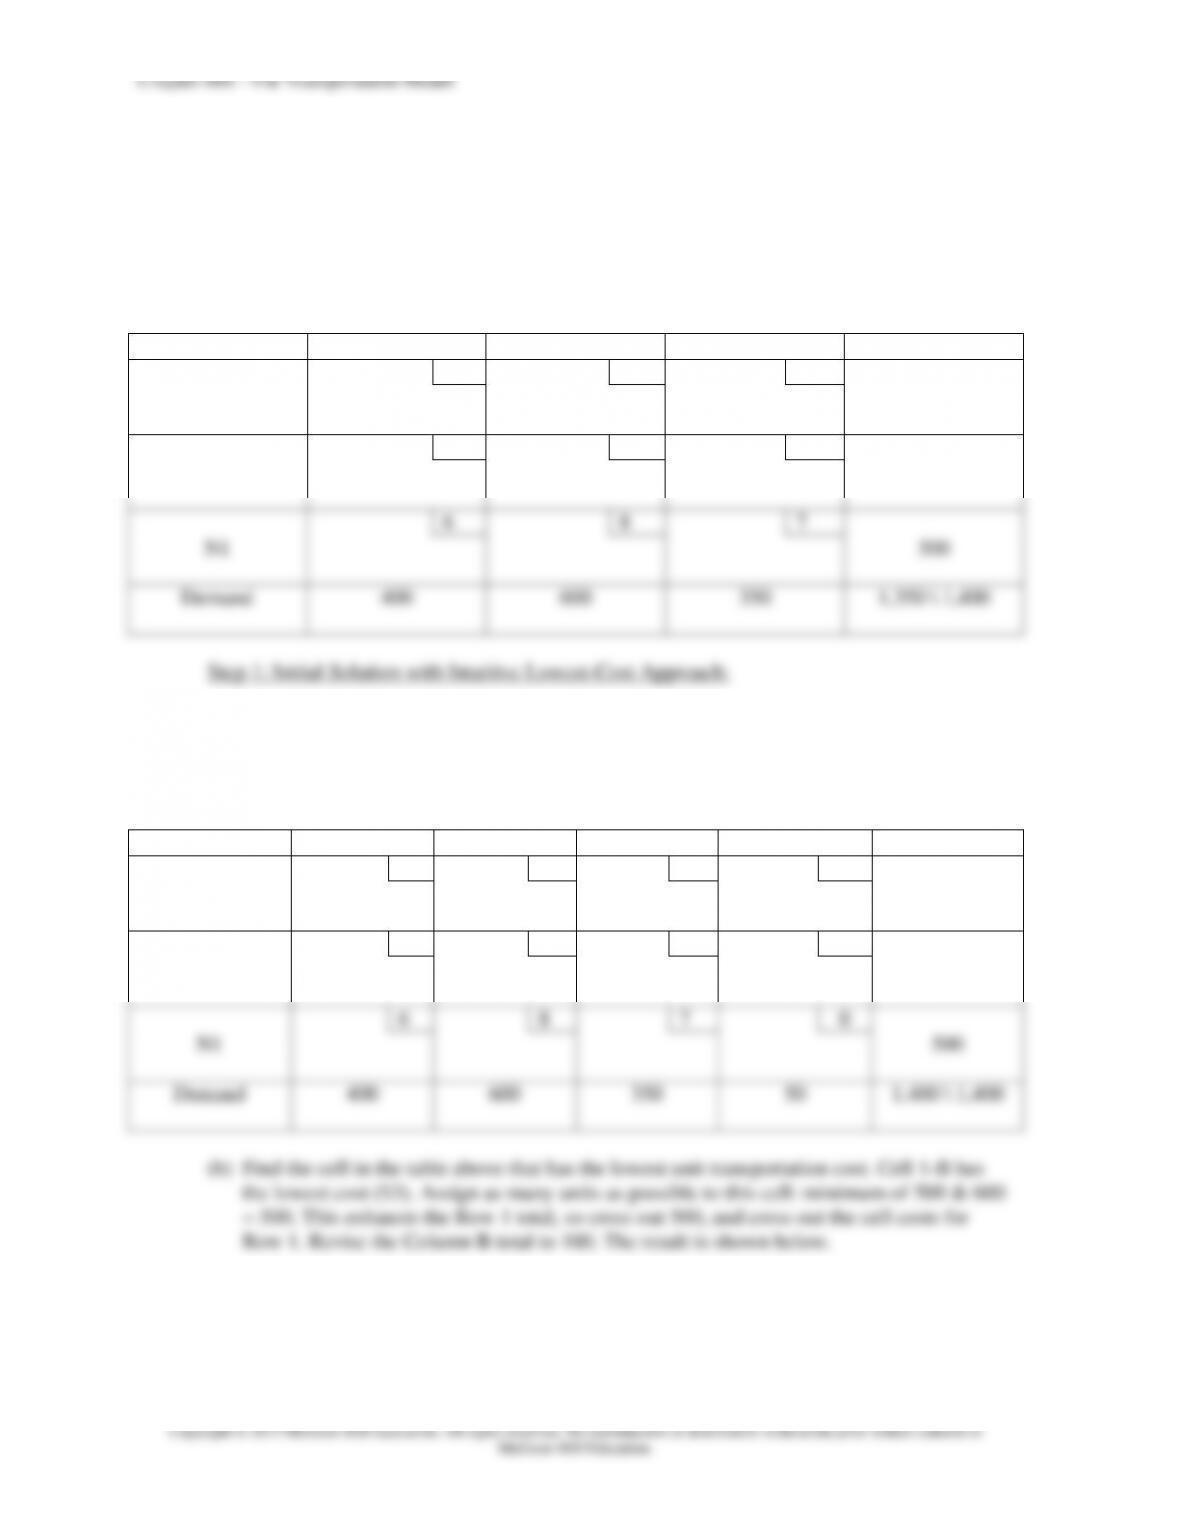
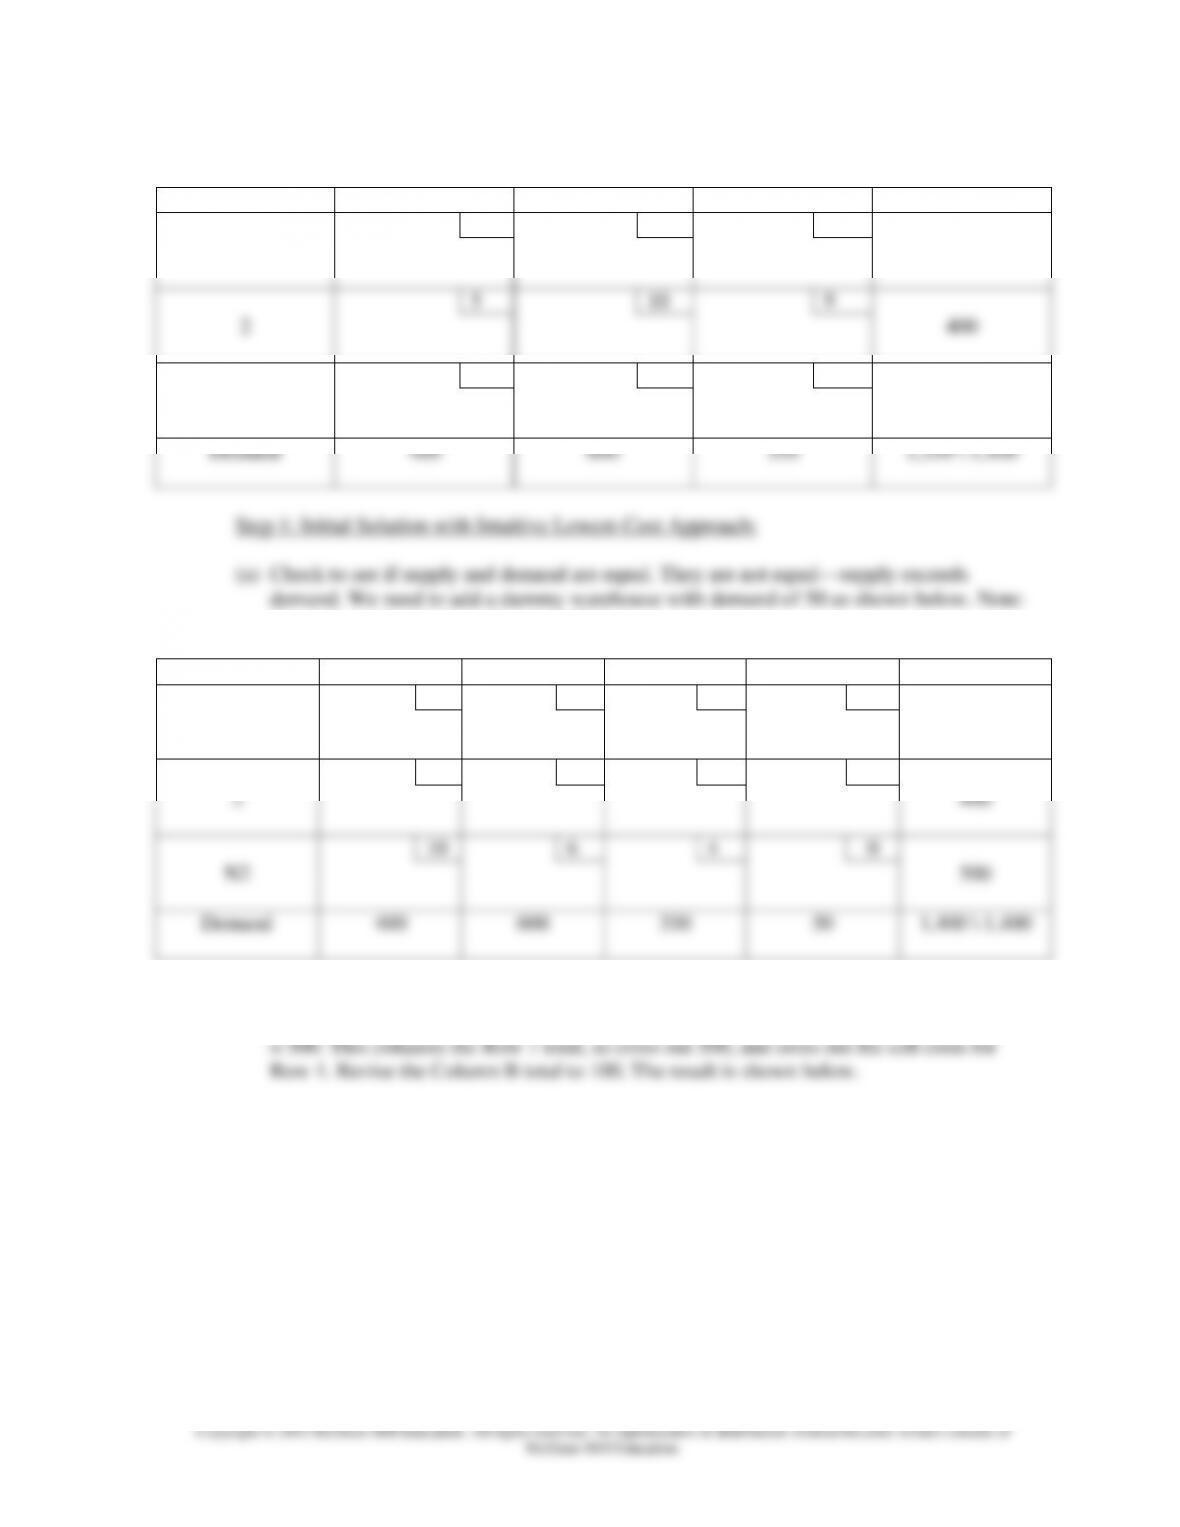
Step 1: Initial Solution with Intuitive Lowest-Cost Approach:
(a) Check to see if supply and demand are equal. They are not equal—supply exceeds
demand. We need to add a dummy warehouse with demand of 50 as shown below. Note:
We make assignments to dummy cells last.
From:
To:
A
B
C
Dummy
Supply
8
3
7
0
1
500
5
10
9
0
2
400
10
6
4
0
N2
500
Demand
400
600
350
50
1,400 \ 1,400
(b) Find the cell in the table above that has the lowest unit transportation cost. Cell 1-B has
the lowest cost ($3). Assign as many units as possible to this cell: minimum of 500 & 600
Chapter 08S – The Transportation Model
8S-18
From:
To:
A
B
C
Dummy
Supply
8
3
7
0
1
500
500
5
10
9
0
2
400
10
6
4
0
N2
500
Demand
400
600 100
350
50
1,400 \ 1,400
possible to this cell: minimum of 500 & 350 = 350. This exhausts the Column C total, so
cross out 350, and cross out the cell costs for Column C. Revise the Row N2 total to 150.
The result is shown below.
From:
To:
A
B
C
Dummy
Supply
8
3
7
0
1
500
500
5
10
9
0
2
400
10
6
4
0
N2
350
500 150
Demand
400
600 100
350
50
1,400 \ 1,400
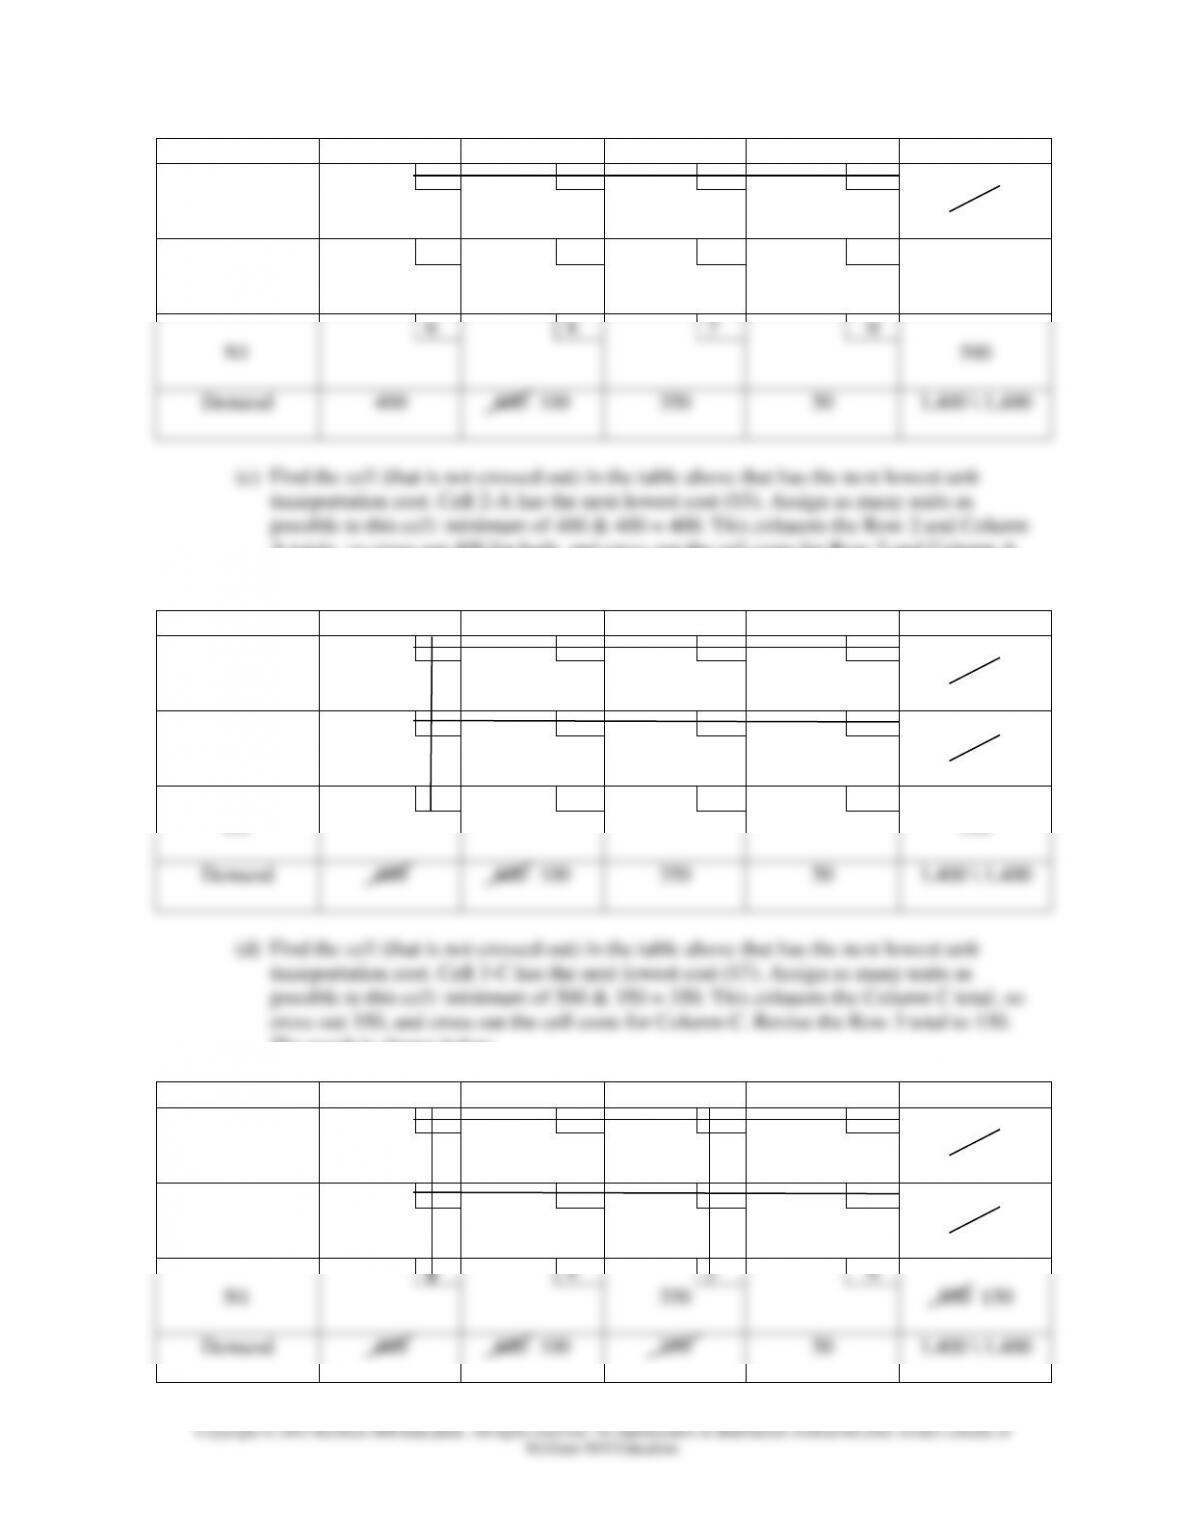
(d) Find the cell (that is not crossed out) in the table above that has the next lowest unit
transportation cost. Cell 2-A has the next lowest cost ($5). Assign as many units as
8S–19
From:
To:
A
B
C
Dummy
Supply
8
3
7
0
1
500
500
5
10
9
0
2
400
400
10
6
4
0
N2
350
500 150
Demand
400
600 100
350
50
1,400 \ 1,400
possible to this cell: minimum of 150 & 100 = 100. This exhausts the Column B total, so
cross out 100, and cross out the cell costs for Column B. Revise the Row N2 total to 50.
The result is shown below.
From:
To:
A
B
C
Dummy
Supply
8
3
7
0
1
500
500
5
10
9
0
2
400
400
10
6
4
0
N2
100
350
500 150
50
Demand
400
600 100
350
50
1,400 \ 1,400
(f) Assign the extra 50 units of supply from Row N2 to N2-Dummy. The initial solution is
shown below:
From:
To:
A
B
C
Dummy
Supply
8
3
7
0
1
500
500
5
10
9
0
2
400
400
10
6
4
0
N2
100
350
50
500
Demand
400
600
350
50
1,400 \ 1,400
Total cost = (500 x 3) + (400 x 5) + (100 x 6) + (350 x 4) = $5,500.