Chapter 08S – The Transportation Model
8S–131
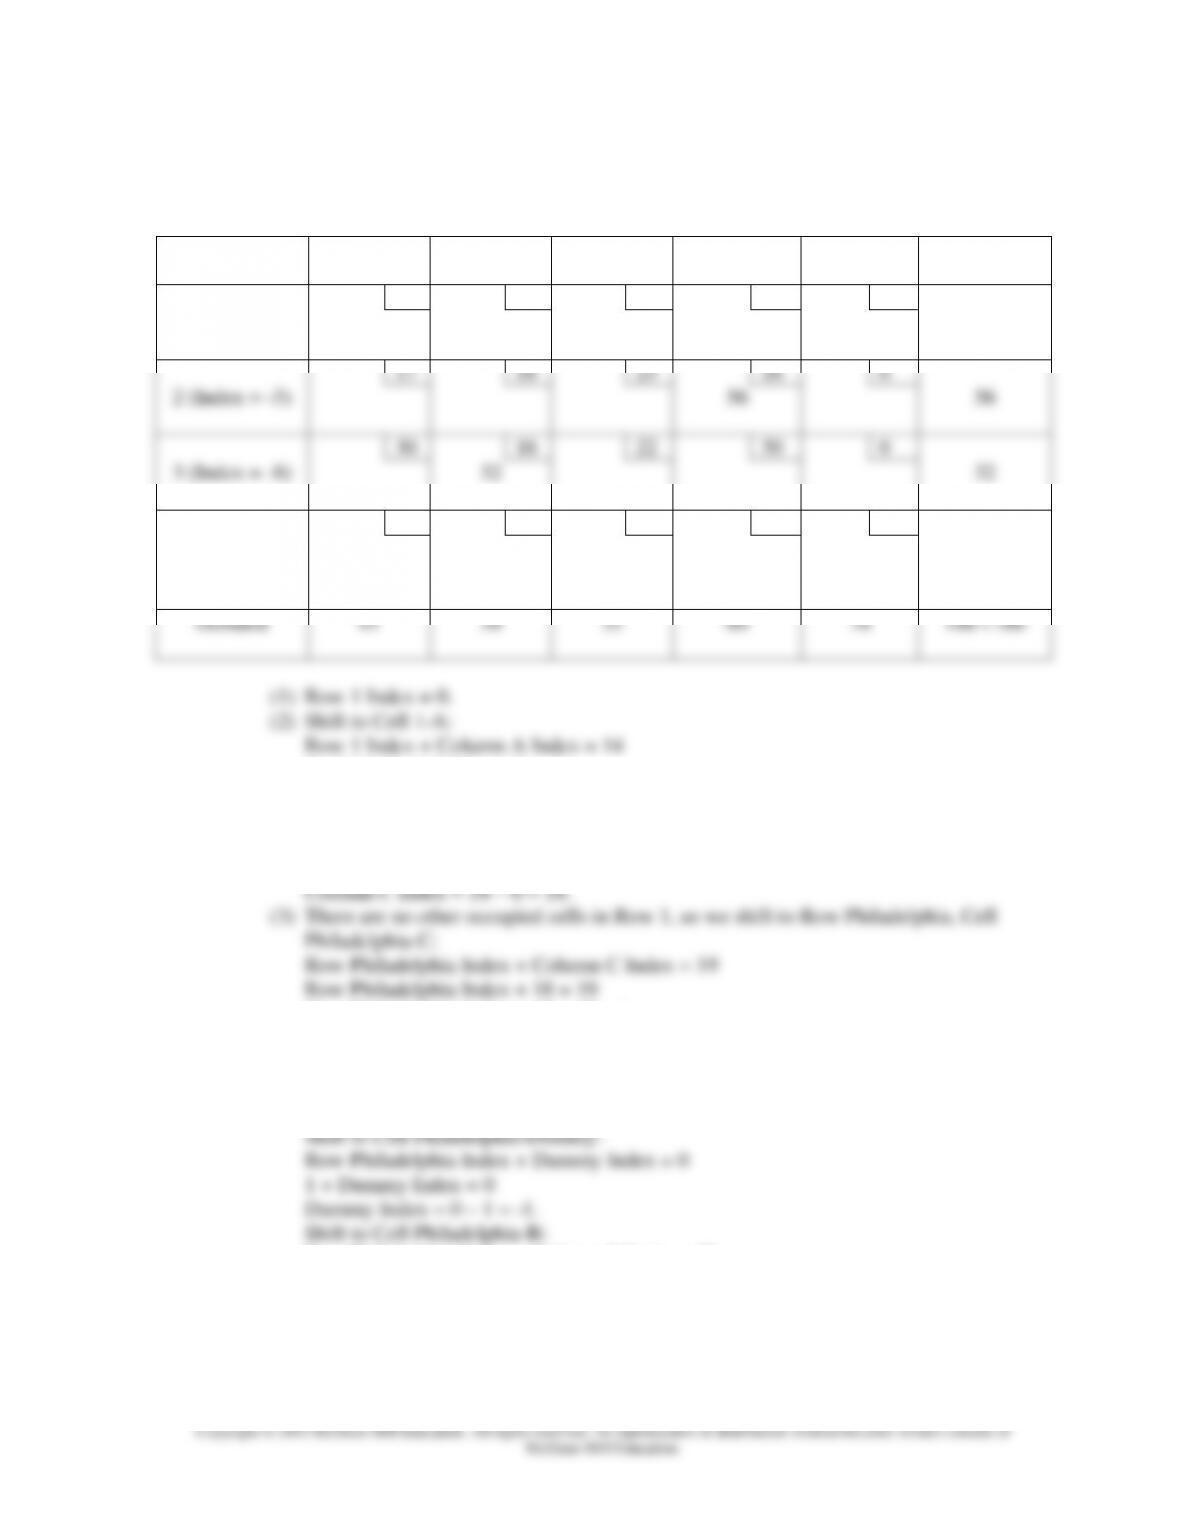
(b) Obtain an index number of each row and column. Do this using only occupied cells. Index
for Row 1 = 0. For other rows and columns, the following holds true:
Row Index + Column Index = Cell Cost
From:
To:
A
(Index = 14)
B
(Index = 24)
C
(Index = 18)
D
(Index = 19)
Dummy
(Index = –1)
Supply
14
24
18
28
0
1 (Index = 0)
41
7
48
17
18
25
16
0
2 (Index = –3)
56
56
30
16
22
30
0
3 (Index = –8)
32
32
31
25
19
20
0
Philadelphia
(Index = 1)
2
28
4
16
50
Demand
41
34
35
60
16
186 \ 186
0 + Column A Index = 14
Column A Index = 14 – 0 = 14.
Shift to Cell 1-C:
Row 1 Index + Column C Index = 18
0 + Column C Index = 18
Row Philadelphia Index = 19 – 18 = 1.
Shift to Cell Philadelphia-D:
Row Philadelphia Index + Column D Index = 20
1 + Column D Index = 20
Column D Index = 20 – 1 = 19.
Row Philadelphia Index + Column B Index = 25
1 + Column B Index = 25
Column B Index = 25 – 1 = 24.
Row 3 Index = 16 – 24 = -8.
(5) There are no other occupied cells in Row 3, so shift from Cell Philadelphia-D to Row
2, Cell 2-D:
Row 2 Index + Column D Index = 16
Row 2 Index + 19 = 16
8S–133
Copyright © 2015 McGraw-Hill Education. All rights reserved. No reproduction or distribution without the prior written consent of
McGraw-Hill Education.
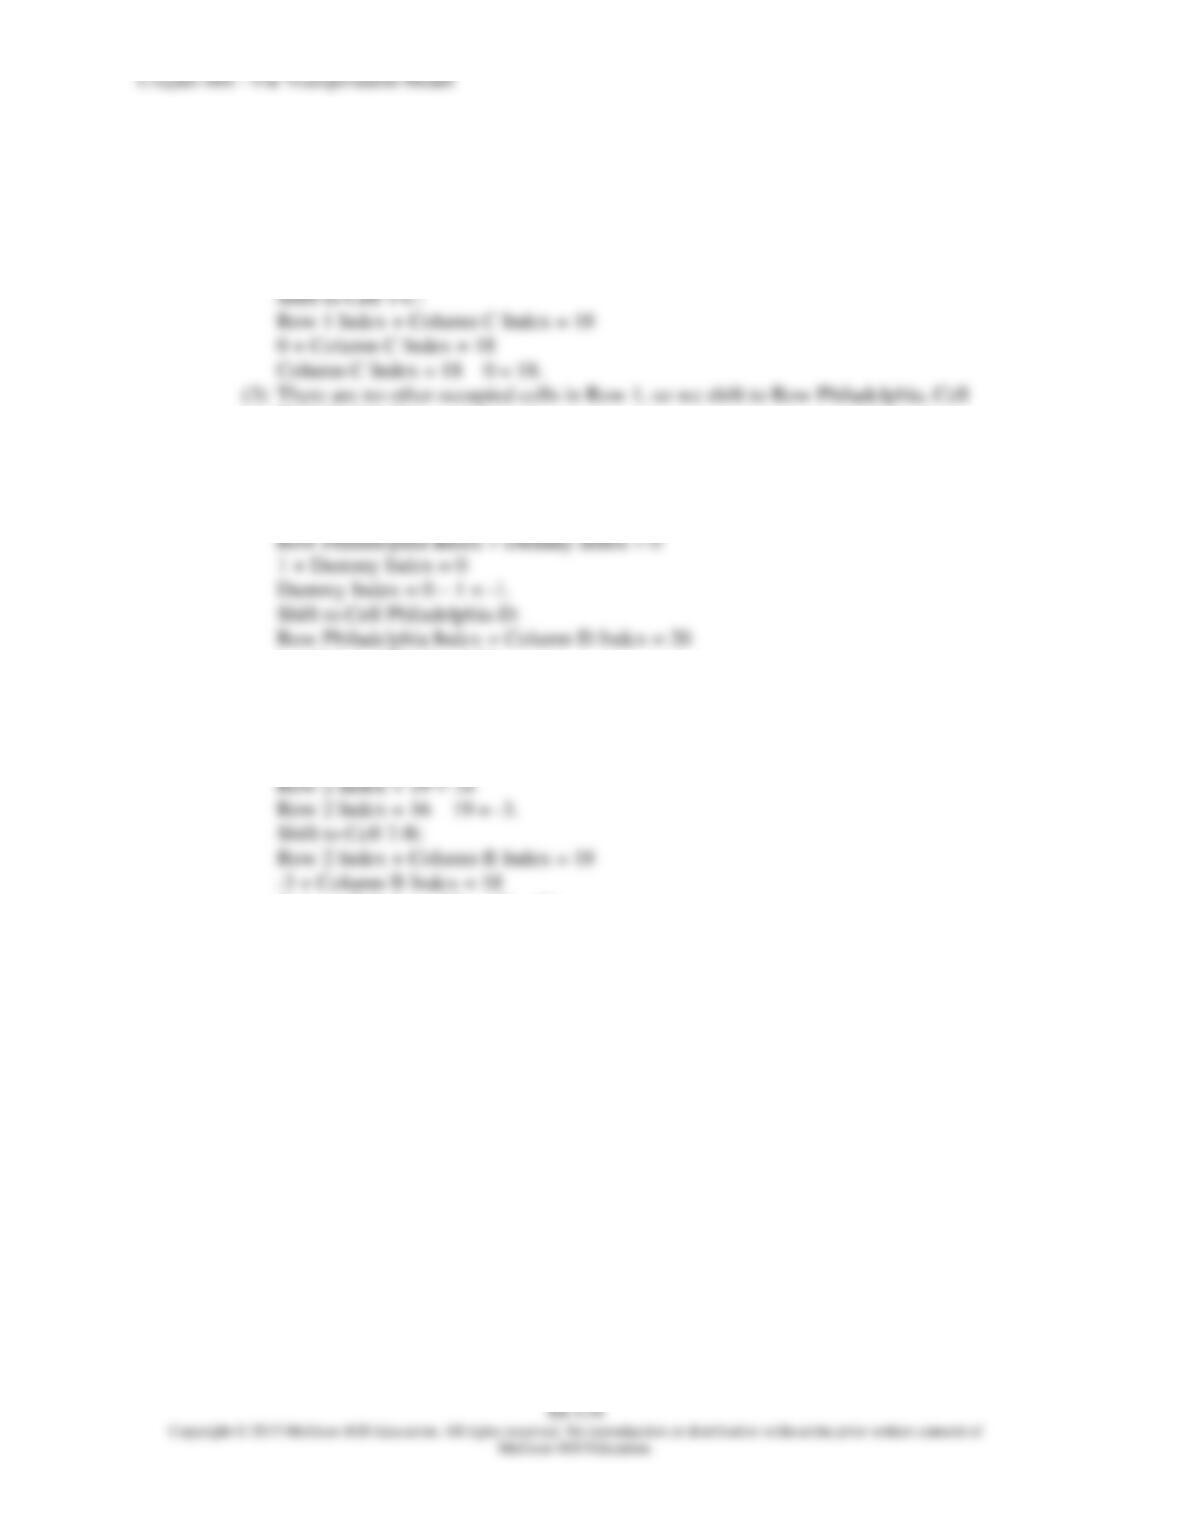
2-D has 56 units and Cell Philadelphia-B has 2 units. Therefore, 2 units can be shifted.
The result is shown below.
From:
To:
A
B
C
D
Dummy
Supply
14
24
18
28
0
1
41
7
48
17
18
25
16
0
2
2
54
56
30
16
22
30
0
3
32
32
31
25
19
20
0
Philadelphia
28
6
16
50
Demand
41
34
35
60
16
186 \ 186
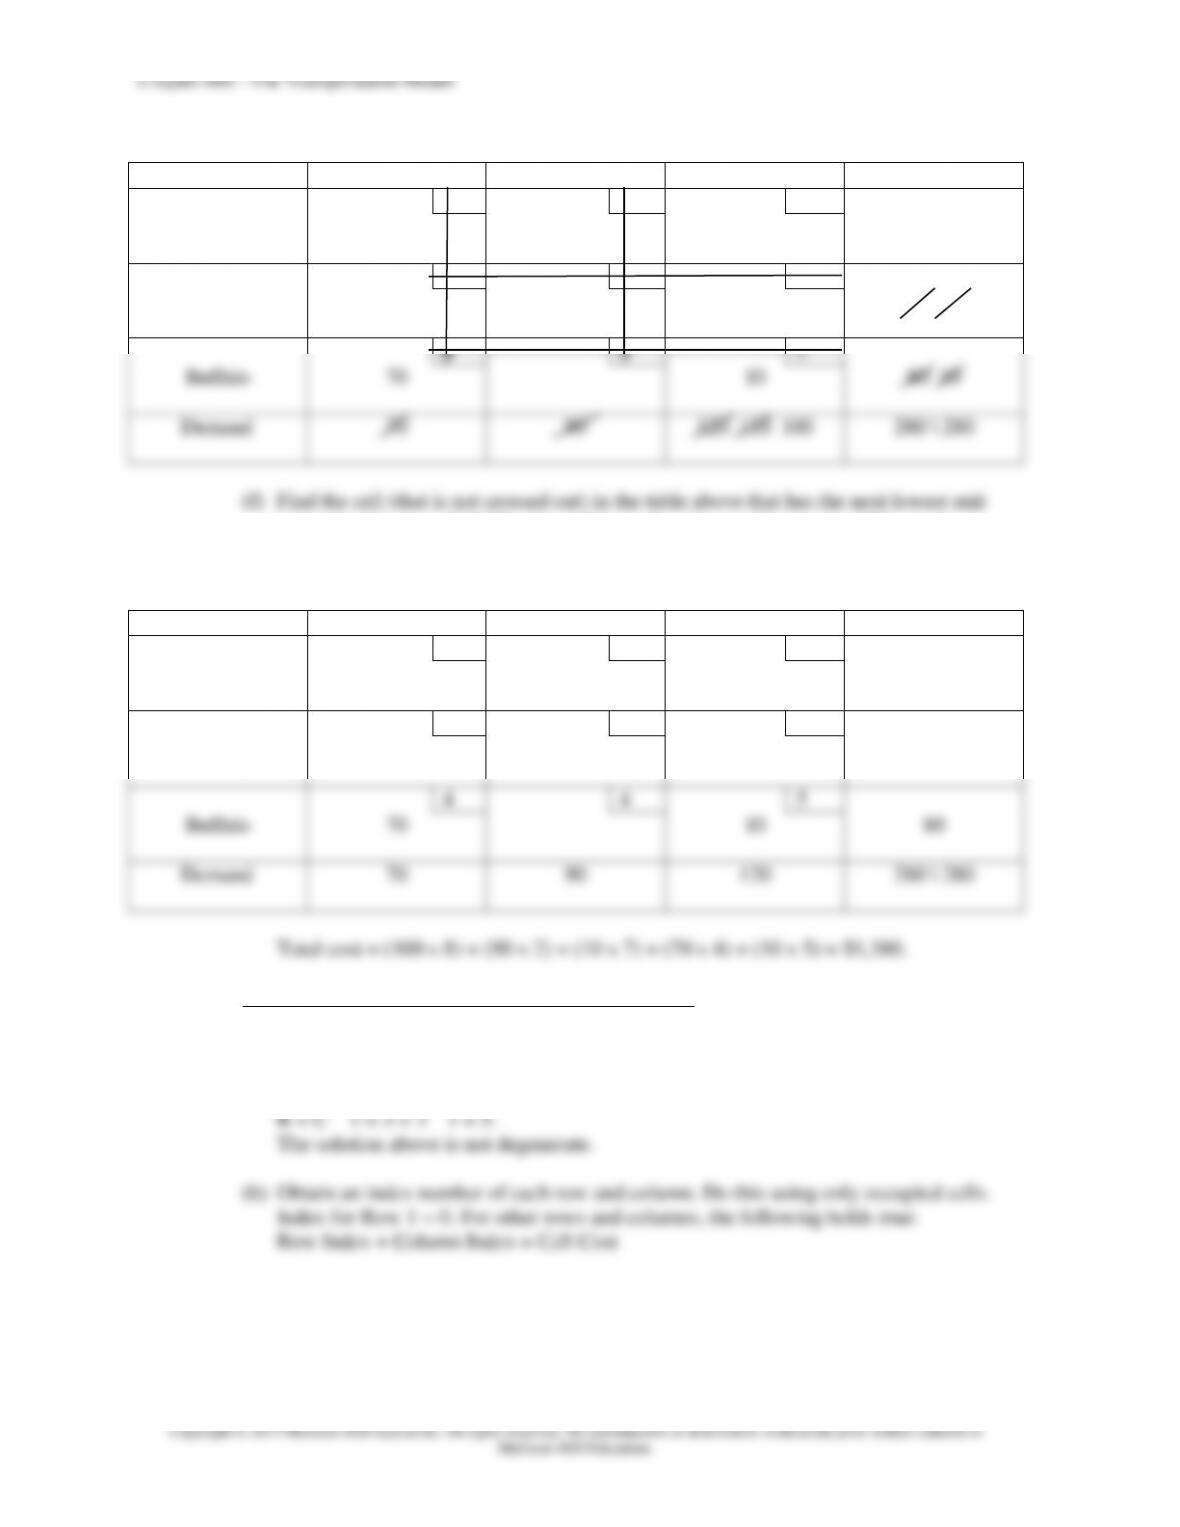
Total cost = (41 x 14) + (7 x 18) + (2 x 18) + (54 x 16) + (32 x 16) + (28 x 19) + (6 x 20)
= $2,764.
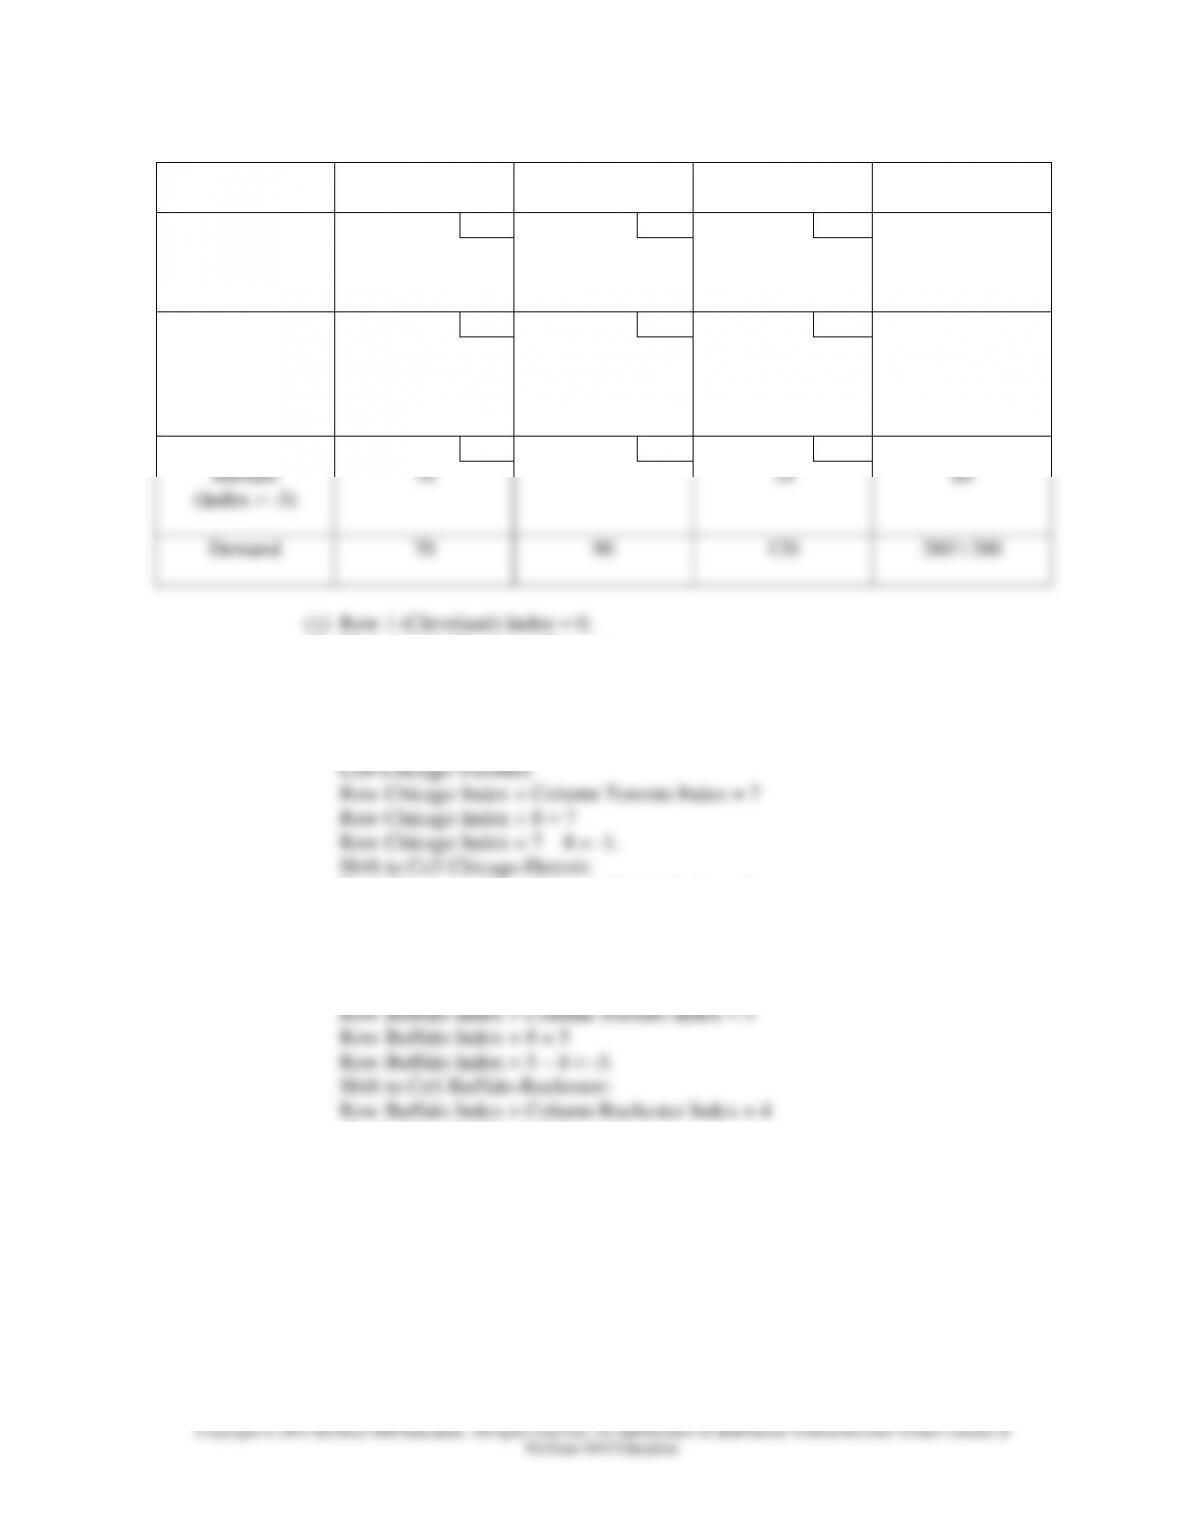
(e) Obtain an index number of each row and column. Do this using only occupied cells. Index
for Row 1 = 0. For other rows and columns, the following holds true:
Row Index + Column Index = Cell Cost
From:
To:
A
(Index = 14)
B
(Index = 21)
C
(Index = 18)
D
(Index = 19)
Dummy
(Index = -1)
Supply
14
24
18
28
0
1 (Index = 0)
41
7
48
17
18
25
16
0
2 (Index = –3)
2
54
56
30
16
22
30
0
3 (Index = –5)
32
32
31
25
19
20
0
Philadelphia
(Index = 1)
28
6
16
50
Demand
41
34
35
60
16
186 \ 186
8S–135
Copyright © 2015 McGraw-Hill Education. All rights reserved. No reproduction or distribution without the prior written consent of
McGraw-Hill Education.
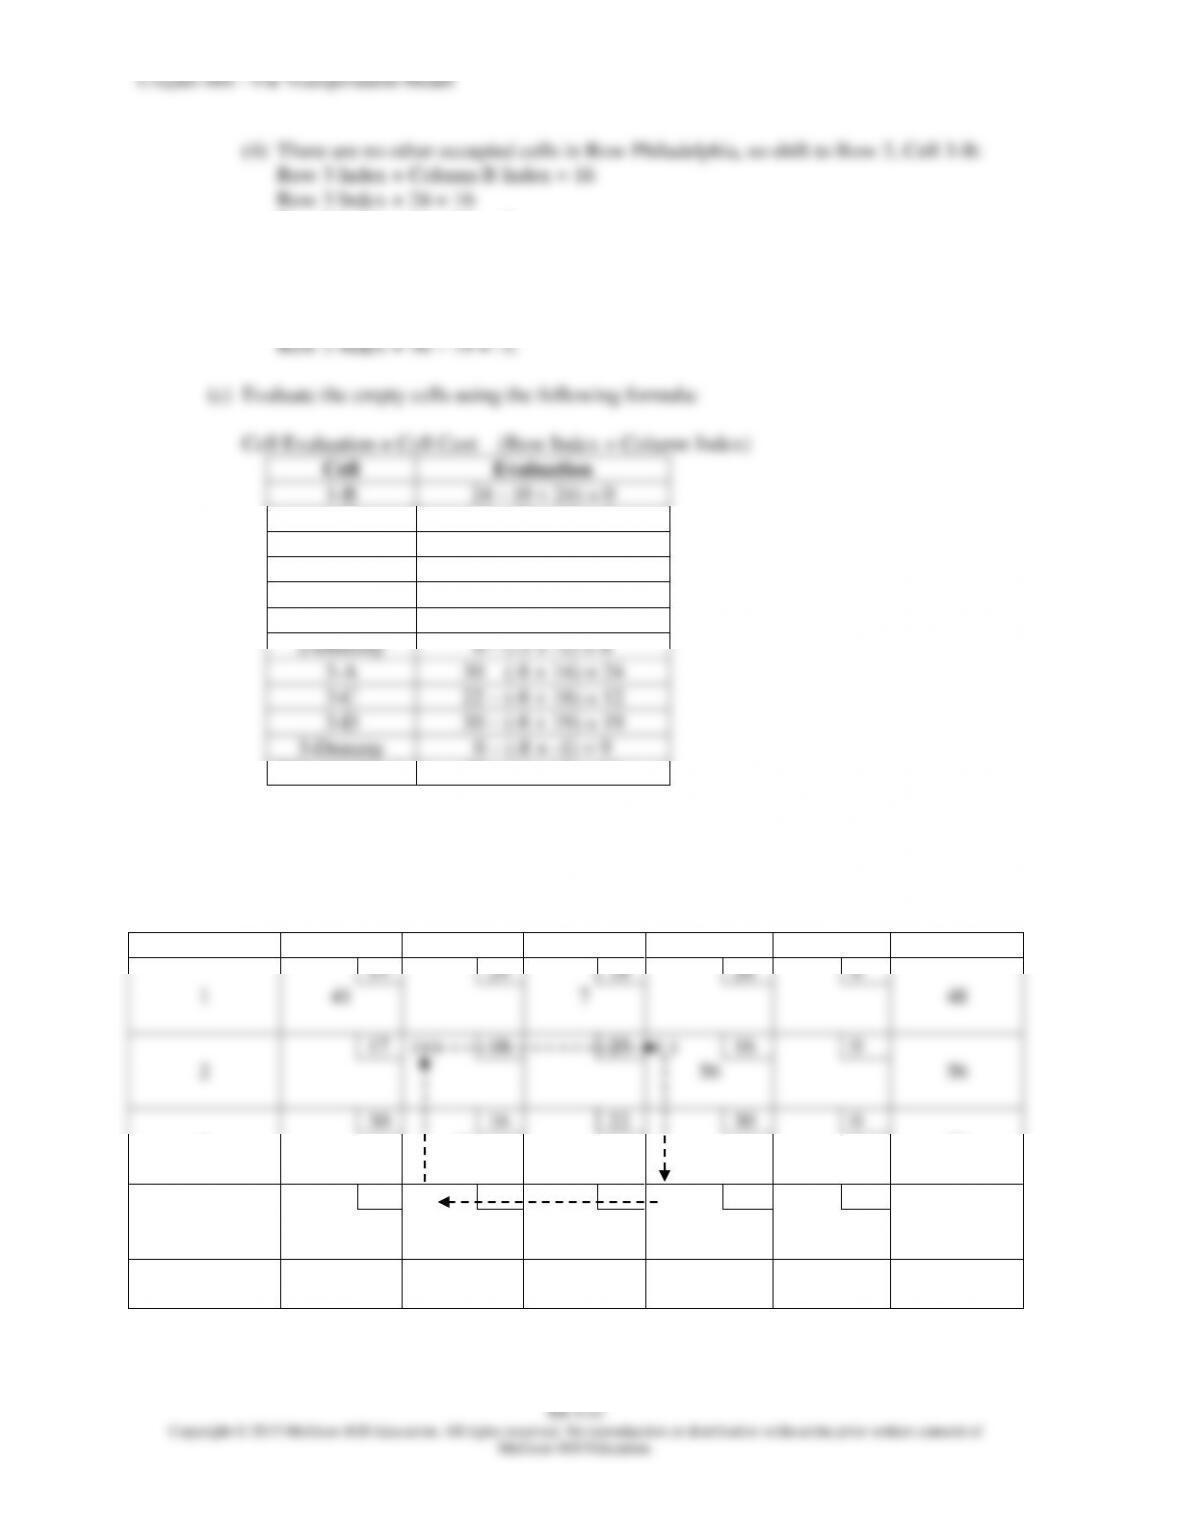
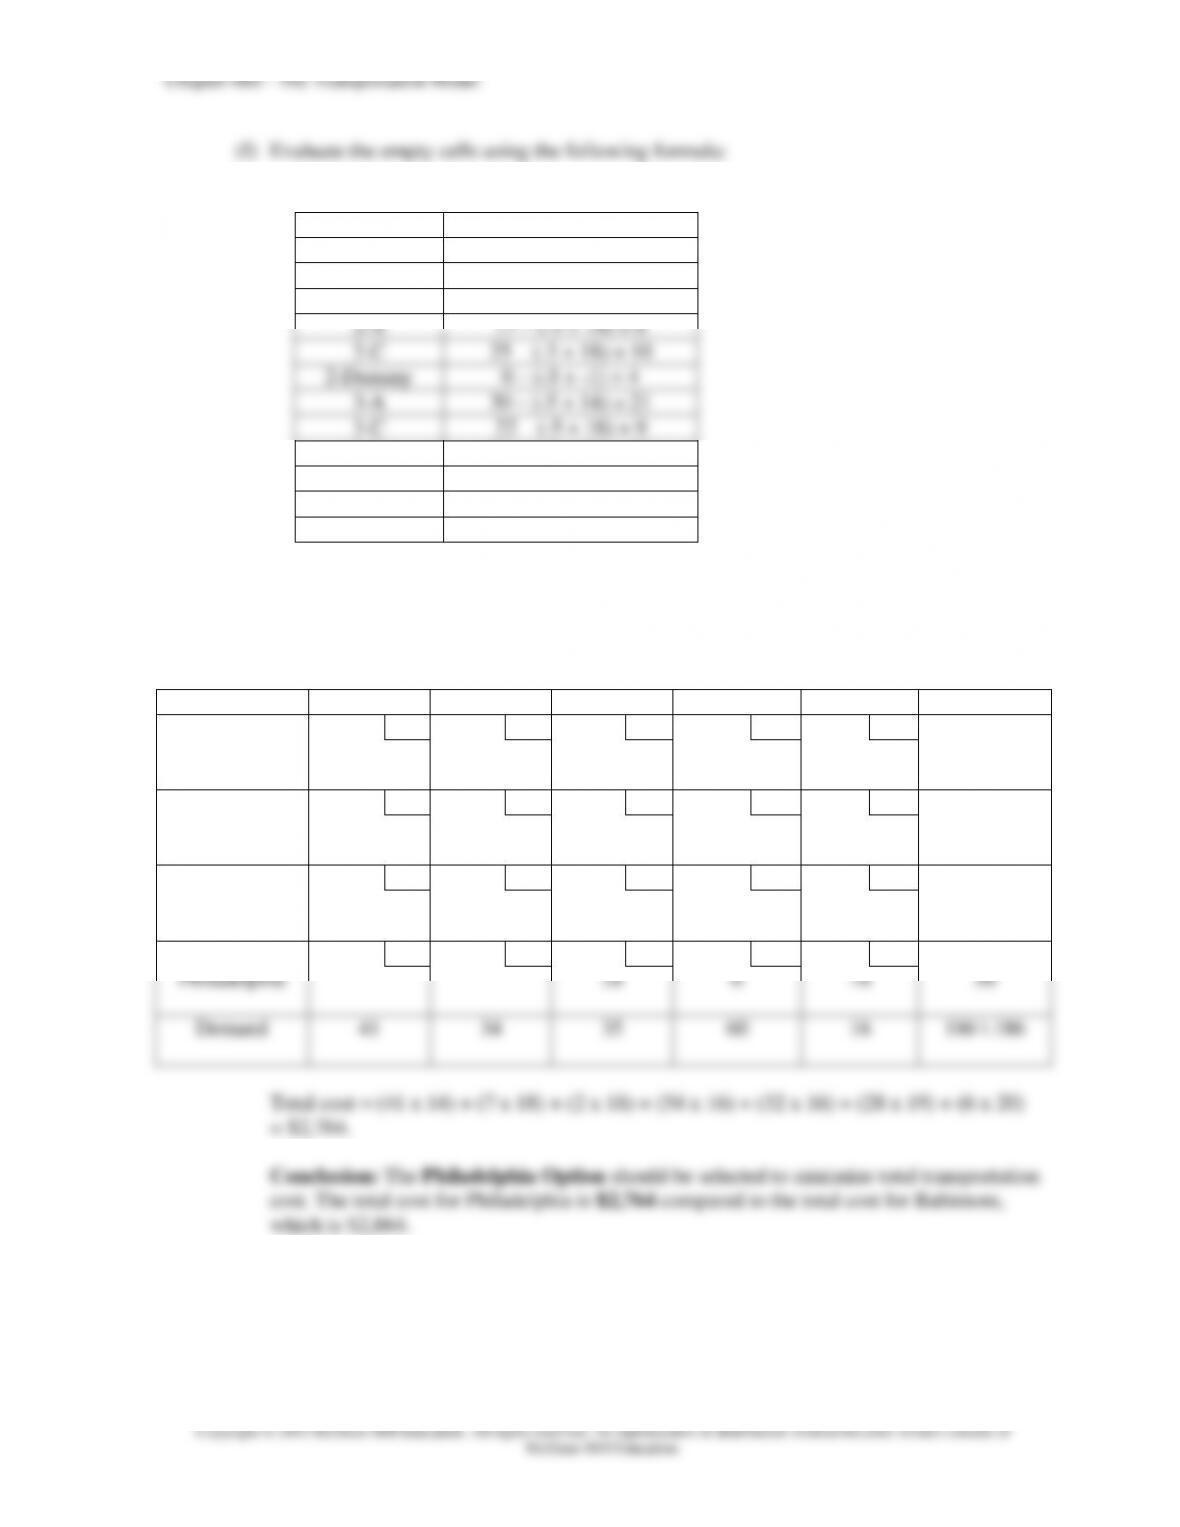
(f) Evaluate the empty cells using the following formula:
Cell Evaluation = Cell Cost – (Row Index + Column Index)
Cell
Evaluation
1-B
24 – (0 + 21) = 3
1-D
28 – (0 + 19) = 9
1-Dummy
0 – (0 + -1) = 1
2-A
17 – (-3 + 14) = 6
2-C
25 – (-3 + 18) = 10
2-Dummy
0 – (-3 + –1) = 4
3-A
30 – (-5 + 14) = 21
3-C
22 – (-5 + 18) = 9
3-D
30 – (-5 + 19) = 16
3-Dummy
0 – (-5 + –1) = 6
Philadelphia-A
31 – (1 + 14) = 16
Philadelphia-B
25 – (1 + 21) = 3
Because no cell evaluations are negative, we have found the optimal solution for
Philadelphia (repeated below):
Philadelphia Option
From:
To:
A
B
C
D
Dummy
Supply
14
24
18
28
0
1
41
7
48
17
18
25
16
0
2
2
54
56
30
16
22
30
0
3
32
32
31
25
19
20
0
Philadelphia
28
6
16
50
Demand
41
34
35
60
16
186 \ 186
Chapter 08S – The Transportation Model
8S–136
11. a. Obtain the optimal distribution plan. Develop the initial solution using the intuitive
lowest-cost approach. Use MODI for cell evaluations.
Given:
From:
To:
Rochester
Detroit
Toronto
Supply
6
4
8
Cleveland
100
7
2
7
Chicago
100
4
4
5
Buffalo
80
Demand
70
90
120
280 \ 280
Step 1: Initial Solution with Intuitive Lowest-Cost Approach:
(a) Check to see if supply and demand are equal. They are equal—no dummy is
necessary.
From:
To:
Rochester
Detroit
Toronto
Supply
6
4
8
Cleveland
100
7
2
7
Chicago
90
100 10
4
4
5
Buffalo
80
Demand
70
90
120
280 \ 280
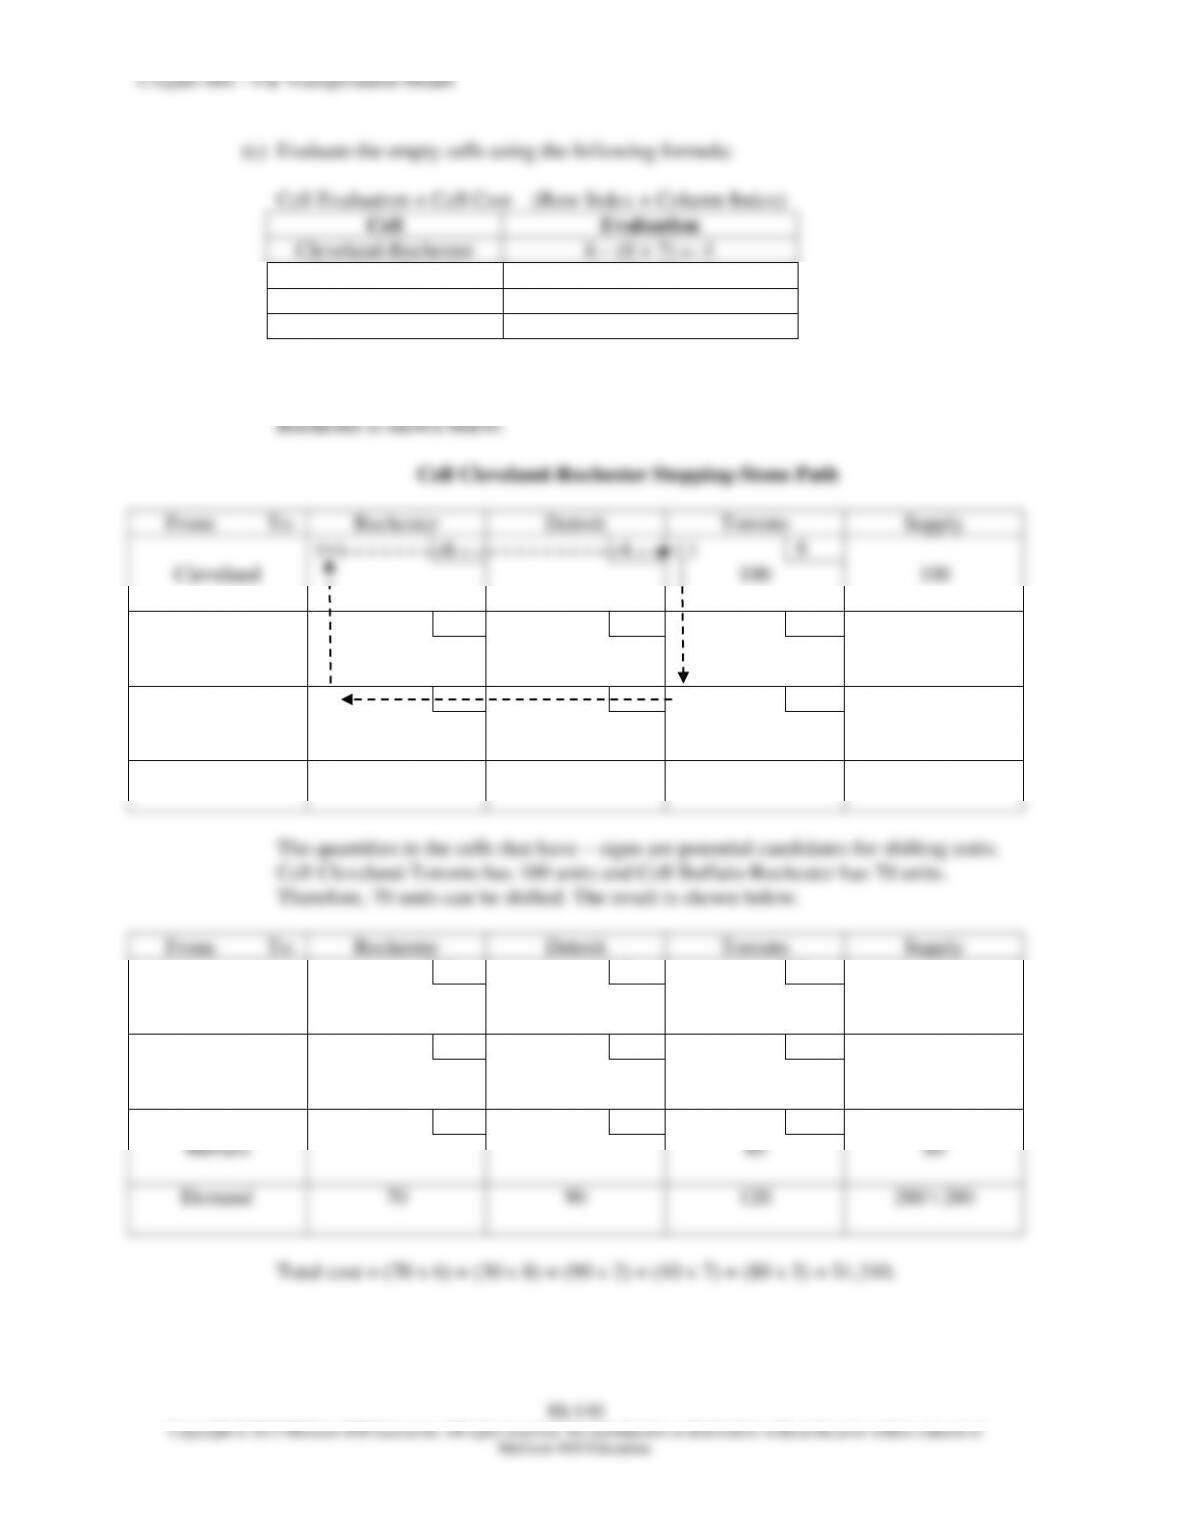
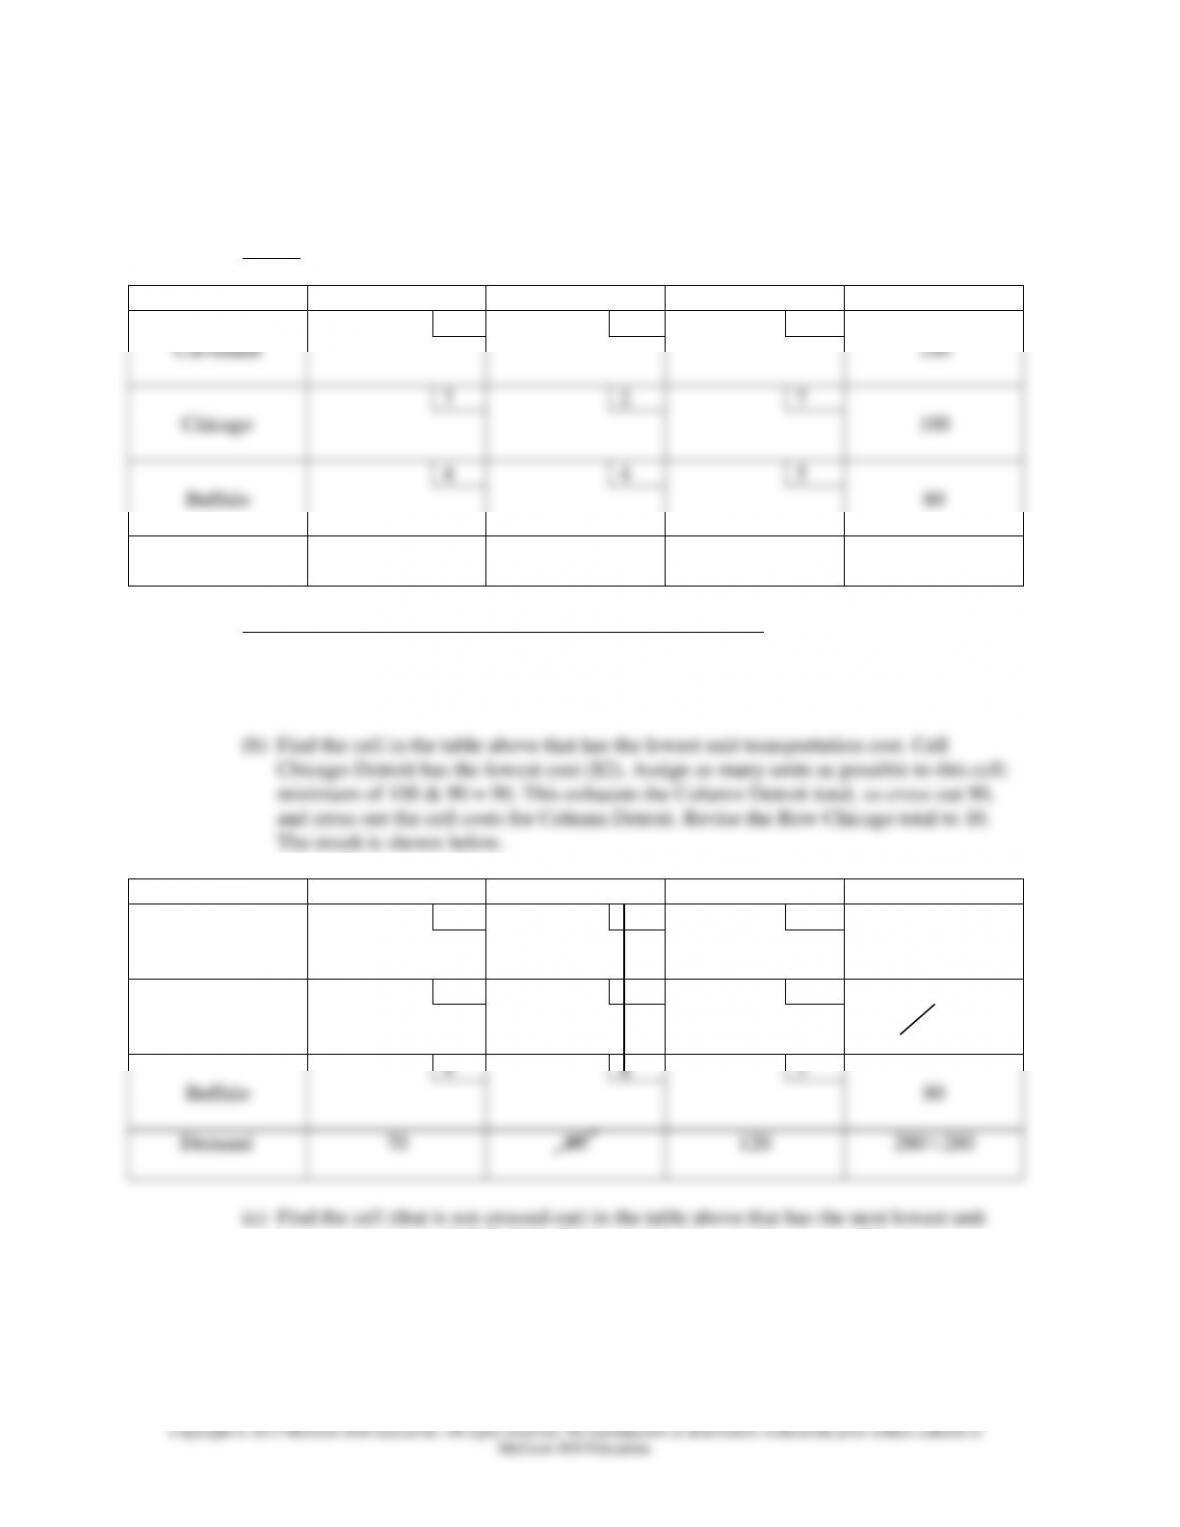
(c) Find the cell (that is not crossed out) in the table above that has the next lowest unit
transportation cost. Cell Buffalo-Rochester has the next lowest cost ($4). Assign as
many units as possible to this cell: minimum of 80 & 70 = 70. This exhausts the
Column Rochester total, so cross out 70, and cross out the cell costs for Column
Rochester. Revise the Row Buffalo total to 10. The result is shown below.
Chapter 08S – The Transportation Model
From:
To:
Rochester
Detroit
Toronto
Supply
6
4
8
Cleveland
100
7
2
7
Chicago
90
100 10
4
4
5
Buffalo
70
80 10
Demand
70
90
120
280 \ 280
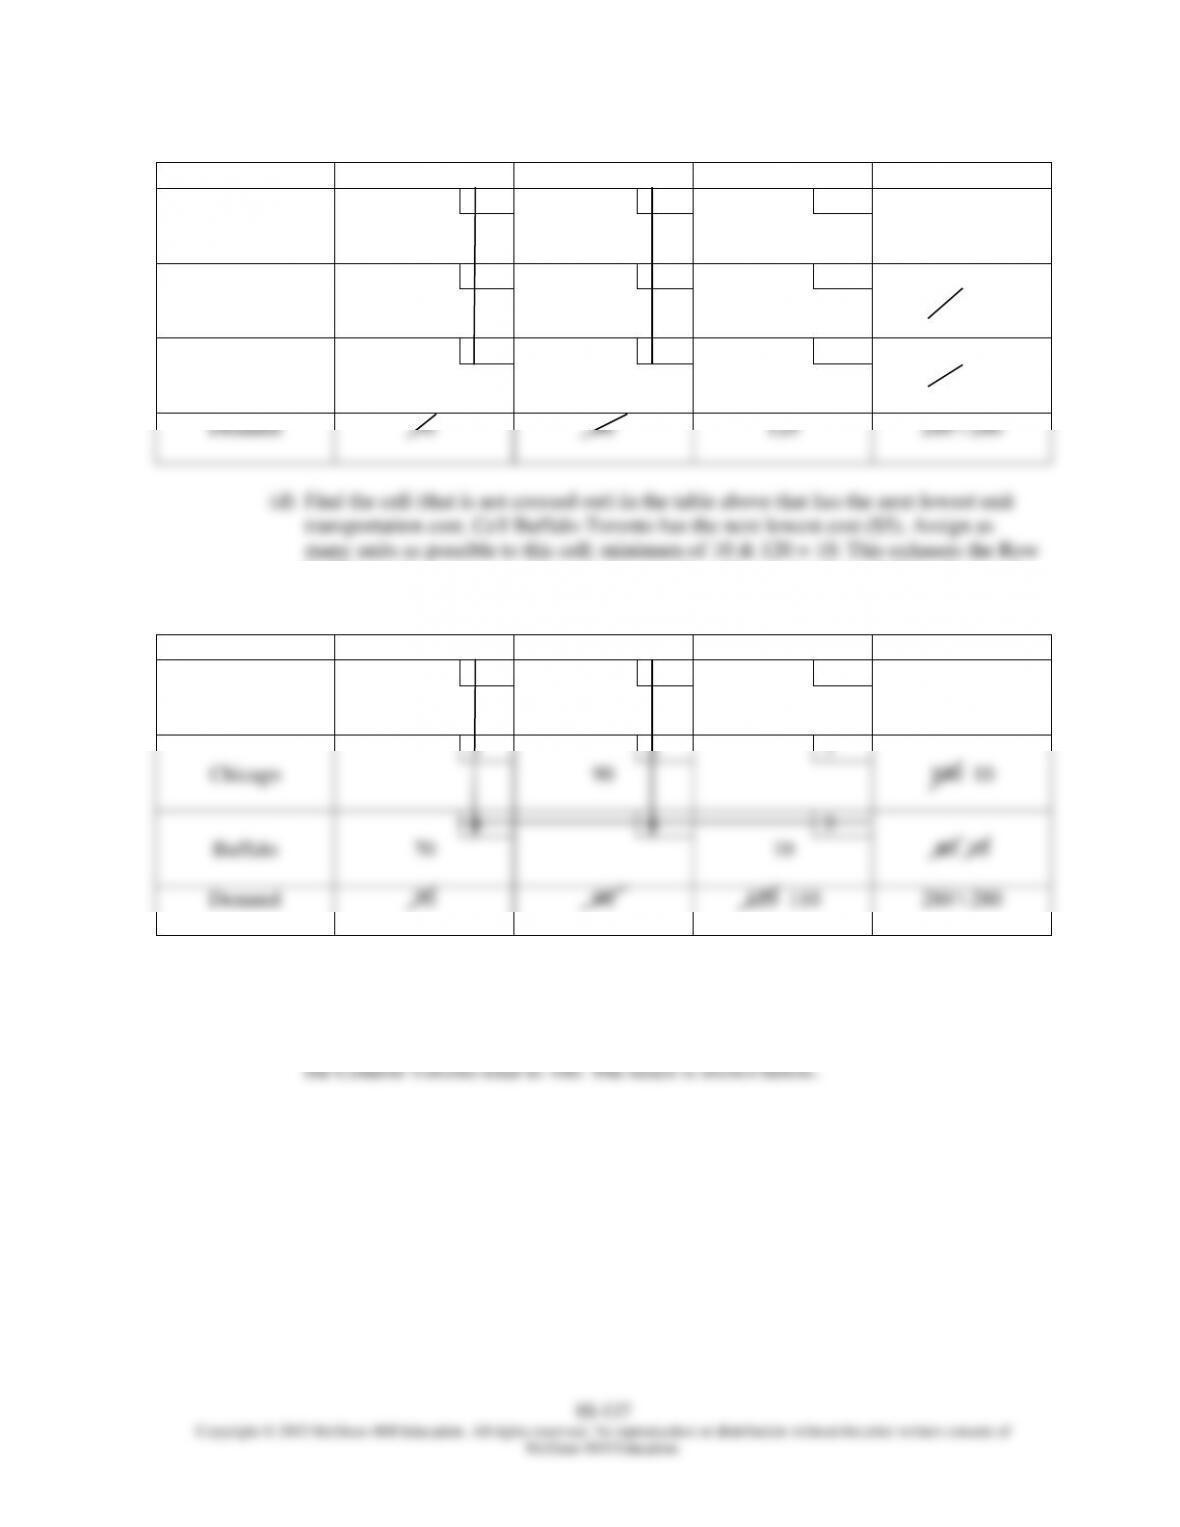
Buffalo total, so cross out 10, and cross out the cell costs for Row Buffalo. Revise the
Column Toronto total to 110. The result is shown below.
From:
To:
Rochester
Detroit
Toronto
Supply
6
4
8
Cleveland
100
7
2
7
Chicago
90
100 10
4
4
5
Buffalo
70
10
80 10
Demand
70
90
120 110
280 \ 280
(e) Find the cell (that is not crossed out) in the table above that has the next lowest unit
transportation cost. Cell Chicago-Toronto has the next lowest cost ($7). Assign as
many units as possible to this cell: minimum of 10 & 110 = 10. This exhausts the Row
Chicago total, so cross out 10, and cross out the cell costs for Row Chicago. Revise
8S–138
From:
To:
Rochester
Detroit
Toronto
Supply
6
4
8
Cleveland
100
7
2
7
Chicago
90
10
100 10
4
4
5
Buffalo
70
10
80 10
Demand
70
90
120 110 100
280 \ 280
transportation cost. Cell Cleveland-Toronto has the next lowest cost ($8). Assign as
many units as possible to this cell: minimum of 100 & 100 = 100. This exhausts the
Row Cleveland and Column Toronto totals. The initial solution is shown below.
From:
To:
Rochester
Detroit
Toronto
Supply
6
4
8
Cleveland
100
100
7
2
7
Chicago
90
10
100
4
4
5
Buffalo
70
10
80
Demand
70
90
120
280 \ 280
Step 2: Evaluate empty cells with the MODI method:
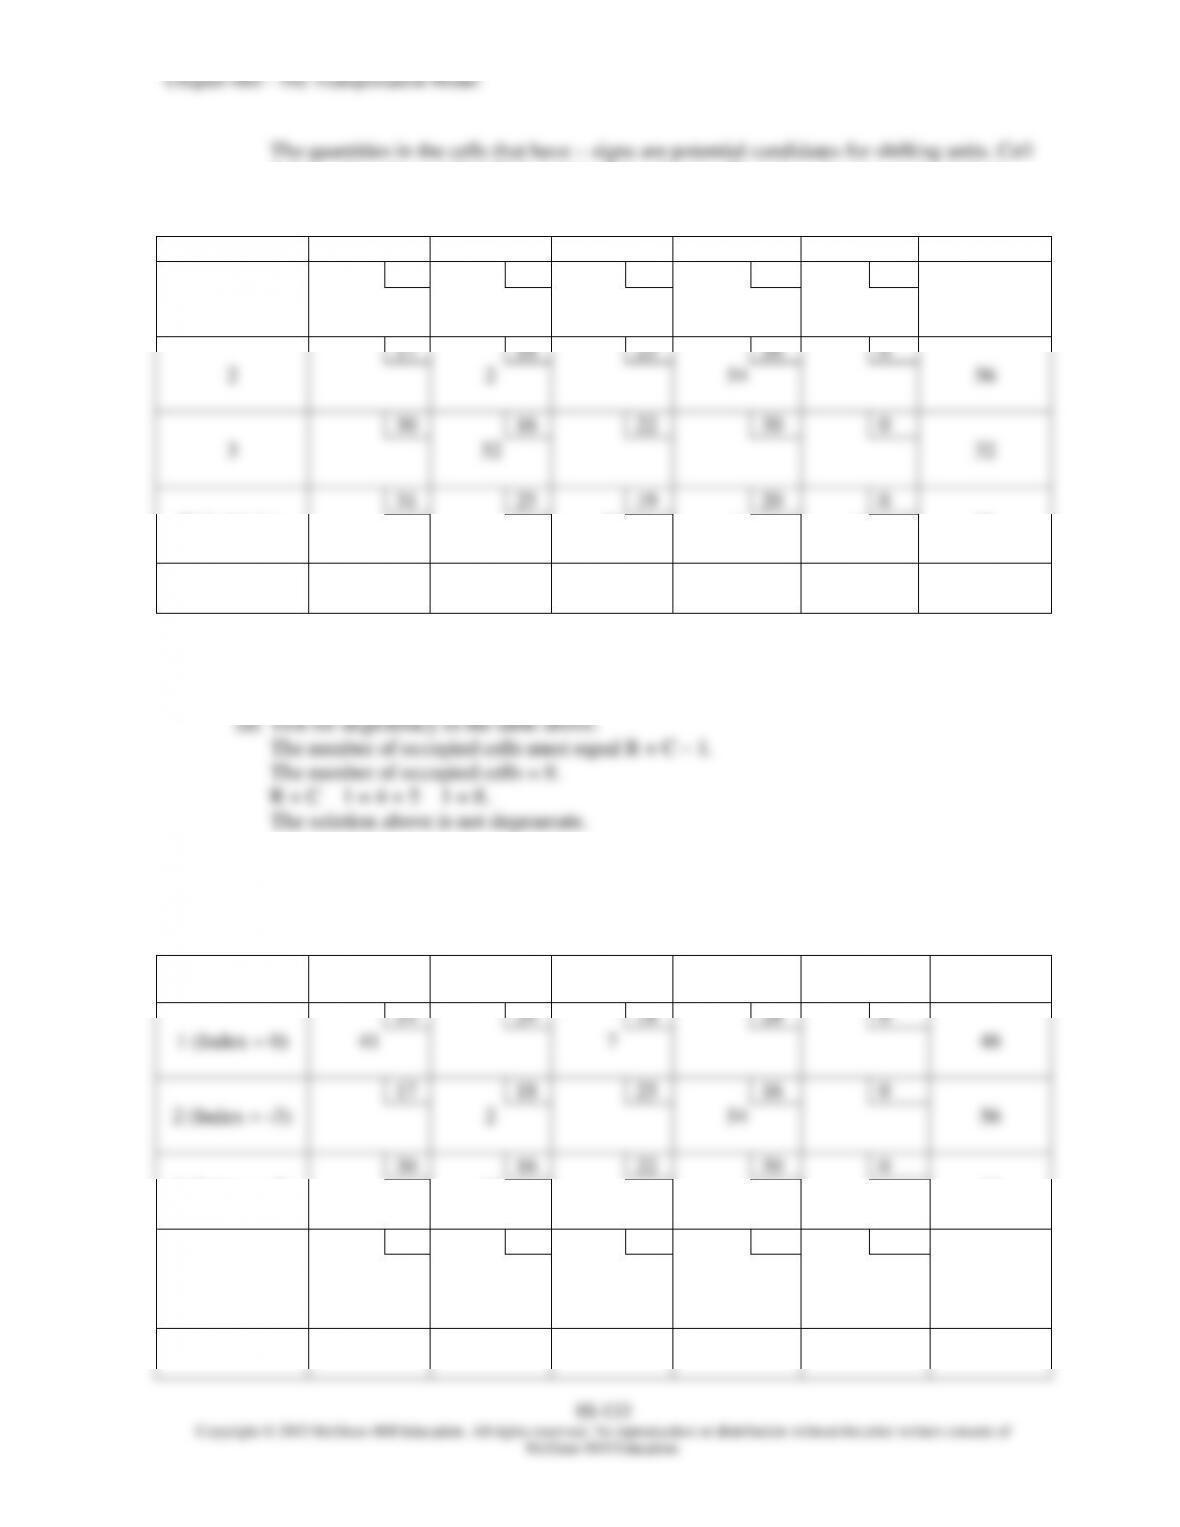
(a) Test for degeneracy in the table above.
The number of occupied cells must equal R + C – 1.
The number of occupied cells = 5.
Chapter 08S – The Transportation Model
8S–139
From:
To:
Rochester
(Index = 7)
Detroit
(Index = 3)
Toronto
(Index = 8)
Supply
6
4
8
Cleveland
(Index = 0)
100
100
7
2
7
Chicago
(Index = –1)
90
10
100
4
4
5
Buffalo
(Index = –3)
70
10
80
Demand
70
90
120
280 \ 280
(1) Row 1 (Cleveland) Index = 0.
(2) Shift to Cell Cleveland-Toronto:
Row Cleveland Index + Column Toronto Index = 8
0 + Column Toronto Index = 8
Column Toronto Index = 8 – 0 = 8.
(3) There are no other occupied cells in Row Cleveland, so we shift to Row Chicago,
Row Chicago Index + Column Detroit Index = 2
-1 + Column Detroit Index = 2
Column Detroit Index = 2 – (-1) = 3.
(4) There are no other occupied cells in Row Chicago, so we shift from Cell Chicago-
Toronto to Row Buffalo, Cell Buffalo-Toronto:
-3 + Column Rochester Index = 4
Column Rochester Index = 4 – (-3) = 7.