Unlock document.
This document is partially blurred.
Unlock all pages and 1 million more documents.
Get Access
Chapter 08S - The Transportation Model
8S-111
(4) We use the Row 2 Index to determine the Column D Index, the Dummy Index, and
the Column B Index:
Shift to Column D, Cell 2-D:
Row 2 Index + Column D Index = 16
Dummy Index = 0 – 3 = -3.
Shift to Column B, Cell 2-B:
Row 2 Index + Column B Index = 18
3 + Column B Index = 18
Column B Index = 18 – 3 = 15.
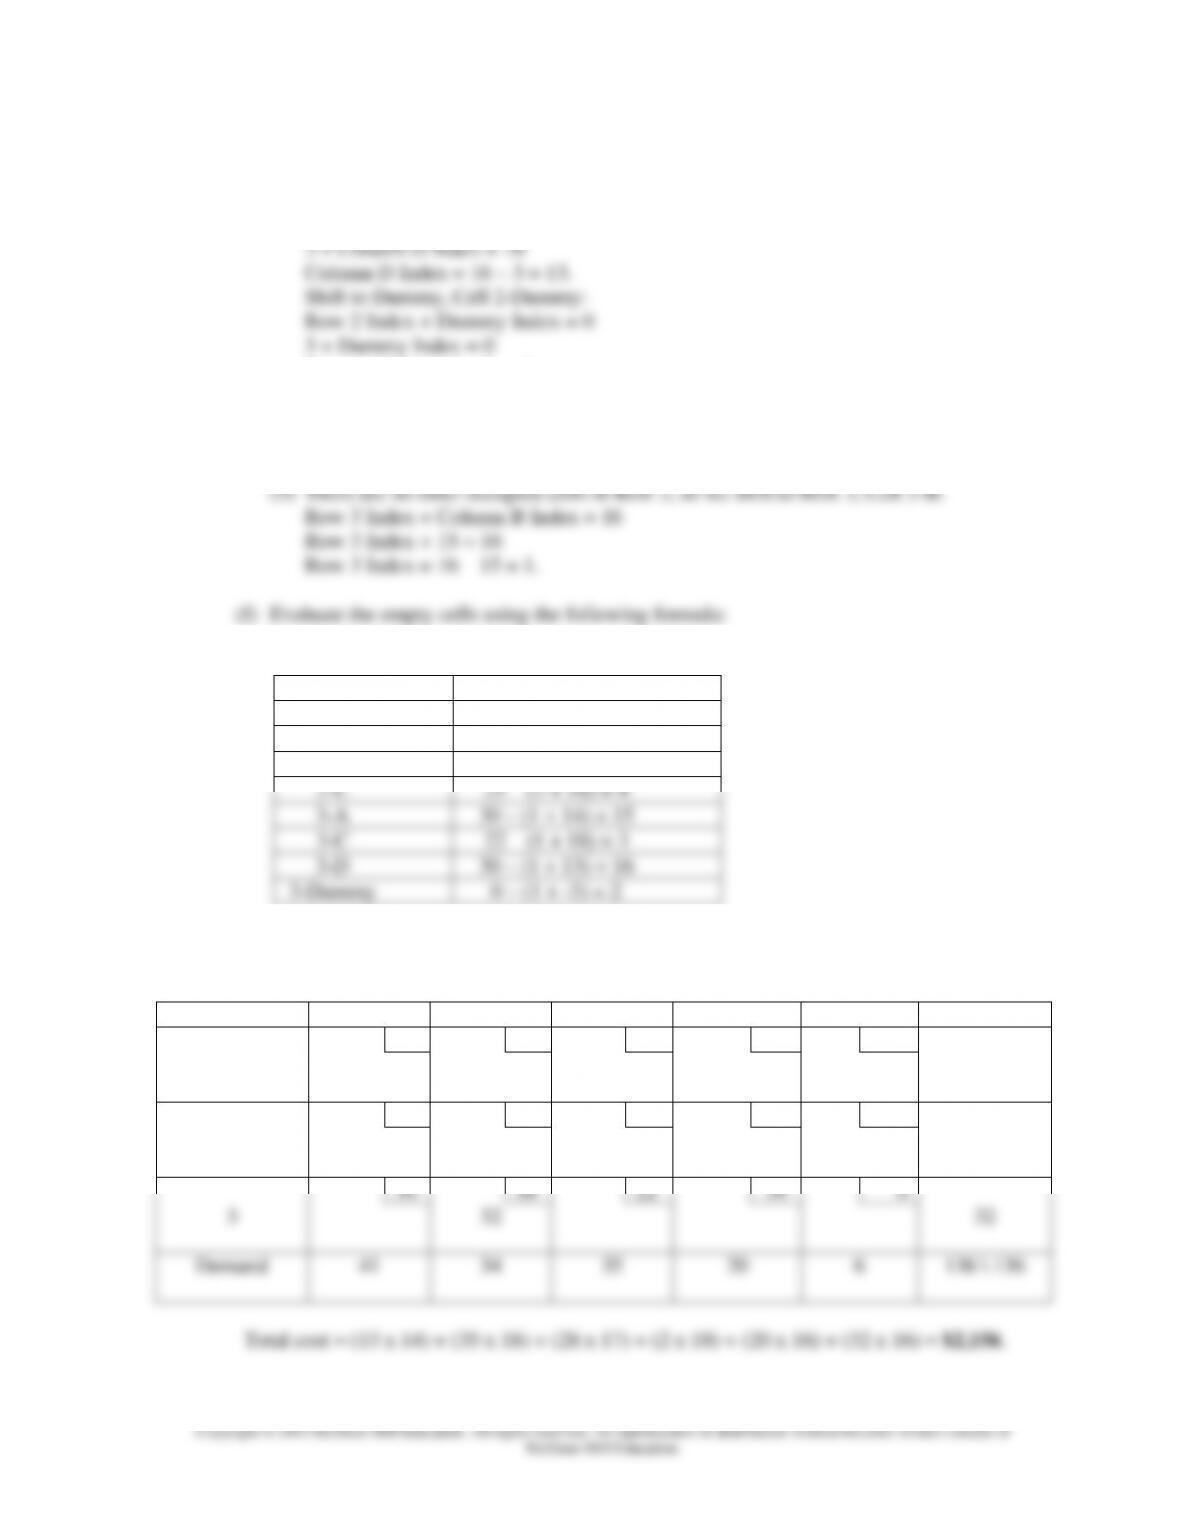
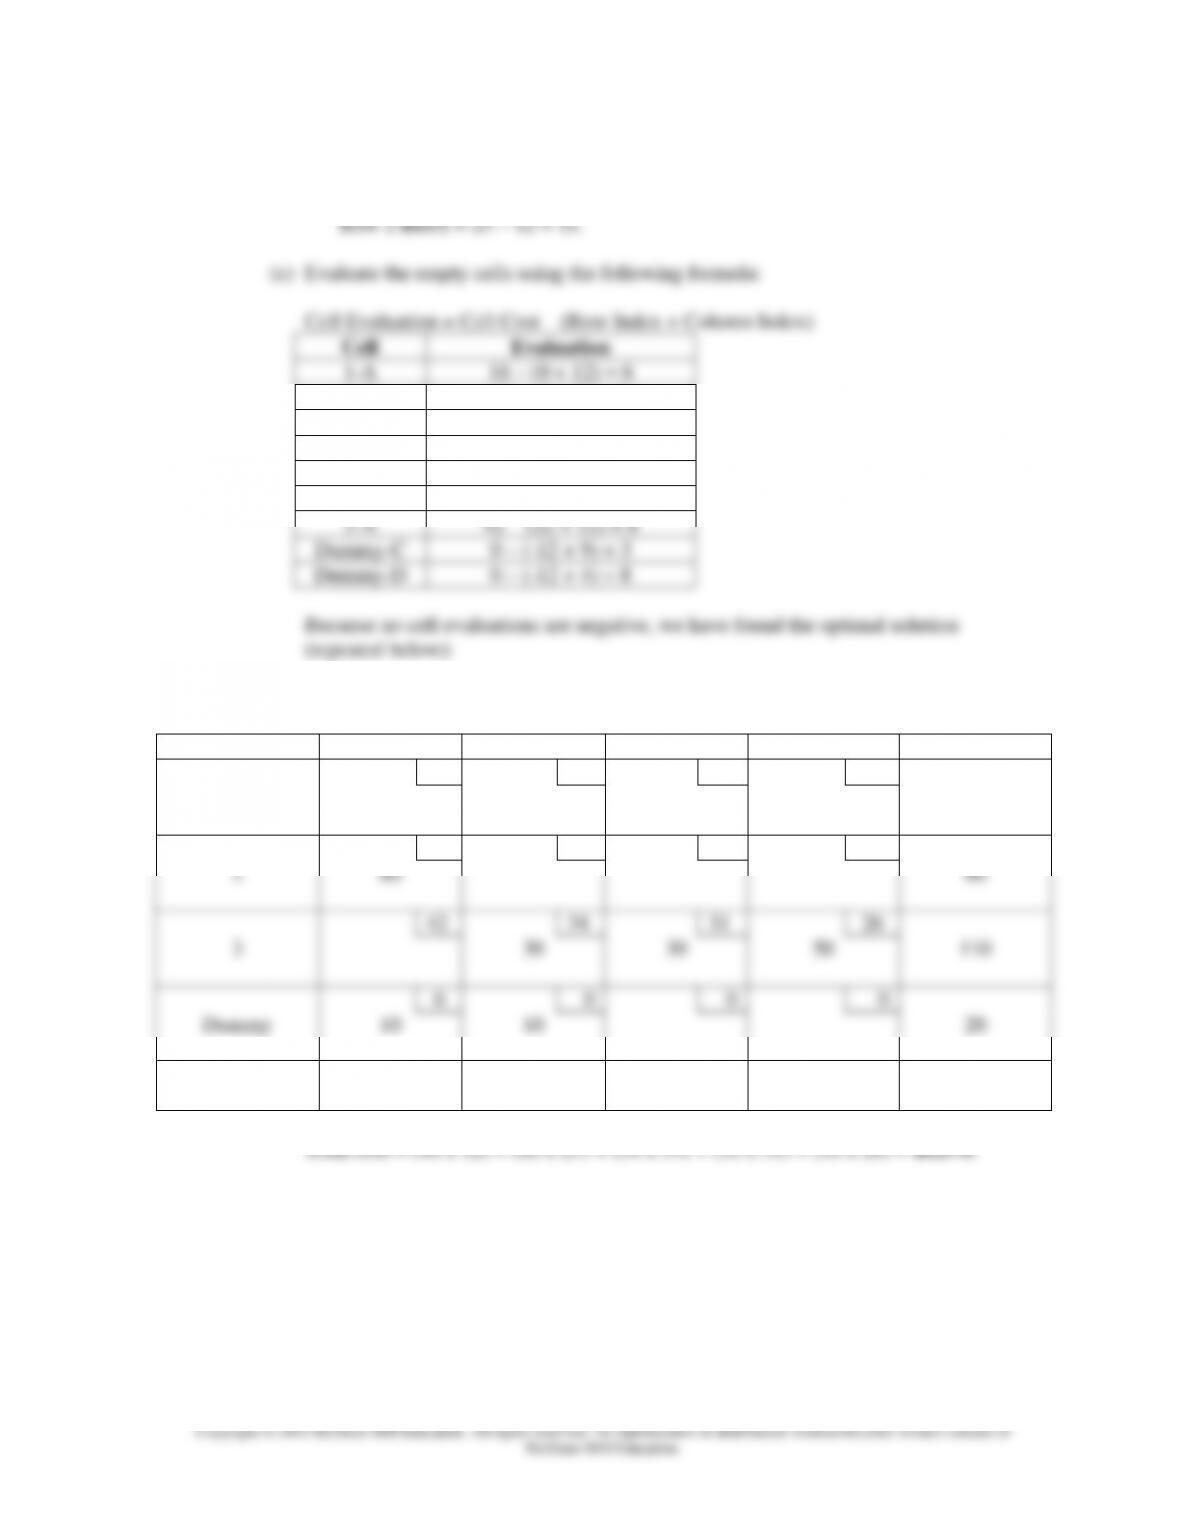
Cell Evaluation = Cell Cost – (Row Index + Column Index)
Cell
Evaluation
1-B
24 – (0 + 15) = 9
1-D
28 – (0 + 13) = 15
1-Dummy
0 – (0 + -3) = 3
2-C
25 – (3 + 18) = 4
3-A
30 – (1 + 14) = 15
3-C
22 – (1 + 18) = 3
3-D
30 – (1 + 13) = 16
3-Dummy
0 – (1 + -3) = 2
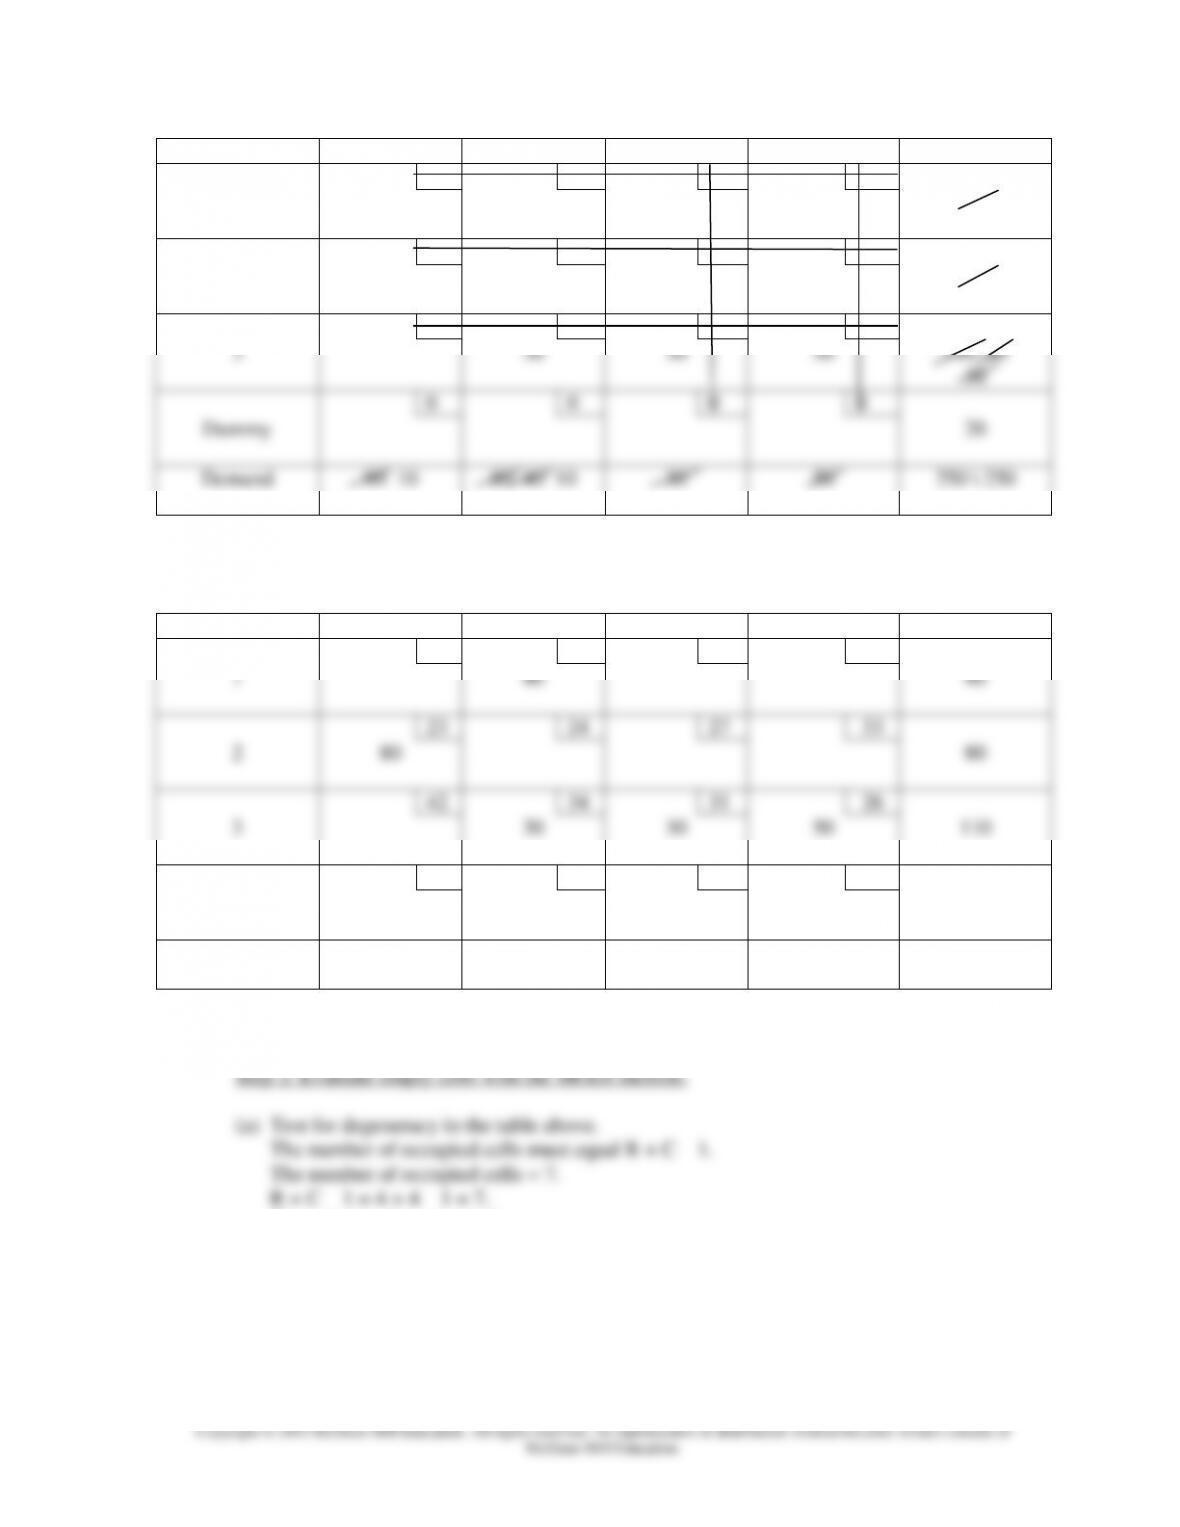
Because no cell evaluations are negative, we have found the optimal solution (repeated
below):
From:
To:
A
B
C
D
Dummy
Supply
14
24
18
28
0
1
13
35
48
17
18
25
16
0
2
28
2
20
6
56
30
16
22
30
0
3
32
32
Demand
41
34
35
20
6
136 \ 136
Total cost = (13 x 14) + (35 x 18) + (28 x 17) + (2 x 18) + (20 x 16) + (32 x 16) = $2,156.
8S-112
9. Refer to Problem 7. Origin 3 has experienced a temporary capacity reduction of 20 units per
period (from 130 to 110). Use the intuitive method to develop an initial solution. Then,
determine a temporary distribution plan that will minimize transportation costs.
Given:
From:
To:
A
B
C
D
Supply
18
12
14
16
1
40
23
24
27
33
2
80
42
34
31
26
3
110
Demand
90
80
30
50
250 \ 230
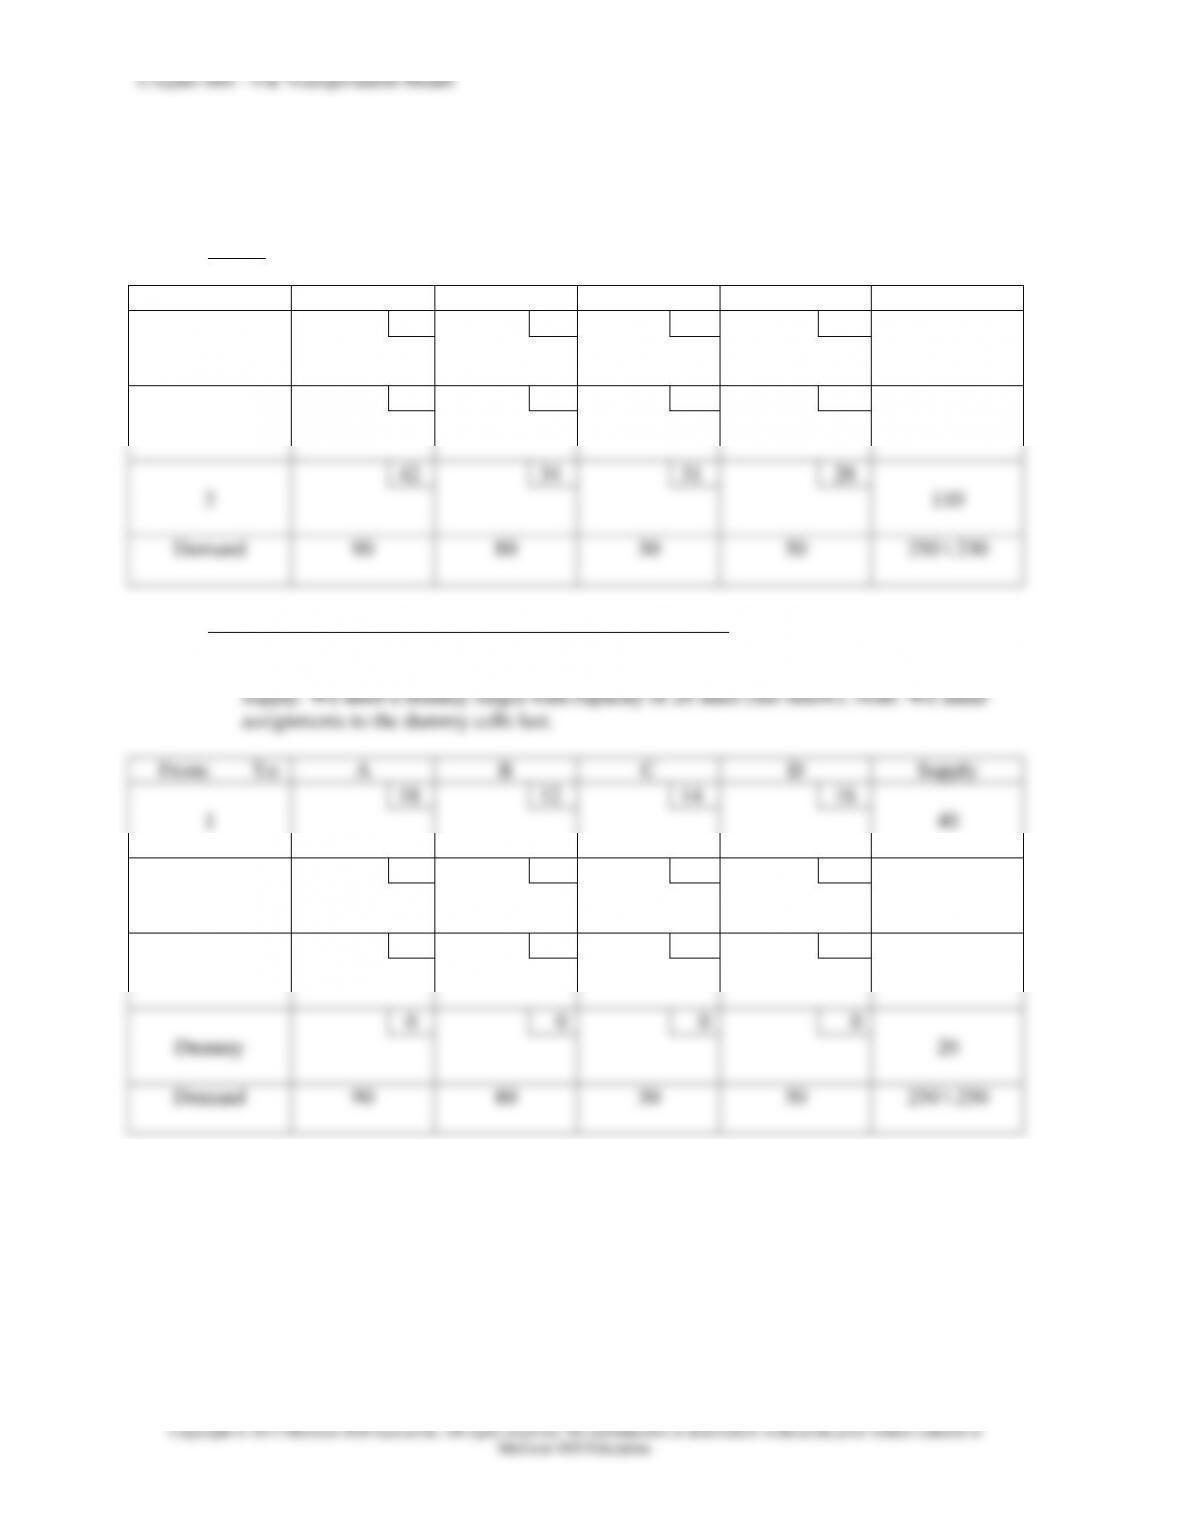
Step 1: Initial Solution with Intuitive Lowest-Cost Approach:
(a) Check to see if supply and demand are equal. They are not equal—demand exceeds
From:
To:
A
B
C
D
Supply
18
12
14
16
1
40
23
24
27
33
2
80
42
34
31
26
3
110
0
0
0
0
Dummy
20
Demand
90
80
30
50
250 \ 250
(b) Find the cell in the table above that has the lowest unit transportation cost. Cell 1-B has
the lowest cost ($12). Assign as many units as possible to this cell: minimum of 40 & 80 =
40. This exhausts the Row 1 total, so cross out 40, and cross out the cell costs for Row 1.
Revise the Column B total to 40. The result is shown below.
Chapter 08S - The Transportation Model
From:
To:
A
B
C
D
Supply
18
12
14
16
1
40
40
23
24
27
33
2
80
42
34
31
26
3
110
0
0
0
0
Dummy
20
Demand
90
80 40
30
50
250 \ 250
out 80, and cross out the cell costs for Row 2. Revise the Column A total to 10. The result
is shown below.
From:
To:
A
B
C
D
Supply
18
12
14
16
1
40
40
23
24
27
33
2
80
80
42
34
31
26
3
110
0
0
0
0
Dummy
20
Demand
90 10
80 40
30
50
250 \ 250
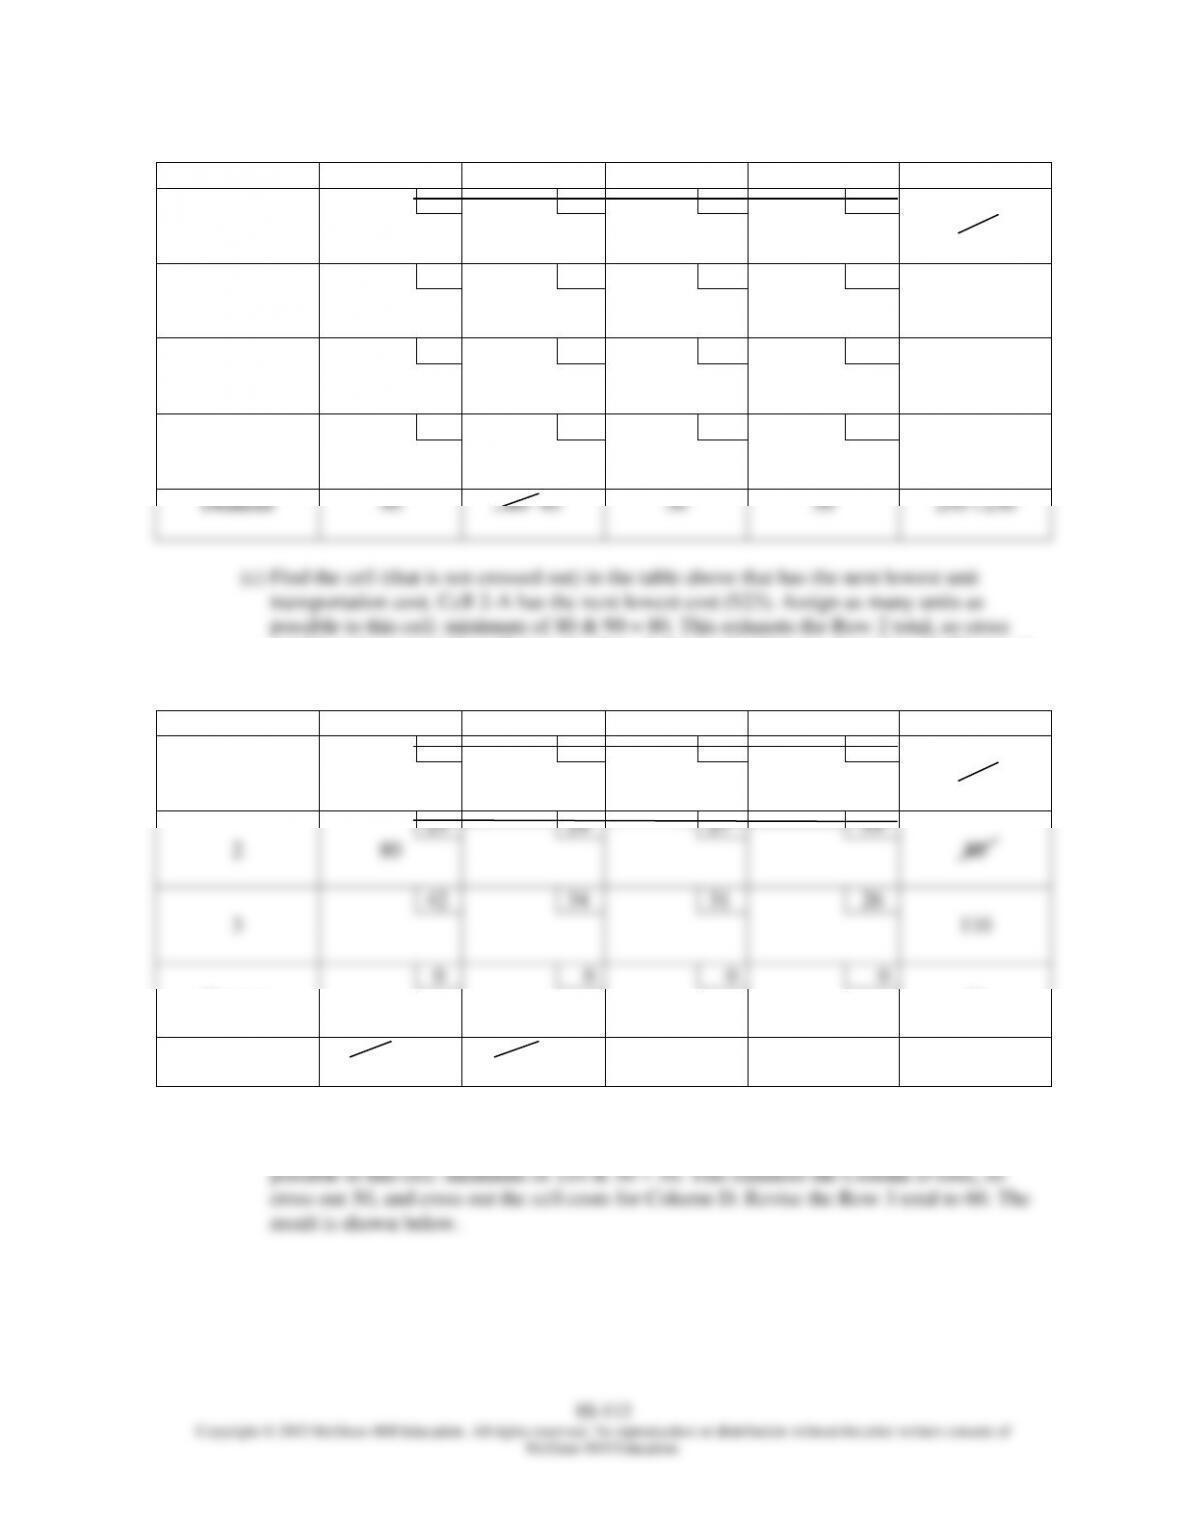
(d) Find the cell (that is not crossed out) in the table above that has the next lowest unit
transportation cost. Cell 3-D has the next lowest cost ($26). Assign as many units as
Chapter 08S - The Transportation Model
From:
To:
A
B
C
D
Supply
18
12
14
16
1
40
40
23
24
27
33
2
80
80
42
34
31
26
3
50
110 60
0
0
0
0
Dummy
20
Demand
90 10
80 40
30
50
250 \ 250
(e) Find the cell (that is not crossed out) in the table above that has the next lowest unit
result is shown below.
From:
To:
A
B
C
D
Supply
18
12
14
16
1
40
40
23
24
27
33
2
80
80
42
34
31
26
3
30
50
110 60
30
0
0
0
0
Dummy
20
Demand
90 10
80 40
30
50
250 \ 250
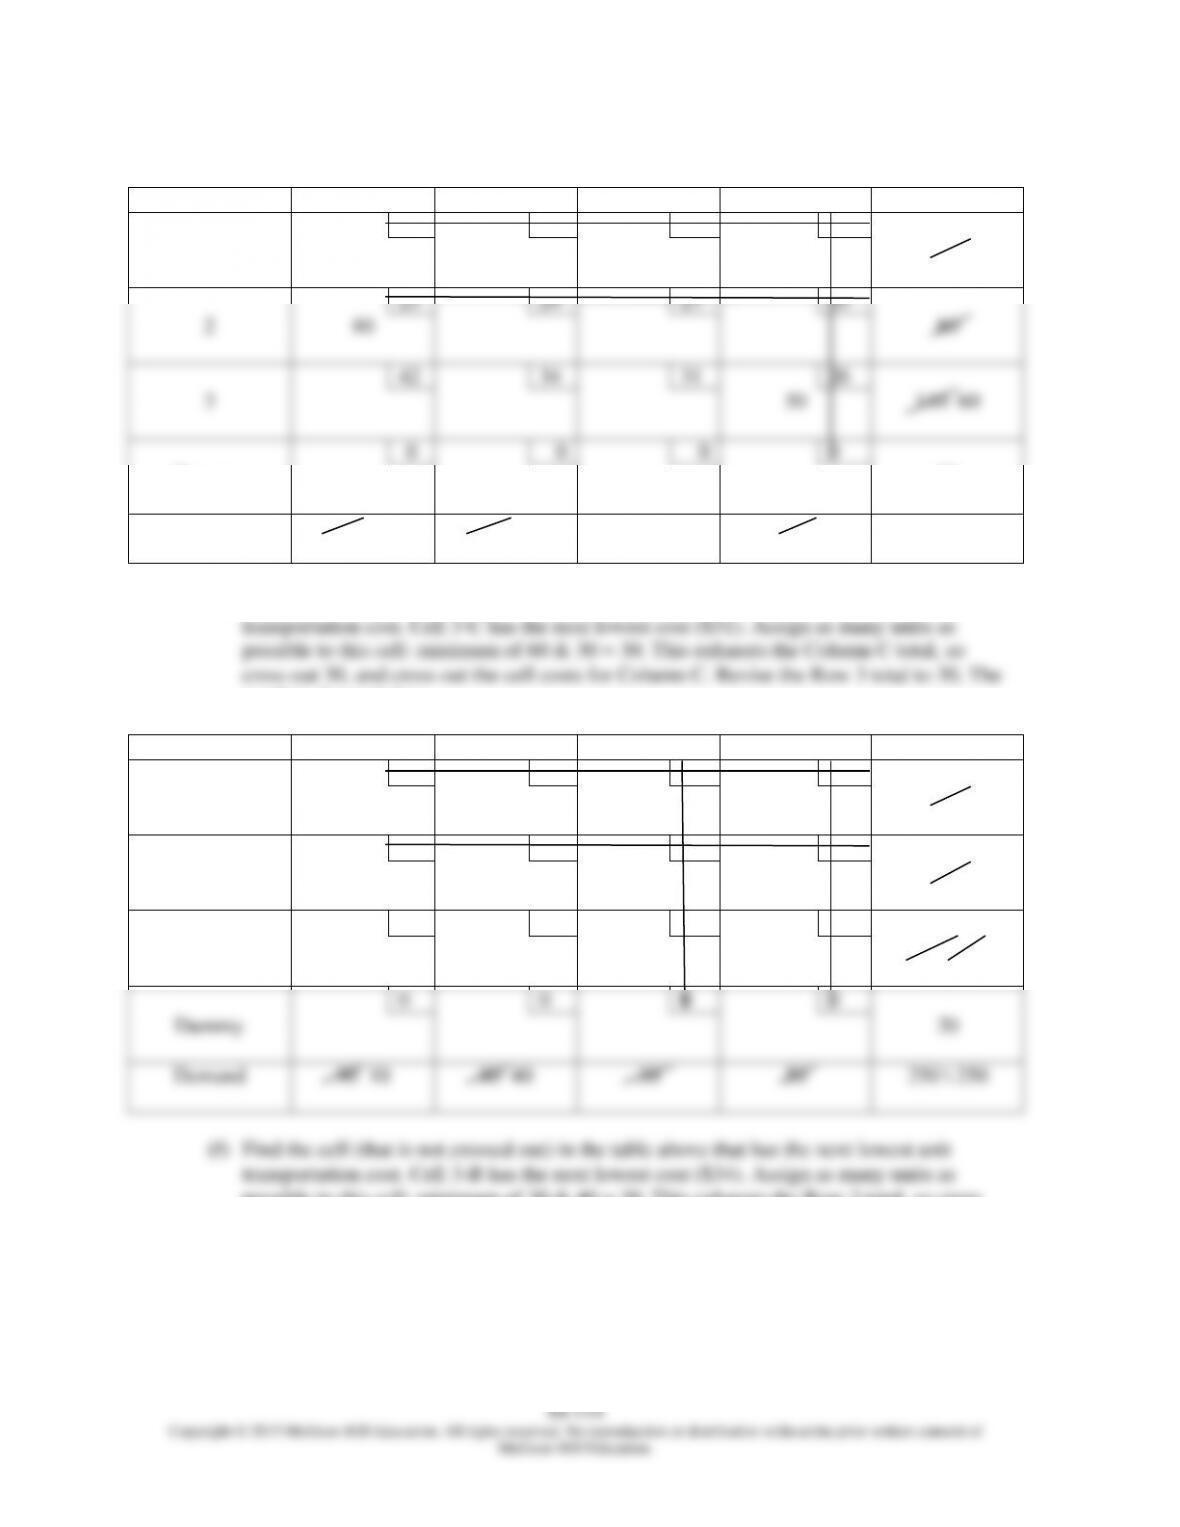
(f) Find the cell (that is not crossed out) in the table above that has the next lowest unit
transportation cost. Cell 3-B has the next lowest cost ($34). Assign as many units as
possible to this cell: minimum of 30 & 40 = 30. This exhausts the Row 3 total, so cross
out 30, and cross out the cell costs for Row 3. Revise the Column B total to 10. The result
is shown below.
Chapter 08S - The Transportation Model
8S-115
From:
To:
A
B
C
D
Supply
18
12
14
16
1
40
40
23
24
27
33
2
80
80
42
34
31
26
3
30
30
50
110 60
30
0
0
0
0
Dummy
20
Demand
90 10
80 40 10
30
50
250 \ 250
(g) At this point, we meet the remaining demand for Column A & Column B from the
Dummy. The initial solution is shown below:
From:
To:
A
B
C
D
Supply
18
12
14
16
1
40
40
23
24
27
33
2
80
80
42
34
31
26
3
30
30
50
110
0
0
0
0
Dummy
10
10
20
Demand
90
80
30
50
250 \ 250
Total cost = (40 x 12) + (80 x 23) + (30 x 34) + (30 x 31) + (50 x 26) = $5,570.
The solution above is not degenerate.
Chapter 08S - The Transportation Model
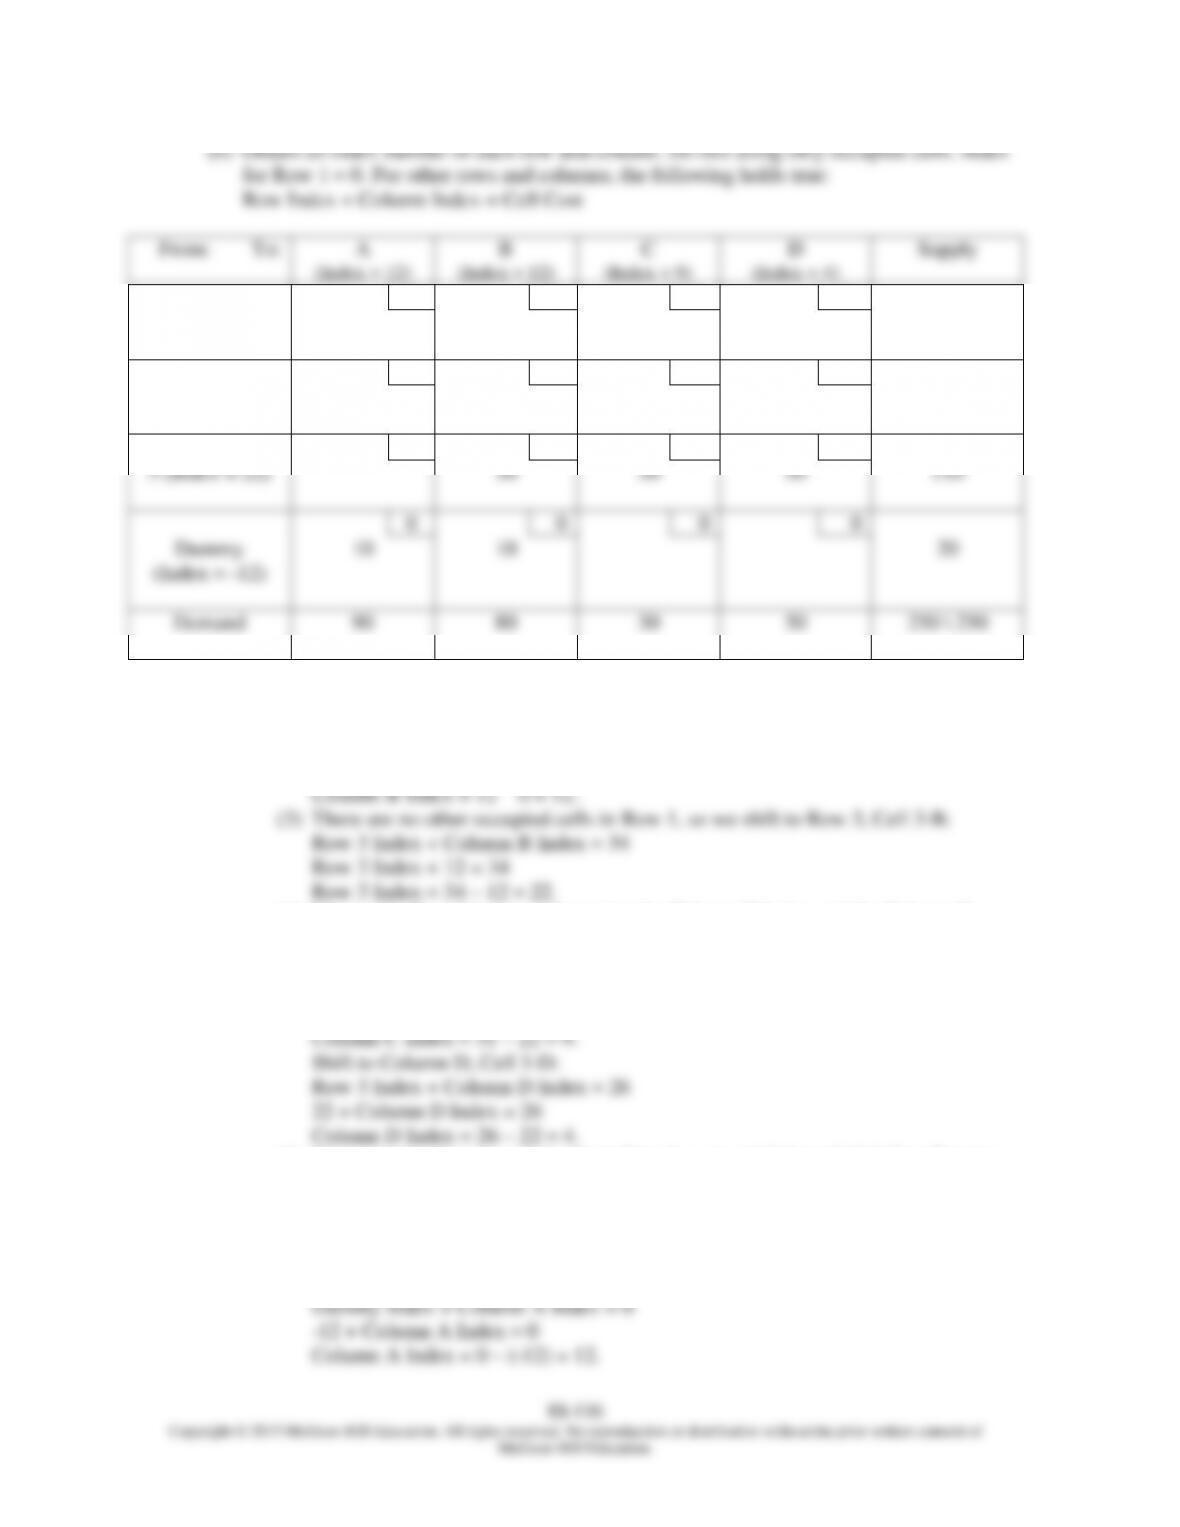
(b) Obtain an index number of each row and column. Do this using only occupied cells. Index
for Row 1 = 0. For other rows and columns, the following holds true:
Row Index + Column Index = Cell Cost
From:
To:
A
(Index = 12)
B
(Index = 12)
C
(Index = 9)
D
(Index = 4)
Supply
18
12
14
16
1 (Index = 0)
40
40
23
24
27
33
2 (Index = 11)
80
80
42
34
31
26
3 (Index = 22)
30
30
50
110
0
0
0
0
Dummy
(Index = -12)
10
10
20
Demand
90
80
30
50
250 \ 250
(1) Row 1 Index = 0.
(2) Shift to Cell 1-B:
Row 1 Index + Column B Index = 12
0 + Column B Index = 12
(4) We use the Row 3 Index to determine the Column C Index and the Column D
Index:
Shift to Column C, Cell 3-C:
Row 3 Index + Column C Index = 31
22 + Column C Index = 31
(5) There are no other occupied cells in Row 3, so we shift from Cell 3-B to Dummy-
B:
Dummy Index + Row B Index = 0
Dummy Index + 12 = 0
Dummy Index = 0 – 12 = -12
(6) Shift to Dummy-A:
Chapter 08S - The Transportation Model
(7) There are no other occupied cells in Dummy, so we shift to Row 2, Cell 2-A:
Row 2 Index + Column A Index = 23
Row 2 Index + 12 = 23
8S-118
10. Refer to Problem 8. The market supplied by Warehouse D is experiencing a period of growth
and will have projected demand of 60 units per period. A new factory with a capacity of 50
units is planned in either Baltimore or Philadelphia. Transportation costs are shown below.
Use the MODI method for cell evaluation.
Baltimore Option
From:
To:
A
B
C
D
Supply
14
24
18
28
1
48
17
18
25
16
2
56
30
16
22
30
3
32
18
16
22
27
Baltimore
50
Demand
41
34
35
60
170 \ 186
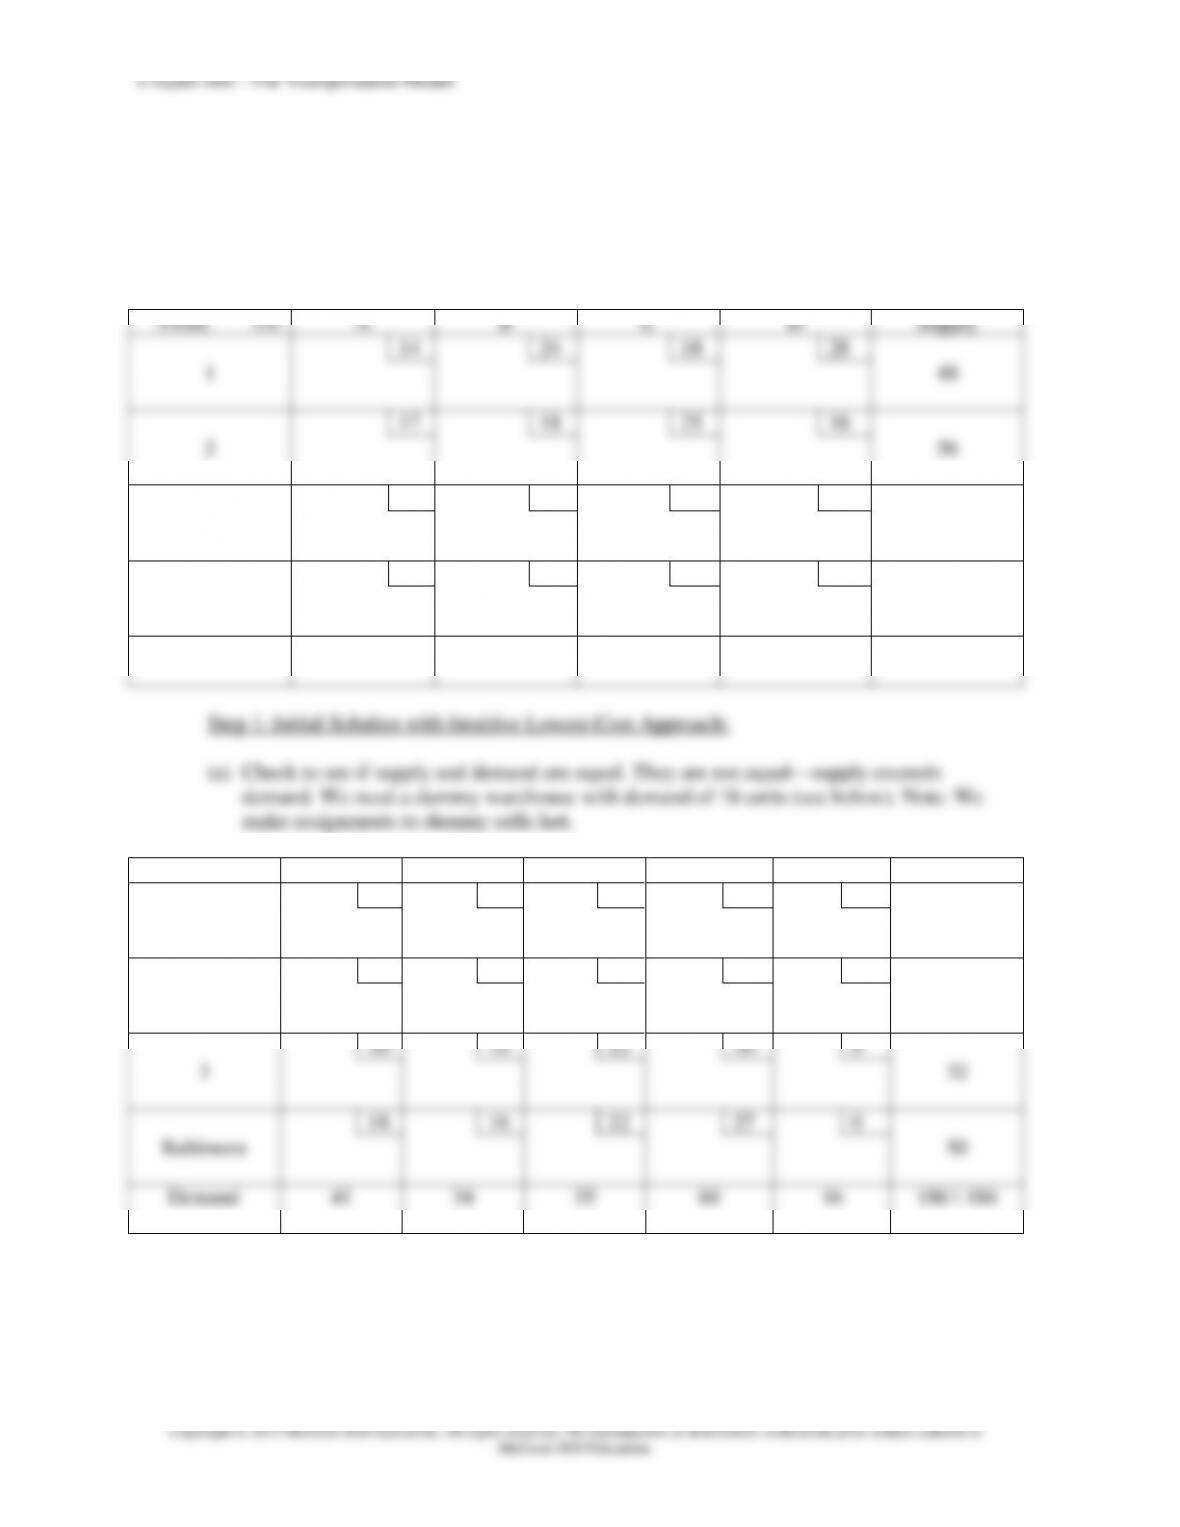
Step 1: Initial Solution with Intuitive Lowest-Cost Approach:
(a) Check to see if supply and demand are equal. They are not equal—supply exceeds
demand. We need a dummy warehouse with demand of 16 units (see below). Note: We
make assignments to dummy cells last.
From:
To:
A
B
C
D
Dummy
Supply
14
24
18
28
0
1
48
17
18
25
16
0
2
56
30
16
22
30
0
3
32
18
16
22
27
0
Baltimore
50
Demand
41
34
35
60
16
186 \ 186
Chapter 08S - The Transportation Model
8S-119
Copyright © 2015 McGraw-Hill Education. All rights reserved. No reproduction or distribution without the prior written consent of
McGraw-Hill Education.
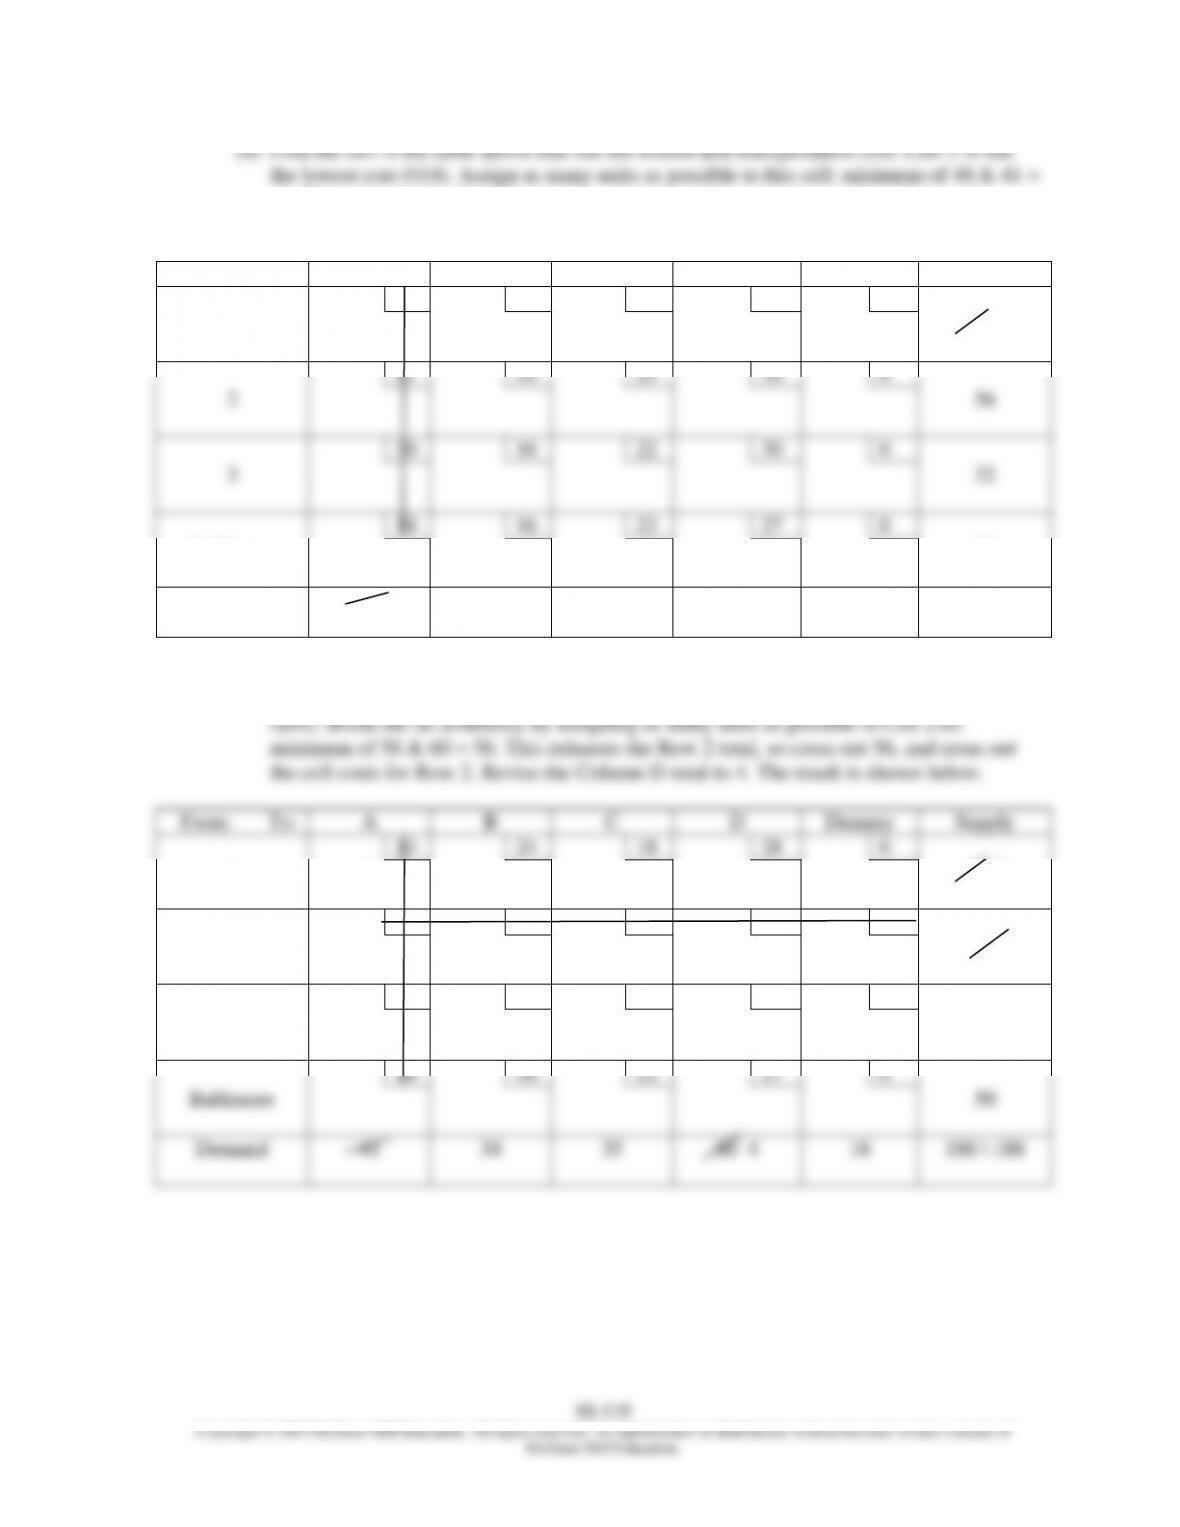
(b) Find the cell in the table above that has the lowest unit transportation cost. Cell 1-A has
the lowest cost ($14). Assign as many units as possible to this cell: minimum of 48 & 41 =
41. This exhausts the Column A total, so cross out 41, and cross out the cell costs for
Column A. Revise the Row 1 total to 7. The result is shown below.
From:
To:
A
B
C
D
Dummy
Supply
14
24
18
28
0
1
41
48 7
17
18
25
16
0
2
56
30
16
22
30
0
3
32
18
16
22
27
0
Baltimore
50
Demand
41
34
35
60
16
186 \ 186
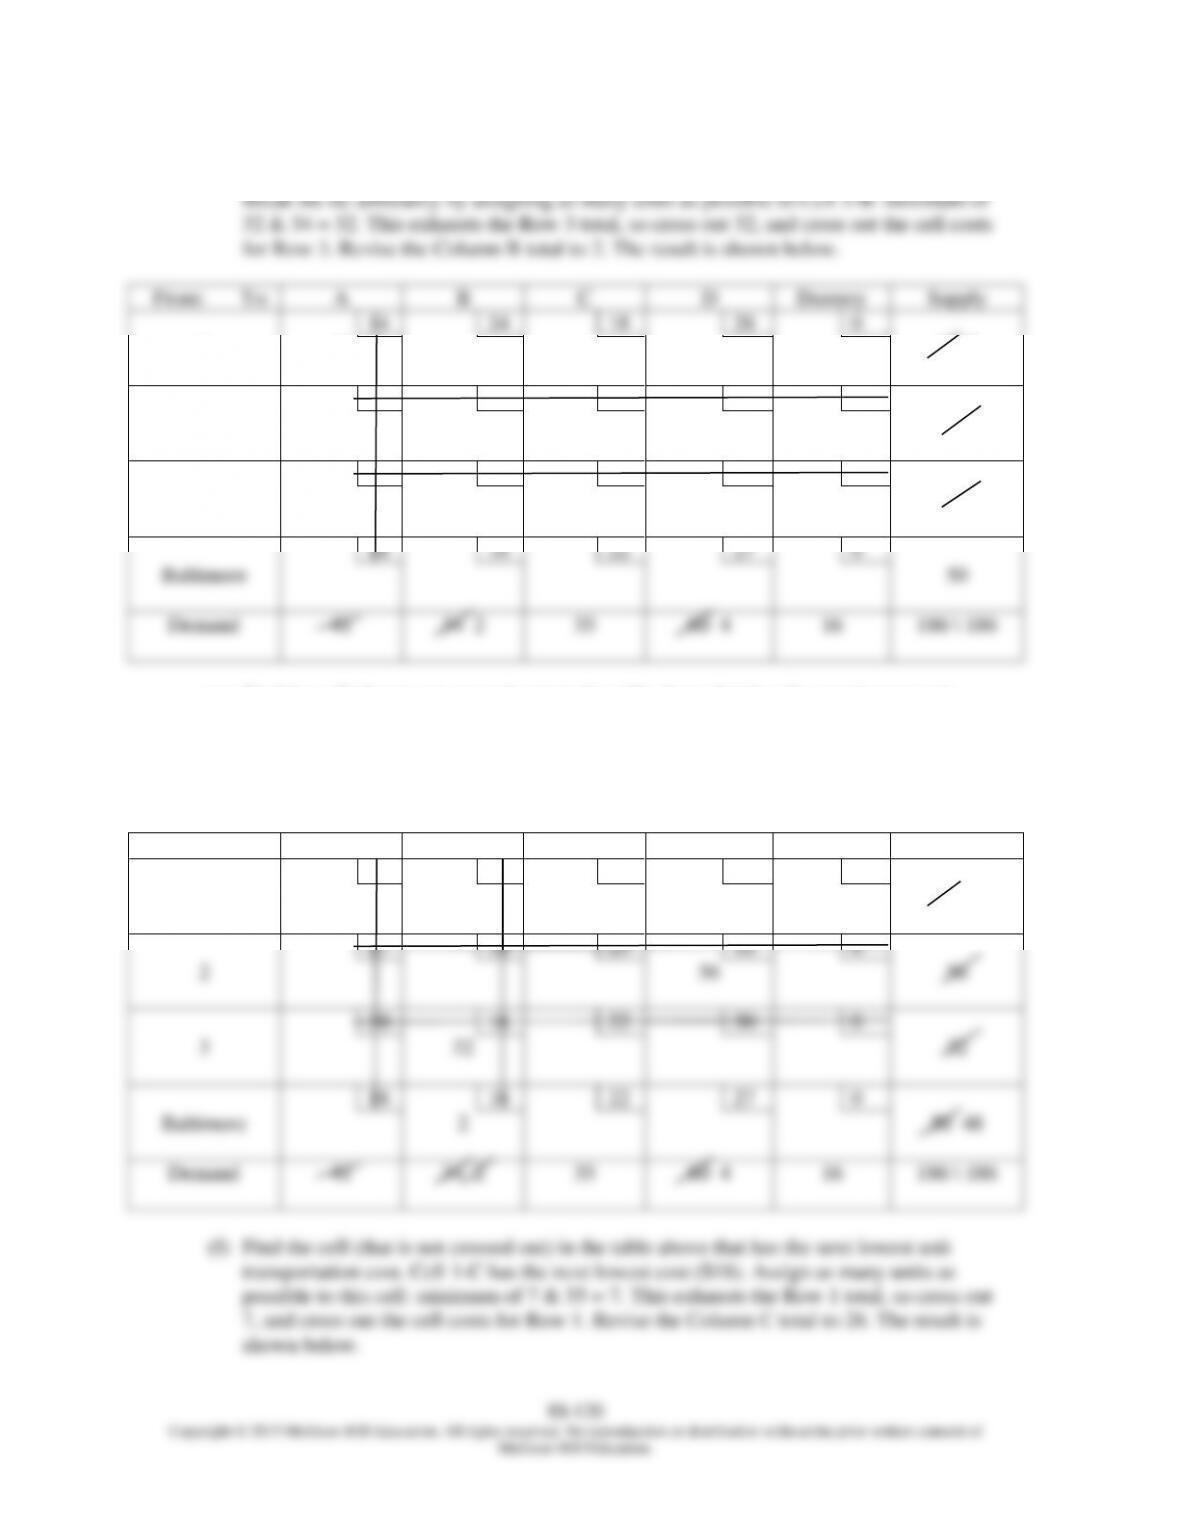
(c) Find the cell (that is not crossed out) in the table above that has the next lowest unit
transportation cost. Cell 2-D, Cell 3-B, and Cell Baltimore-B are tied for next lowest cost
From:
To:
A
B
C
D
Dummy
Supply
14
24
18
28
0
1
41
48 7
17
18
25
16
0
2
56
56
30
16
22
30
0
3
32
18
16
22
27
0
Baltimore
50
Demand
41
34
35
60 4
16
186 \ 186
Chapter 08S - The Transportation Model
(d) Find the cell (that is not crossed out) in the table above that has the next lowest unit
transportation cost. Cell 3-B and Cell Baltimore-B are tied for next lowest cost ($16).
From:
To:
A
B
C
D
Dummy
Supply
14
24
18
28
0
1
41
48 7
17
18
25
16
0
2
56
56
30
16
22
30
0
3
32
32
18
16
22
27
0
Baltimore
50
Demand
41
34 2
35
60 4
16
186 \ 186
(e) Find the cell (that is not crossed out) in the table above that has the next lowest unit
transportation cost. Cell Baltimore-B has the next lowest cost ($16). Assign as many units
as possible to this cell: minimum of 50 & 2 = 2. This exhausts the Column B total, so
cross out 2, and cross out the cell costs for Column B. Revise the Row Baltimore total to
48. The result is shown below.
From:
To:
A
B
C
D
Dummy
Supply
14
24
18
28
0
1
41
48 7
17
18
25
16
0
2
56
56
30
16
22
30
0
3
32
32
18
16
22
27
0
Baltimore
2
50 48
Demand
41
34 2
35
60 4
16
186 \ 186
(f) Find the cell (that is not crossed out) in the table above that has the next lowest unit
transportation cost. Cell 1-C has the next lowest cost ($18). Assign as many units as
possible to this cell: minimum of 7 & 35 = 7. This exhausts the Row 1 total, so cross out
7, and cross out the cell costs for Row 1. Revise the Column C total to 28. The result is
shown below.


