Chapter 08S – The Transportation Model
From:
To:
A
B
C
D
Supply
18
12
14
16
1
40
40
23
24
27
33
2
80
80
42
34
31
26
3
30
50
130 80
50
Demand
90 10
80 40
30
50
250 \ 250
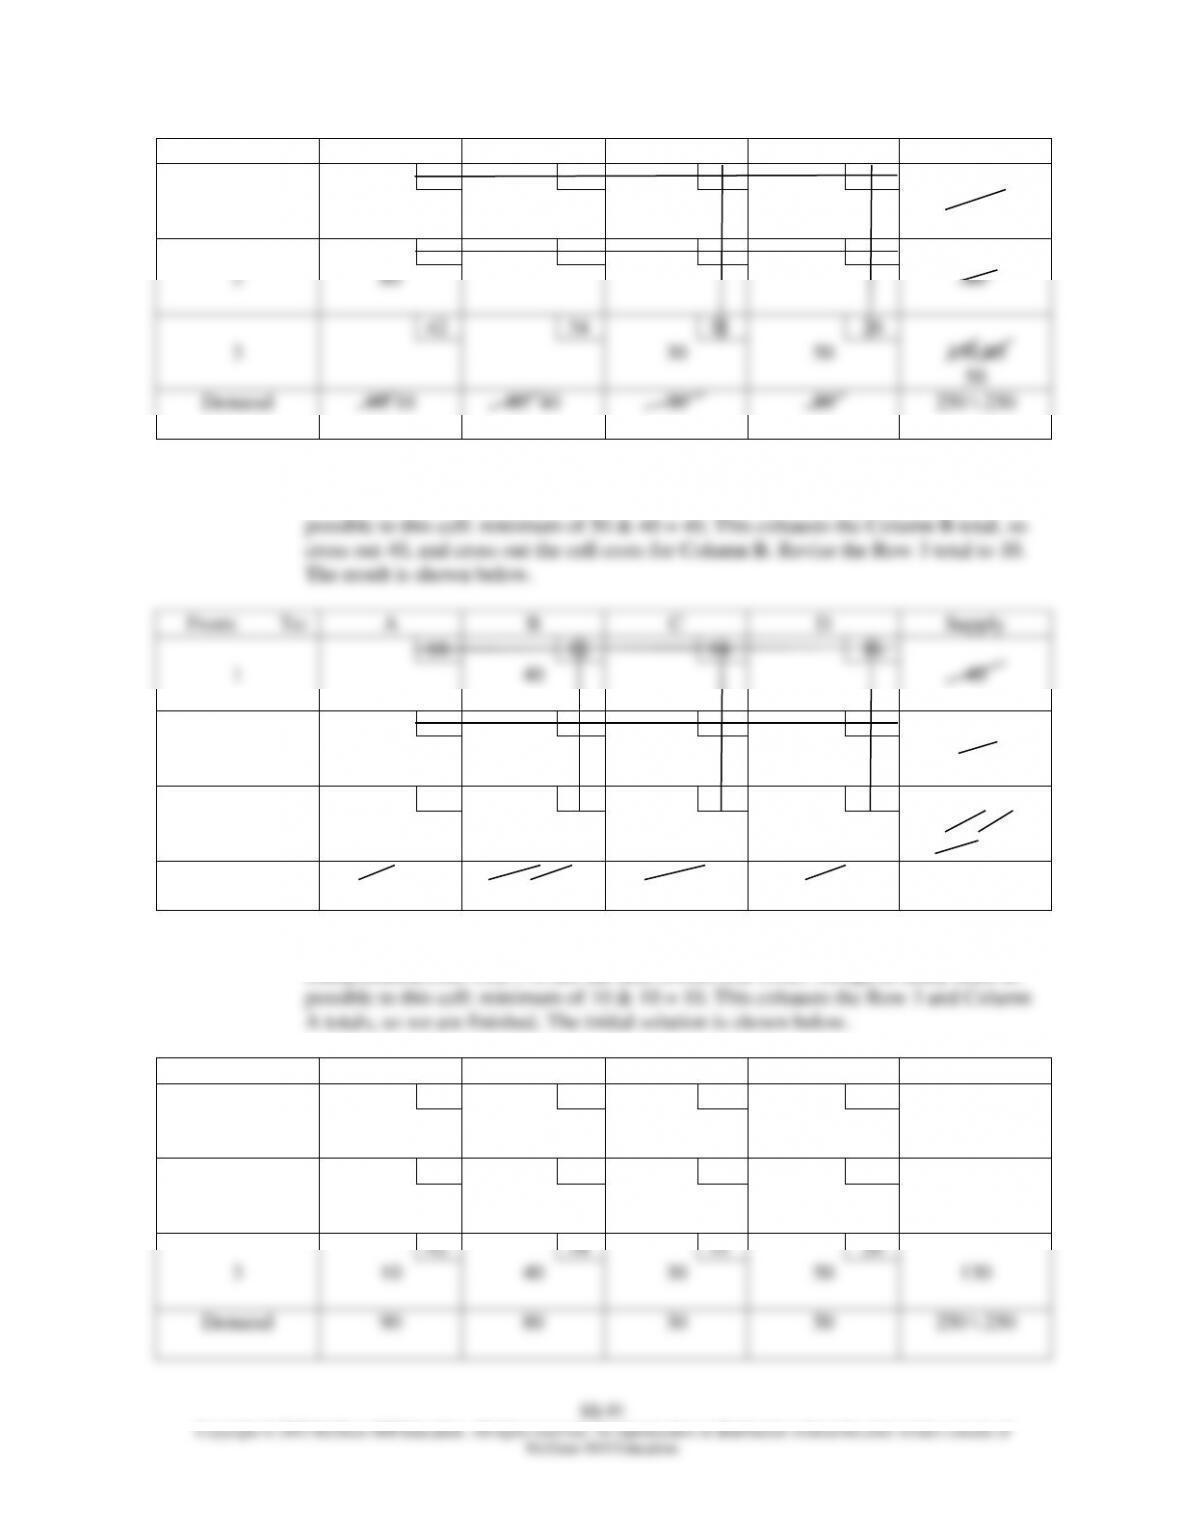
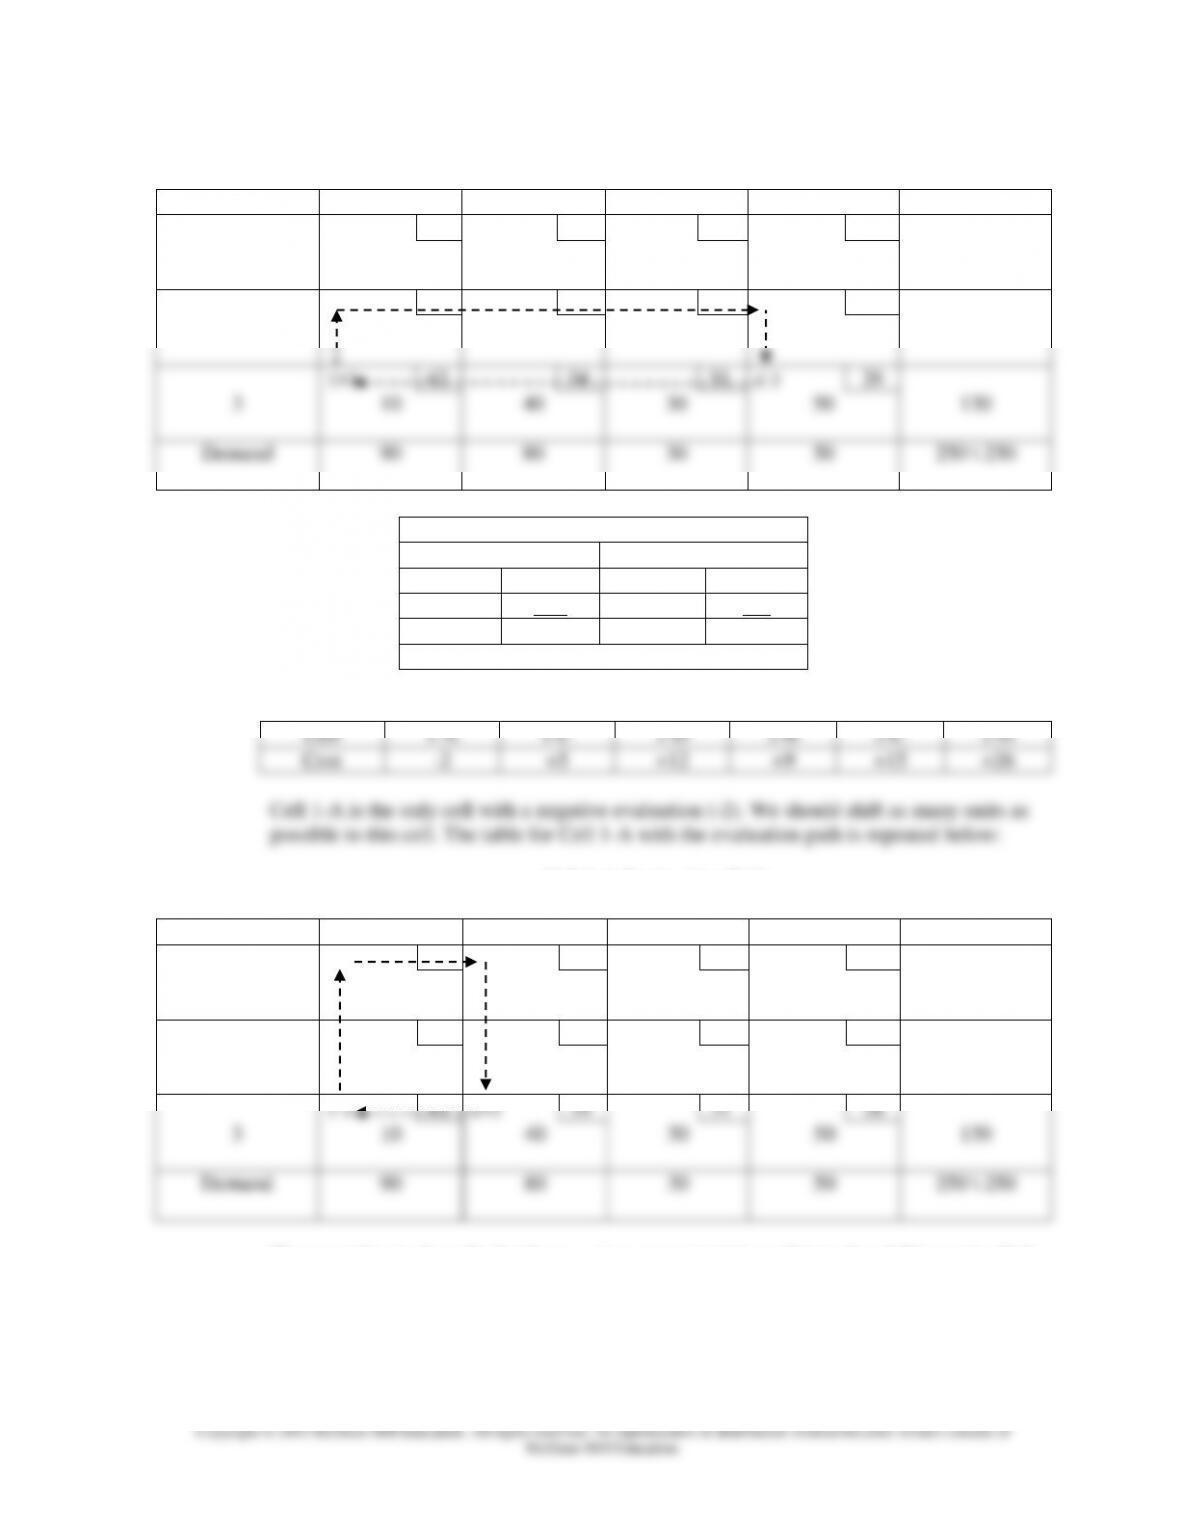
(f) Find the cell (that is not crossed out) in the table above that has the next lowest unit
transportation cost. Cell 3-B has the next lowest cost ($34). Assign as many units as
From:
To:
A
B
C
D
Supply
18
12
14
16
1
40
40
23
24
27
33
2
80
80
42
34
31
26
3
40
30
50
130 80
50 10
Demand
90 10
80 40
30
50
250 \ 250
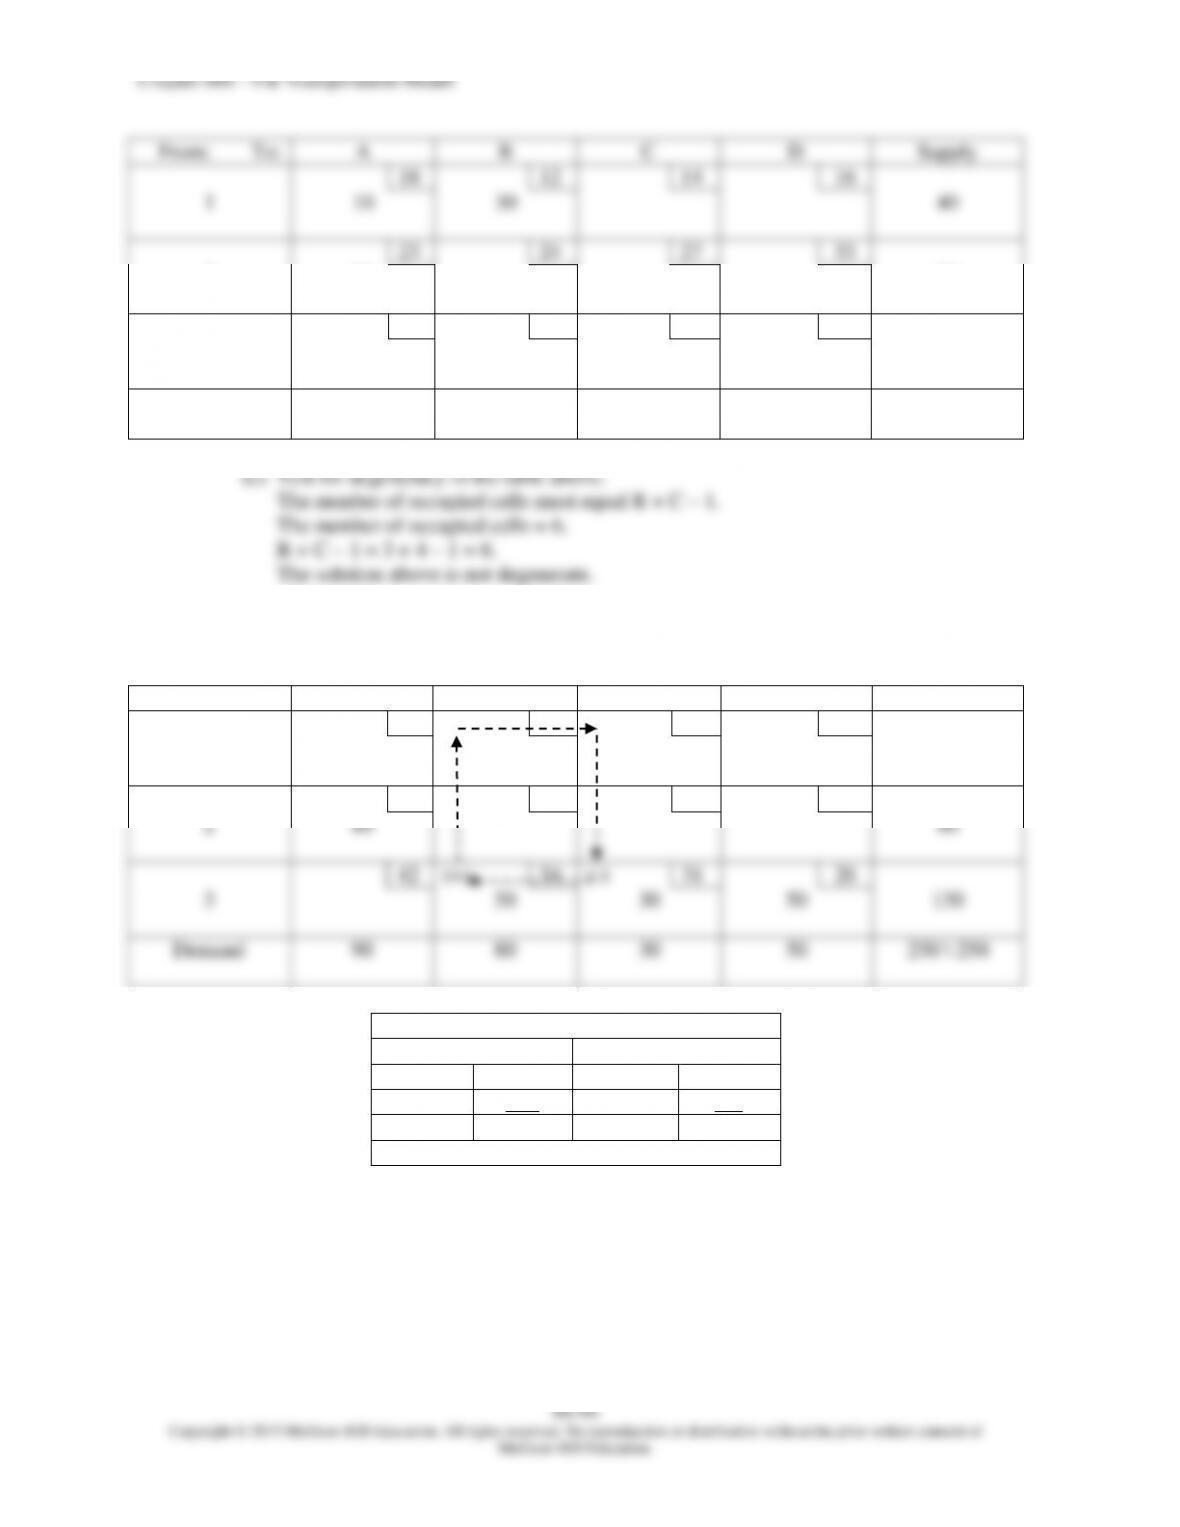
(g) Find the cell (that is not crossed out) in the table above that has the next lowest unit
transportation cost. Cell 3-A has the next lowest cost ($42). Assign as many units as
From:
To:
A
B
C
D
Supply
18
12
14
16
1
40
40
23
24
27
33
2
80
80
42
34
31
26
3
10
40
30
50
130
Demand
90
80
30
50
250 \ 250
Chapter 08S – The Transportation Model
Total cost = (40 x 12) + (80 x 23) + (10 x 42) + (40 x 34) + (30 x 31) + (50 x 26) =
$6,330.
The solution above is not degenerate.
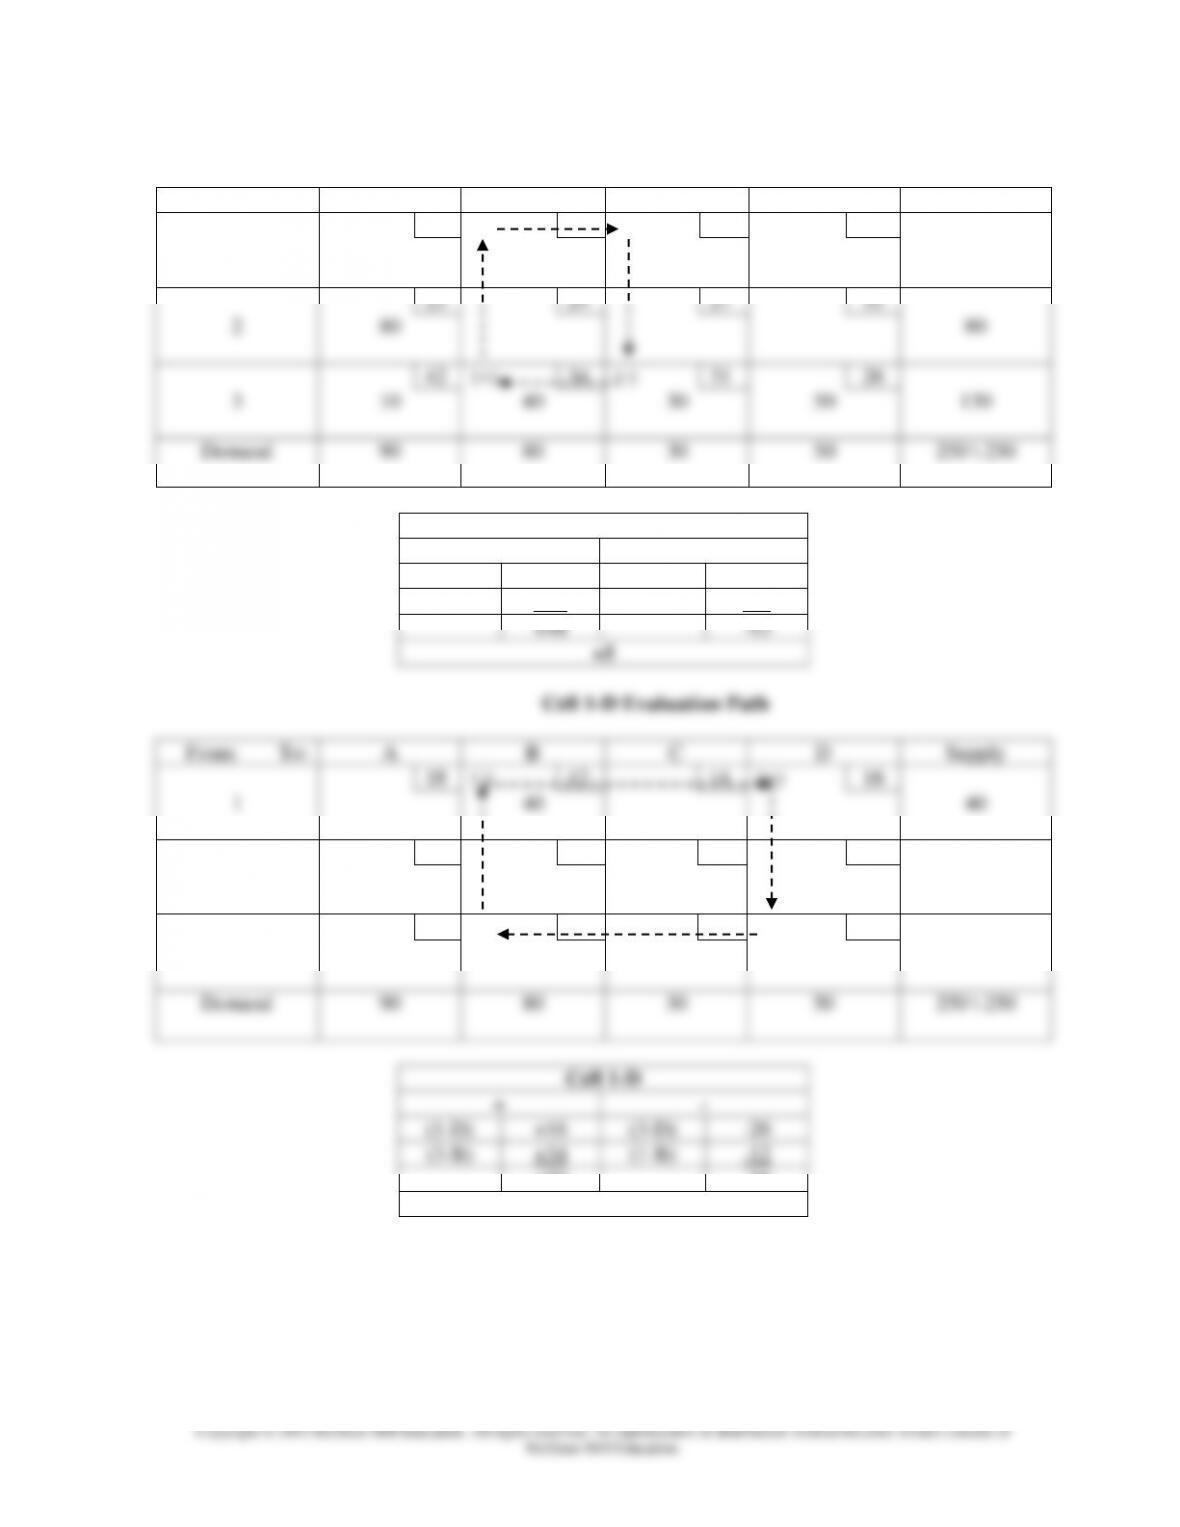
(b) Evaluate empty cells:
Cell 1-A Evaluation Path
From:
To:
A
B
C
D
Supply
(+)
18
(-)
12
14
16
1
40
40
23
24
27
33
2
80
80
(-)
42
(+)
34
31
26
3
10
40
30
50
130
Demand
90
80
30
50
250 \ 250
Cell 1-A
+
–
(1–A)
+18
(1-B)
-12
(3-B)
+34
(3–A)
-42
+52
-54
-2
Chapter 08S – The Transportation Model
Cell 1-C Evaluation Path
From:
To:
A
B
C
D
Supply
18
(-)
12
(+)
14
16
1
40
40
23
24
27
33
2
80
80
42
(+)
34
(-)
31
26
3
10
40
30
50
130
Demand
90
80
30
50
250 \ 250
Cell 1-C
+
–
(1-C)
+14
(3-C)
-31
(3-B)
+34
(1-B)
-12
+48
-43
+5
Cell 1-D Evaluation Path
From:
To:
A
B
C
D
Supply
18
(-)
12
14
(+)
16
1
40
40
23
24
27
33
2
80
80
42
(+)
34
31
(-)
26
3
10
40
30
50
130
Demand
90
80
30
50
250 \ 250
(1-D)
+16
(3-D)
-26
+50
-38
Chapter 08S – The Transportation Model
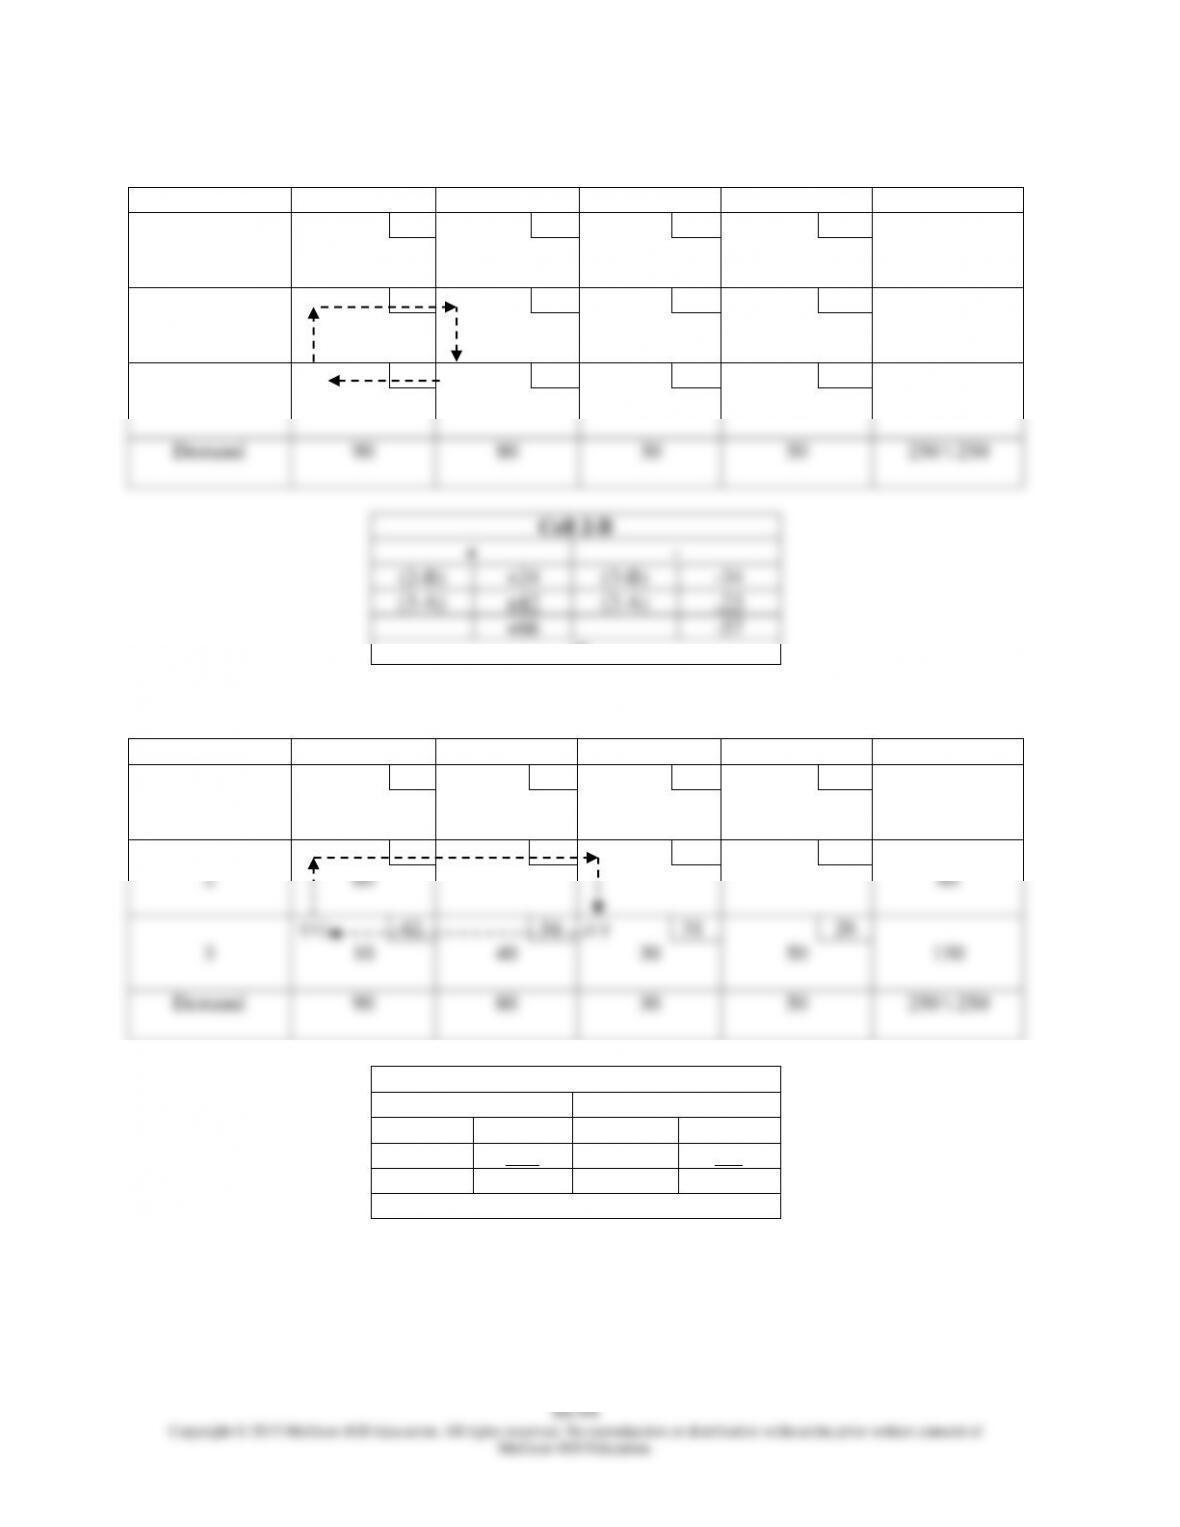
Cell 2-B Evaluation Path
From:
To:
A
B
C
D
Supply
18
12
14
16
1
40
40
(-)
23
(+)
24
27
33
2
80
80
(+)
42
(-)
34
31
26
3
10
40
30
50
130
Demand
90
80
30
50
250 \ 250
Cell 2-B
+
–
(2-B)
+24
(3-B)
-34
(3-A)
+42
(2-A)
-23
+66
-57
+9
Cell 2-C Evaluation Path
From:
To:
A
B
C
D
Supply
18
12
14
16
1
40
40
(-)
23
24
(+)
27
33
2
80
80
(+)
42
34
(-)
31
26
3
10
40
30
50
130
Demand
90
80
30
50
250 \ 250
Cell 2-C
+
–
(2-C)
+27
(3-C)
-31
(3-A)
+42
(2-A)
-23
+69
-54
+15
Chapter 08S – The Transportation Model
8S–95
Cell 2-D Evaluation Path
From:
To:
A
B
C
D
Supply
18
12
14
16
1
40
40
(-)
23
24
27
(+)
33
2
80
80
(+)
42
34
31
(-)
26
3
10
40
30
50
130
Demand
90
80
30
50
250 \ 250
Cell 2-D
+
–
(2-D)
+33
(3-D)
-26
(3-A)
+42
(2-A)
-23
+75
-49
+26
The resulting costs are summarized below:
Cell
1-A
1-C
1-D
2-B
2-C
2-D
Cost
-2
+5
+12
+9
+15
+26
Cell 1-A is the only cell with a negative evaluation (-2). We should shift as many units as
possible to this cell. The table for Cell 1-A with the evaluation path is repeated below:
Cell 1-A Evaluation Path
From:
To:
A
B
C
D
Supply
(+)
18
(-)
12
14
16
1
40
40
23
24
27
33
2
80
80
(-)
42
(+)
34
31
26
3
10
40
30
50
130
Demand
90
80
30
50
250 \ 250
The quantities in the cells that have – signs are potential candidates for shifting units. Cell
1-B has 40 units and Cell 3-A has 10 units. Therefore, 10 units can be shifted. The result
is shown below.
Chapter 08S – The Transportation Model
Cell 1-D Evaluation Path
From:
To:
A
B
C
D
Supply
18
(-)
12
14
(+)
16
1
10
30
40
23
24
27
33
2
80
80
42
(+)
34
31
(-)
26
3
50
30
50
130
Demand
90
80
30
50
250 \ 250
Cell 1-D
+
–
(1-D)
+16
(3-D)
-26
(3-B)
+34
(1-B)
-12
+50
-38
+12
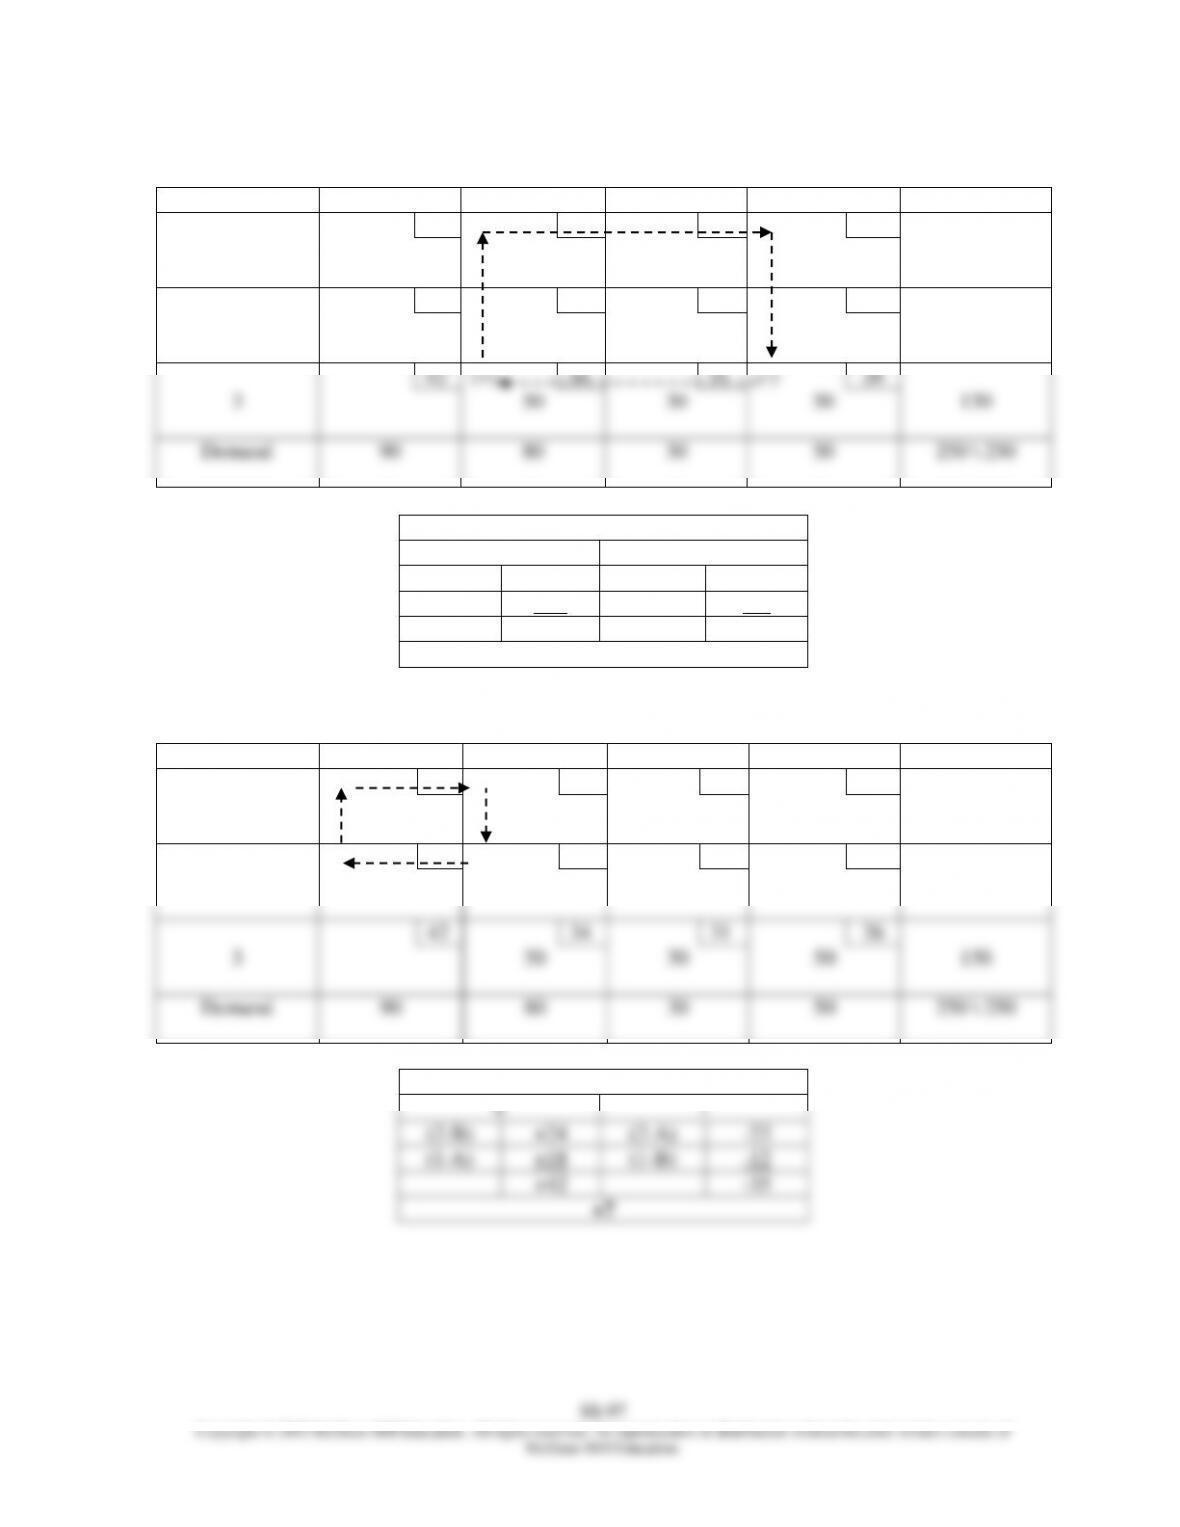
Cell 2-B Evaluation Path
From:
To:
A
B
C
D
Supply
(+)
18
(-)
12
14
16
1
10
30
40
(-)
23
(+)
24
27
33
2
80
80
42
34
31
26
3
50
30
50
130
Demand
90
80
30
50
250 \ 250
Cell 2-B
+
–
(2-B)
+24
(2-A)
-23
(1-A)
+18
(1-B)
-12
+42
-35
+7
Chapter 08S – The Transportation Model
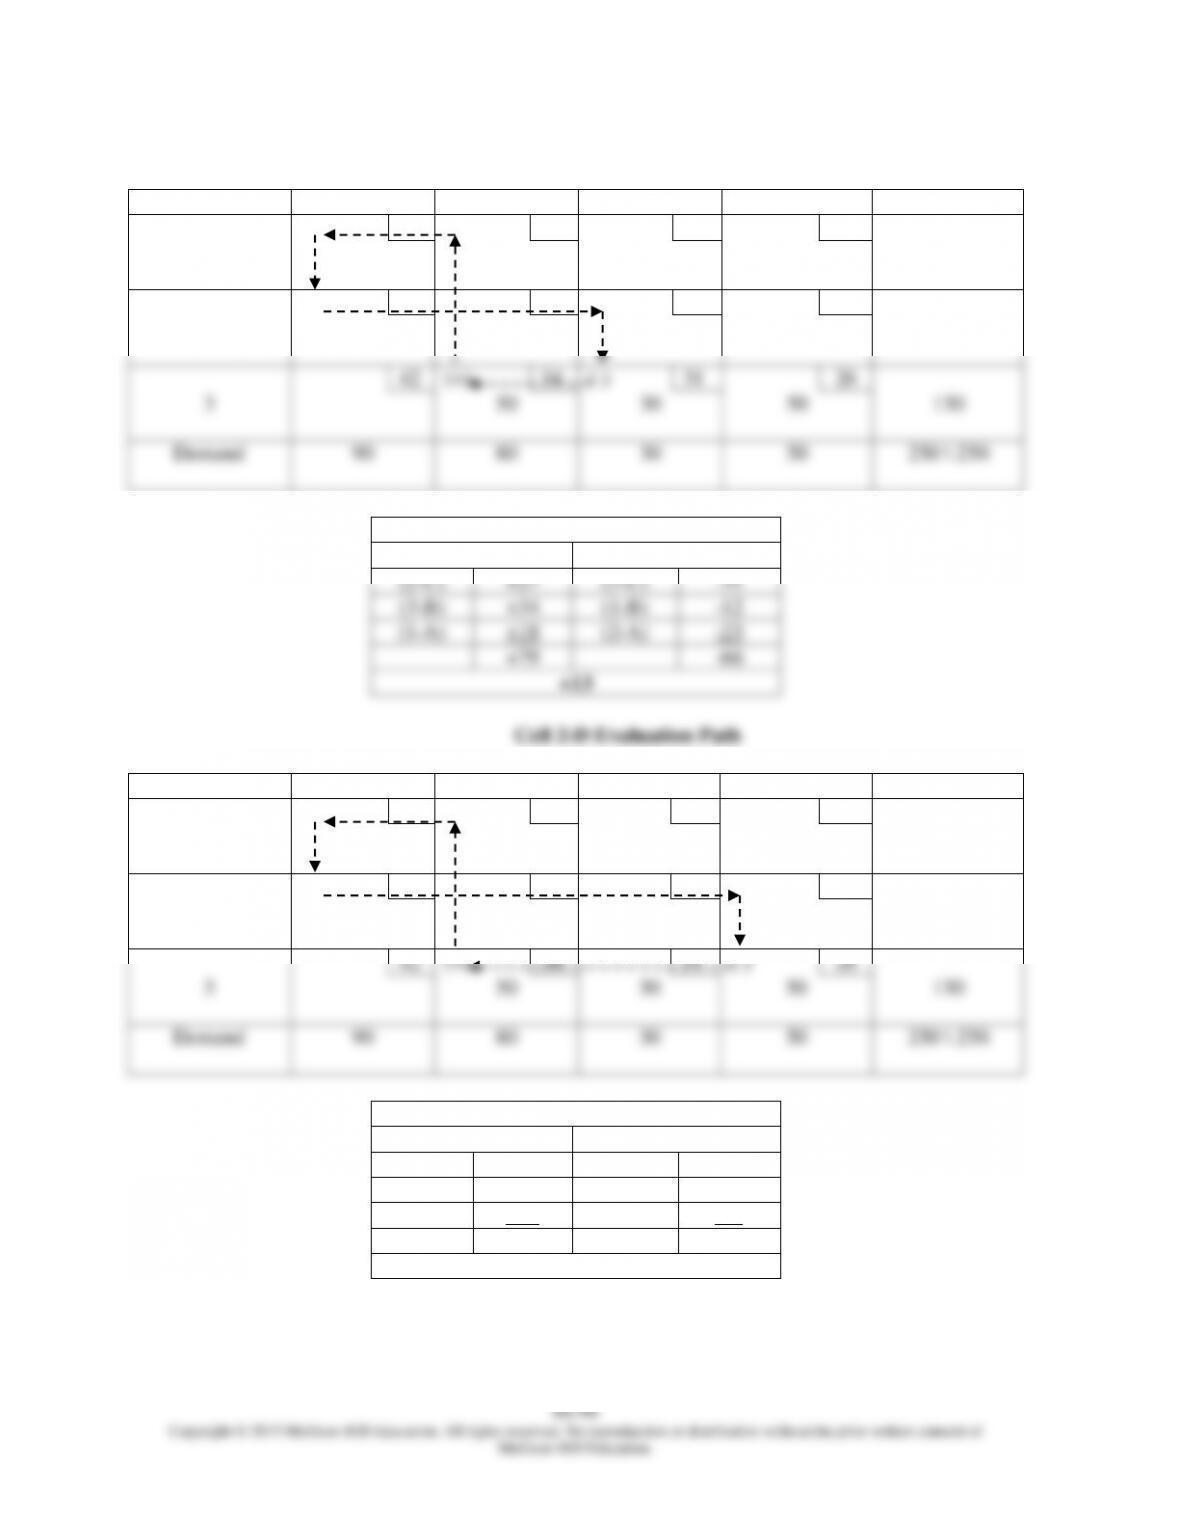
Cell 2-C Evaluation Path
From:
To:
A
B
C
D
Supply
(+)
18
(-)
12
14
16
1
10
30
40
(-)
23
24
(+)
27
33
2
80
80
42
(+)
34
(-)
31
26
3
50
30
50
130
Demand
90
80
30
50
250 \ 250
Cell 2-C
+
–
(2-C)
+27
(3-C)
-31
(3–B)
+34
(1–B)
-12
(1-A)
+18
(2-A)
-23
+79
-66
+13
Cell 2-D Evaluation Path
From:
To:
A
B
C
D
Supply
(+)
18
(-)
12
14
16
1
10
30
40
(-)
23
24
27
(+)
33
2
80
80
42
(+)
34
31
(-)
26
3
50
30
50
130
Demand
90
80
30
50
250 \ 250
Cell 2-D
+
–
(2-D)
+33
(3-D)
-26
(3–B)
+34
(1–B)
-12
(1-A)
+18
(2-A)
-23
+85
-61
+24
Chapter 08S – The Transportation Model
8S–99
Cell 3-A Evaluation Path
From:
To:
A
B
C
D
Supply
(-)
18
(+)
12
14
16
1
10
30
40
23
24
27
33
2
80
80
(+)
42
(-)
34
31
26
3
50
30
50
130
Demand
90
80
30
50
250 \ 250
Cell 3-A
+
–
(3-A)
+42
(1-A)
-18
(1-B)
+12
(3-B)
-34
+54
-52
+2
The resulting costs are summarized below:
Cell
1-C
1-D
2-B
2-C
2-D
3-A
Cost
+5
+12
+7
+13
+24
+2
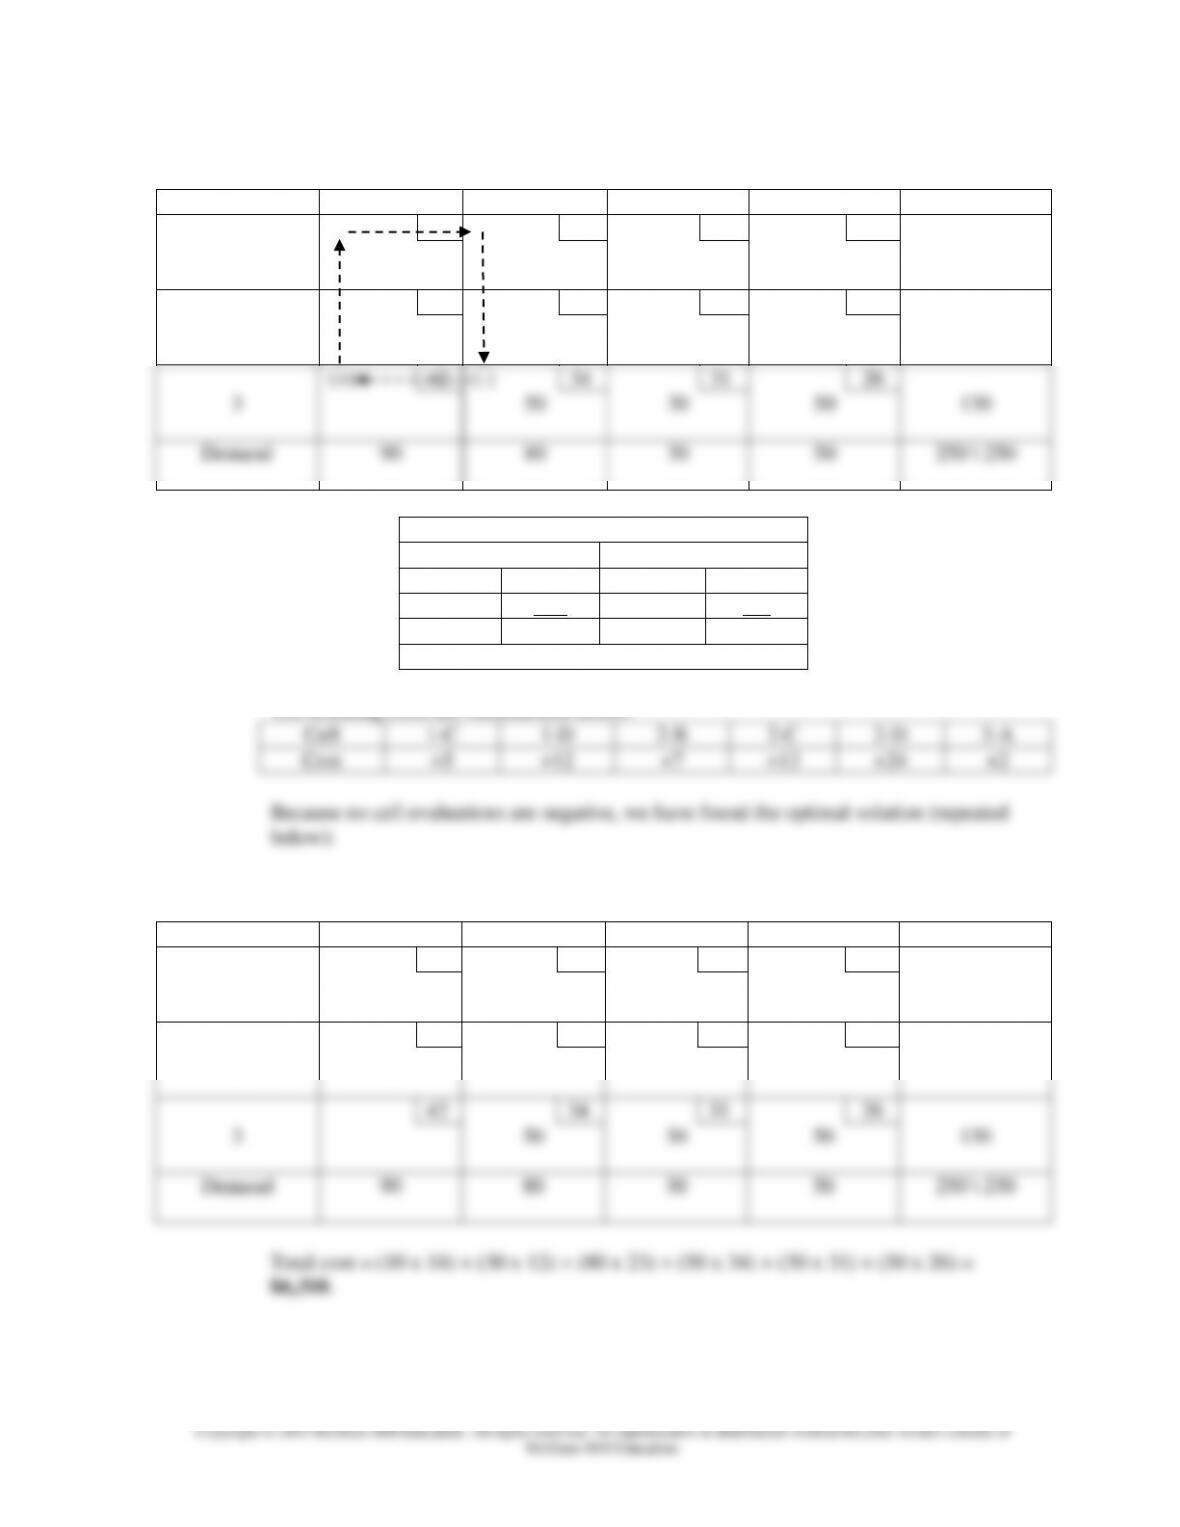
Because no cell evaluations are negative, we have found the optimal solution (repeated
below):
Optimal Solution: Stepping-Stone Method
From:
To:
A
B
C
D
Supply
18
12
14
16
1
10
30
40
23
24
27
33
2
80
80
42
34
31
26
3
50
30
50
130
Demand
90
80
30
50
250 \ 250
Total cost = (10 x 18) + (30 x 12) + (80 x 23) + (50 x 34) + (30 x 31) + (50 x 26) =
$6,310.
Chapter 08S – The Transportation Model
8S–100
c. Repeat part b using MODI:
From:
To:
A
B
C
D
Supply
18
12
14
16
1
40
40
23
24
27
33
2
80
80
42
34
31
26
3
10
40
30
50
130
Demand
90
80
30
50
250 \ 250
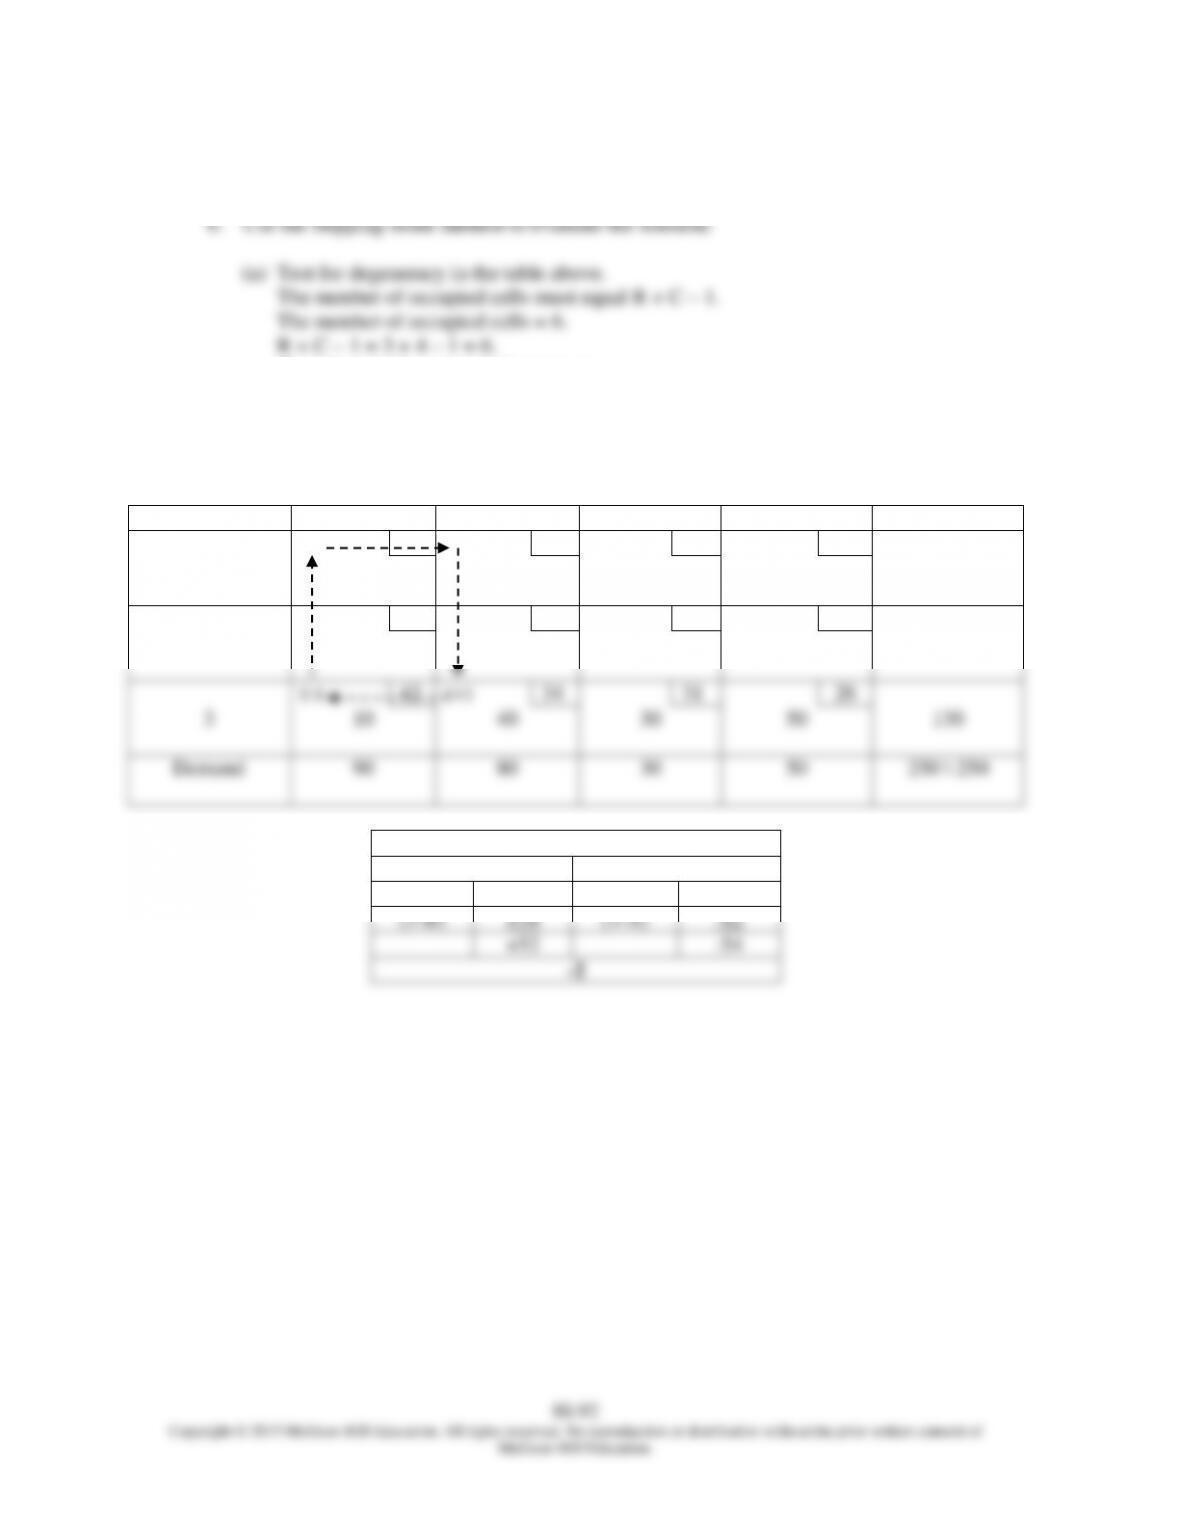
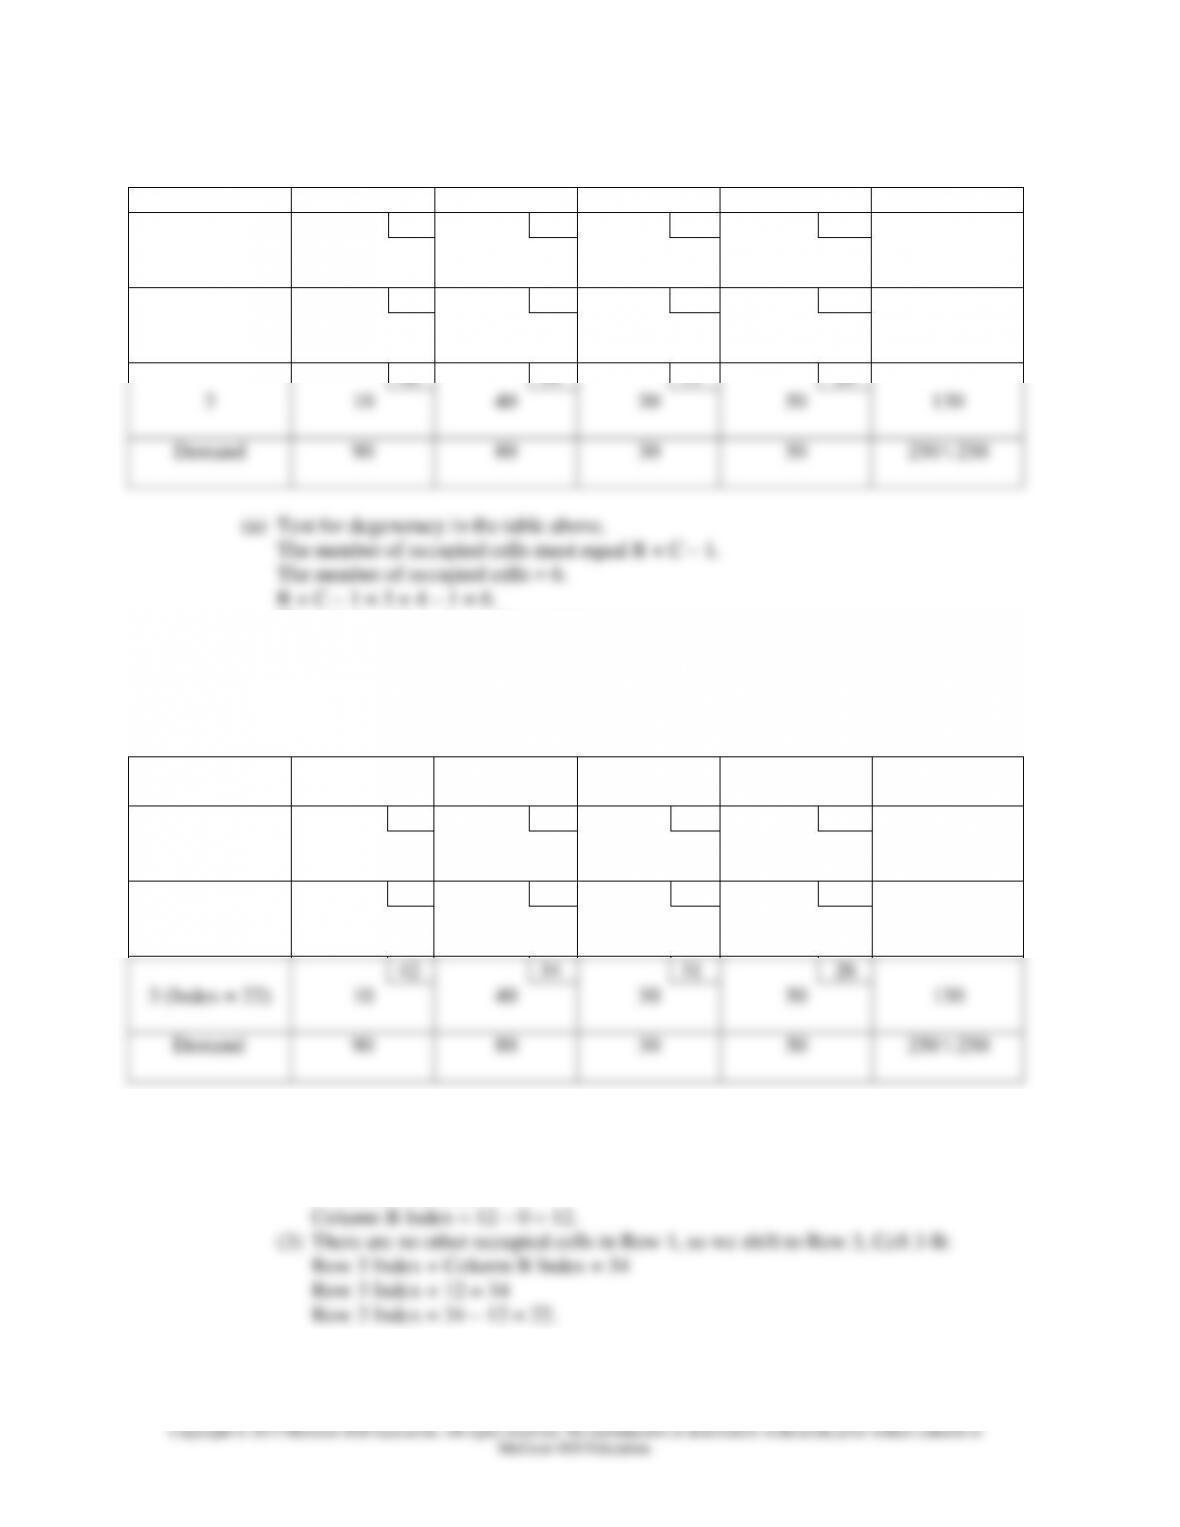
(a) Test for degeneracy in the table above.
The number of occupied cells must equal R + C – 1.
The number of occupied cells = 6.
R + C – 1 = 3 + 4 – 1 = 6.
The solution above is not degenerate.
(b) Obtain an index number of each row and column. Do this using only occupied cells.
Index for Row 1 = 0. For other rows and columns, the following holds true:
Row Index + Column Index = Cell Cost
From:
To:
A
(Index = 20)
B
(Index = 12)
C
(Index = 9)
D
(Index = 4)
Supply
18
12
14
16
1 (Index = 0)
40
40
23
24
27
33
2 (Index = 3)
80
80
42
34
31
26
3 (Index = 22)
10
40
30
50
130
Demand
90
80
30
50
250 \ 250
(1) Row 1 Index = 0.
(2) Shift to Cell 1-B:
Row 1 Index + Column B Index = 12
0 + Column B Index = 12