Chapter 07 – Work Design and Measurement
7-19
Education.
13. Given: An initial survey found that loaders were idle 6 of 50 observations.
a. Estimated % Idle Time: 6/50 = 0.12 (12%)
b. Given: The goal is to estimate the percentage of idle time to within 5% of its true value with a
confidence of 95%.
(round up to
163)
where:
z = Number of normal standard deviations for desired confidence (95%)
Using App. B Table A, we look for .95/2 = .475; z = 1.96.
= Sample proportion (0.12 from above)
e = Maximum error % (.05 from above)
Chapter 07 – Work Design and Measurement
14. Given: An analyst observed a process and noted whether a customer service representative was
busy (B) or Idle (I).
Observation
1
2
3
4
5
6
7
8
9
10
B or I
B
B
I
B
I
B
B
B
I
B
Observation
11
12
13
14
15
16
17
18
19
20
B or I
B
B
B
I
B
B
B
B
B
I
where:
z = Number of normal standard deviations for desired confidence
= Sample proportion
e = Maximum error %
where:
z = Number of normal standard deviations for desired confidence (90%)
Using App. B Table A, we look for .90/2 = .45; .45 is midway between .4495 (z = 1.64) &
.4505 (z = 1.65).
= Sample proportion (0.25 from above)
e = Maximum error % (.06 from above)
7-21
Education.
15. Given: An office manager estimates that about 50% of an employee’s time is spent working on
the telephone. The goal is to estimate the percentage of time on the telephone to within 6% of its
true value with a confidence of 98%.
where:
z = Number of normal standard deviations for desired confidence (98%)
Using App. B Table A, we look for .98/2 = .49; .4901 is closest to .49 & z = 2.33 for 98%
confidence.
= Sample proportion (0.50 from above)
e = Maximum error % (.06 from above)
16. Given: A hospital administrator estimates that X-ray equipment is in use only about 20% of the
time. The goal is to estimate the percentage of time the X-ray equipment is in use to within 5% of
its true value with a confidence of 98%.
where:
z = Number of normal standard deviations for desired confidence
= Sample proportion
e = Maximum error %
where:
z = Number of normal standard deviations for desired confidence (98%)
Using App. B Table A, we look for .98/2 = .49; .4901 is closest to .49 & z = 2.33 for 98%
confidence.
= Sample proportion (0.20 from above)
e = Maximum error % (.05 from above)
Chapter 07 – Work Design and Measurement
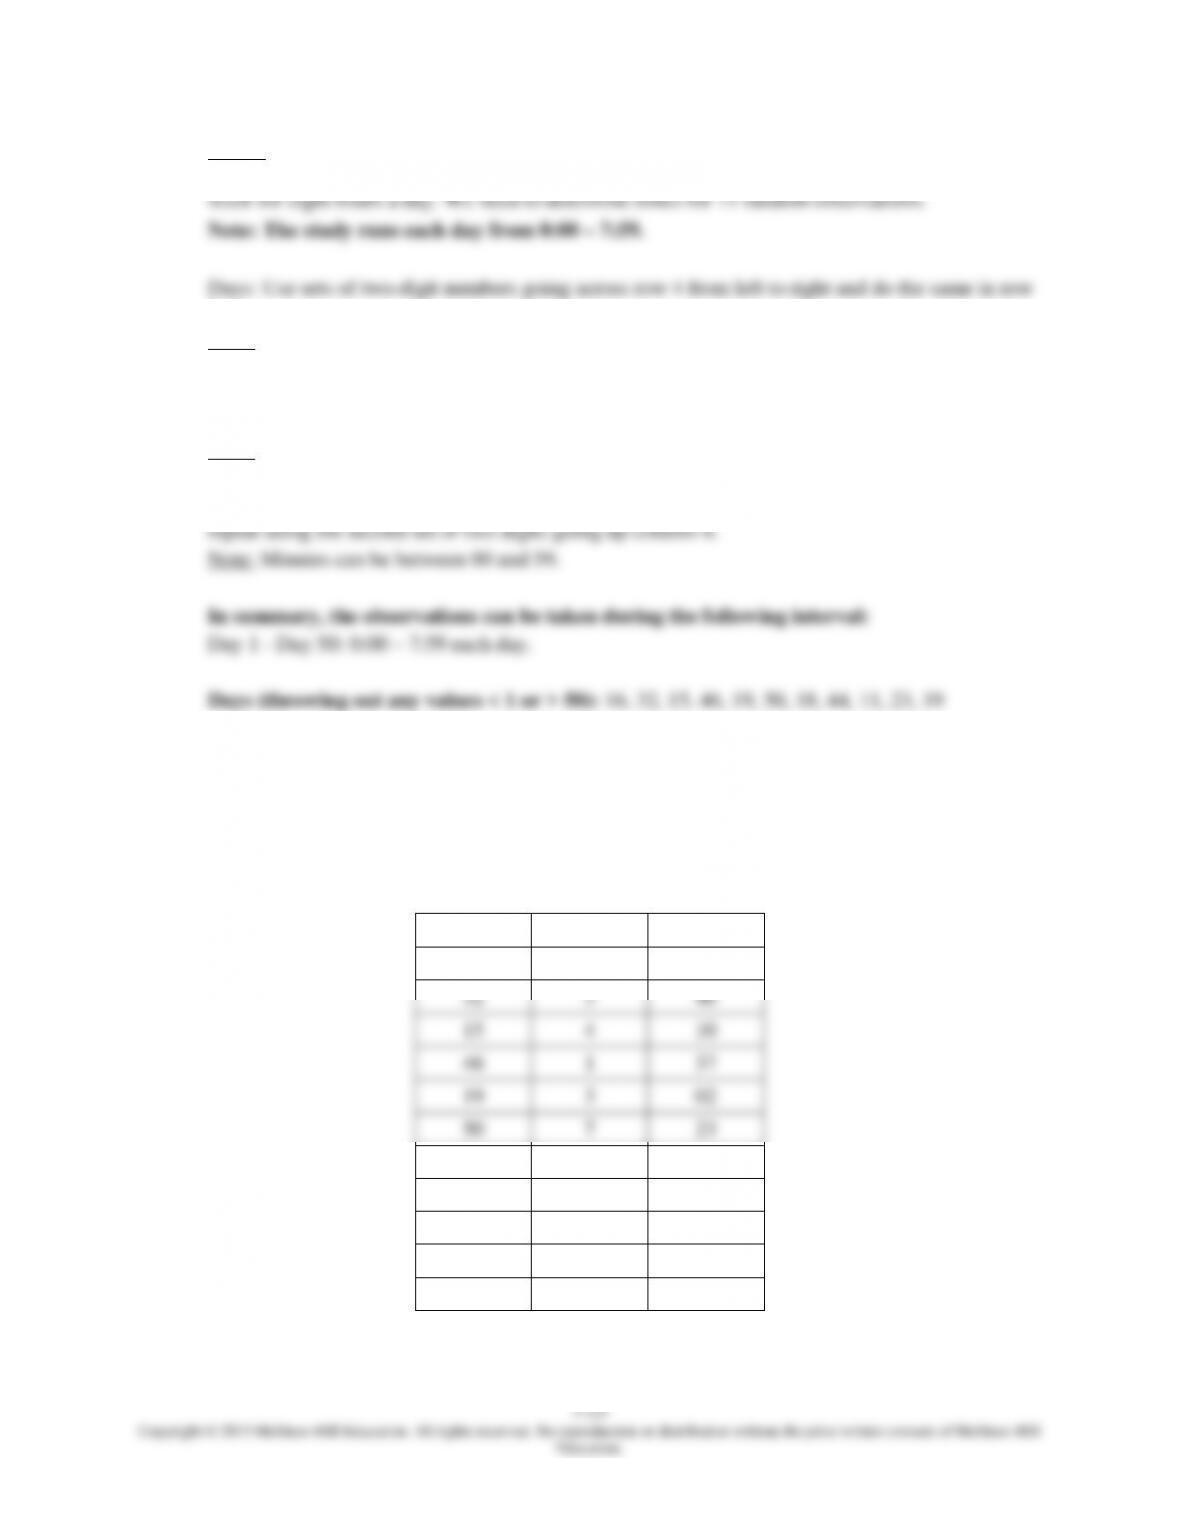
17. Given: Use the random number table in Chapter 7 to design a schedule of work sampling
observations in which eight observations are made during one eight-hour day.
Note: The study runs each day from 0:00 – 7:59.
Hours: Looking at the table, use column 4 to obtain the hour of each observation. Beginning at
the top of column 4, use the last digit of each four-digit number going down column 4 for the
hour.
Note: Hours can be between 0 and 7.
Throwing out values leaves: 47, 15, 24, 27, 26, 38, 56, 00.
Combining Hours & Minutes gives:
1:47, 7:15, 4:24, 4:27, 6:26, 3:38, 1:56, 1:00.
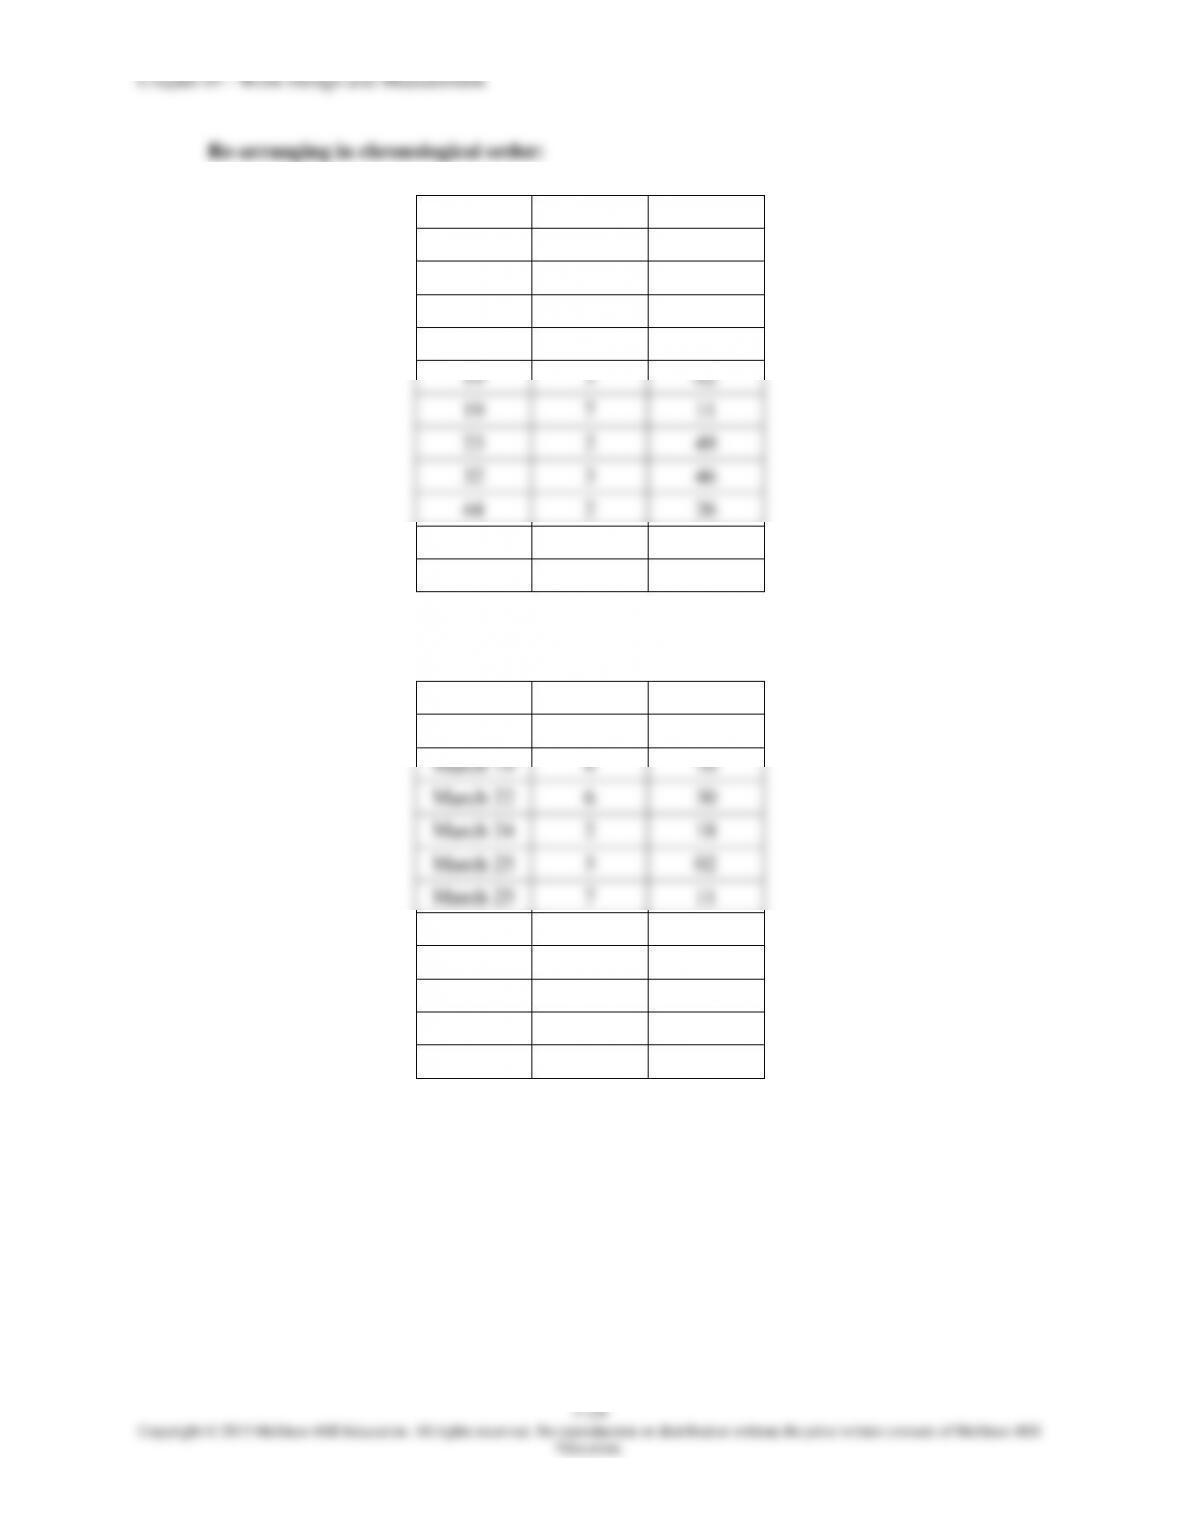
Re-arranging in chronological order:
Observation Time
1 1:00
2 1:47
3 1:56
6 4:27
Chapter 07 – Work Design and Measurement
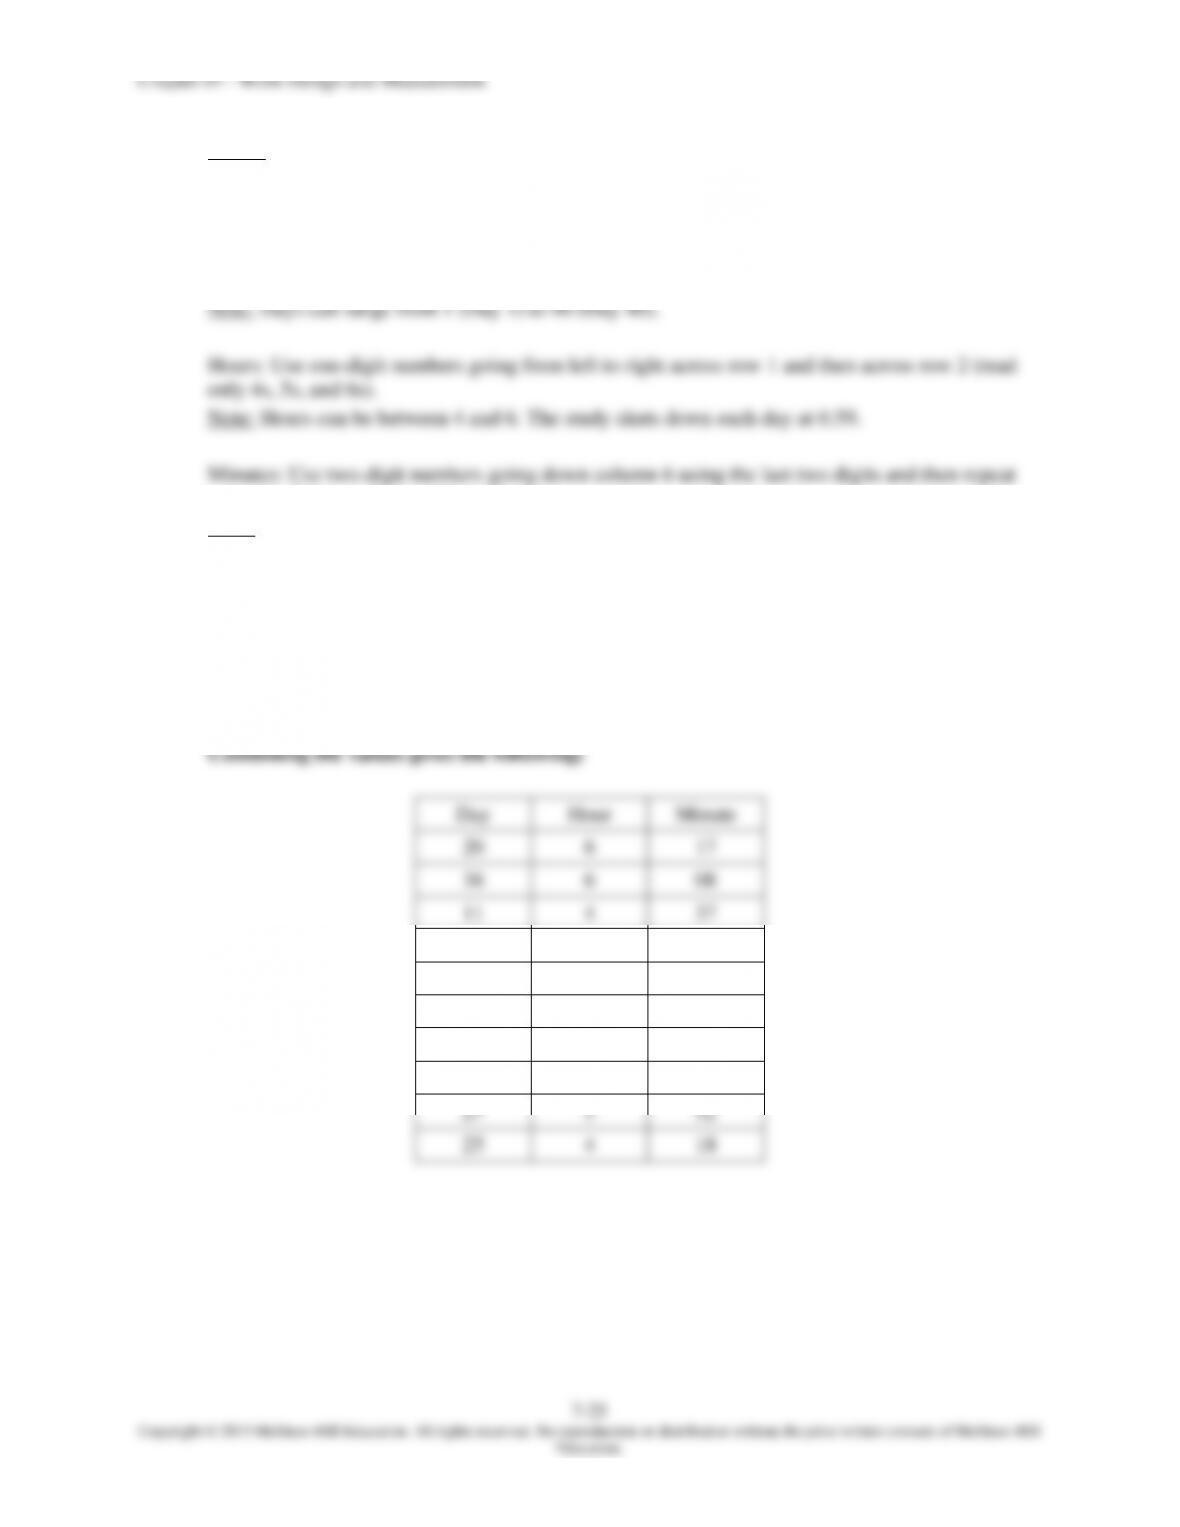
18. Given: The manager of a large office wants to conduct a work sampling of the time staff spends
on the telephone. The observations will be taken over 50 workdays. The office is open five days a
5.
Note: Days can range from 1 (Day 1) to 50 (Day 50).
Hours: Use one-digit numbers going down, using the first digit of column 1 and then do the same
in column 2.
Note: Hours can be between 0 and 7.
Minutes: Use two-digit numbers going up column 4 using the first set of two digits and then
Hours (throwing out any values > 7): 6, 3, 4, 1, 3, 7, 2, 2, 0, 2, 7
Minutes (throwing out any values > 59): 30, 46, 10, 37, 02, 23, 18, 26, 39, 49, 11
Combining the values gives the following:
Day
Hour
Minute
16
6
30
32
3
46
15
4
10
46
1
37
19
3
02
50
7
23
18
2
18
44
2
26
11
0
39
23
2
49
19
7
11
7-24
Copyright © 2015 McGraw-Hill Education. All rights reserved. No reproduction or distribution without the prior written consent of McGraw-Hill
Education.
Day
Hour
Minute
11
0
39
15
4
10
16
6
30
18
2
18
19
3
02
19
7
11
23
2
49
32
3
46
44
2
26
46
1
37
50
7
23
Schedule for March, April, May (March 1, a Monday, is Day 1)
Day
Hour
Minute
March 15
0
39
March 19
4
10
March 22
6
30
March 24
2
18
March 25
3
02
March 25
7
11
March 31
2
49
April 13
3
46
April 29
2
26
May 3
1
37
May 7
7
23
Chapter 07 – Work Design and Measurement
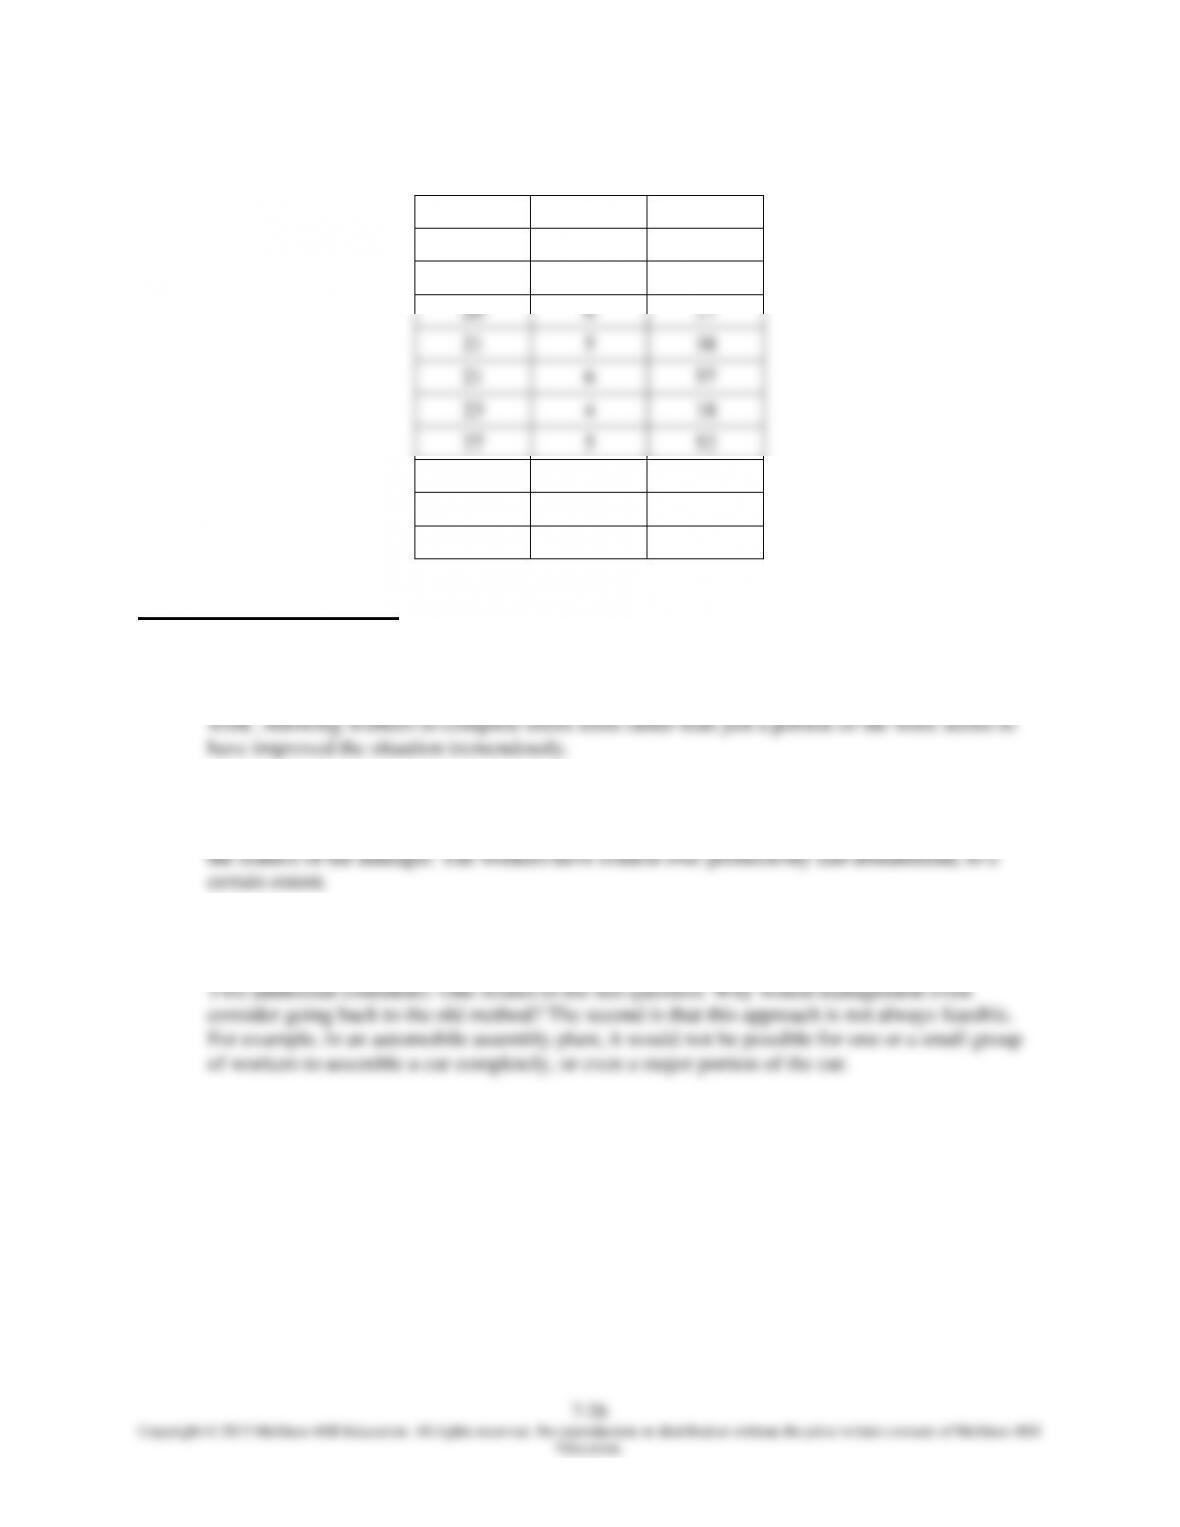
Re-arranging in chronological order:
Day
Hour
Minute
01
4
44
11
4
37
20
6
17
21
5
38
21
6
57
23
4
18
27
5
52
38
6
08
39
4
18
40
5
07
Case: Making Hotplates
The case illustrates some benefits of job enlargement.
1. Originally, workers were bored and morale was low, apparently because of the specialization of
2. Because workers were better able to identify with the final product, they became more interested
in their work, and hence, absenteeism decreased and morale increased.
3. The major change involved giving each worker a greater share of the overall task. This was under
4. If they were to return to the old assembly line, it is conceivable that morale and productivity
would be even lower than before. Once the workers had a taste of the new method, they would
dislike the former setup even more.