Chapter 06 – Process Selection and Facility Layout
6-41
Education.
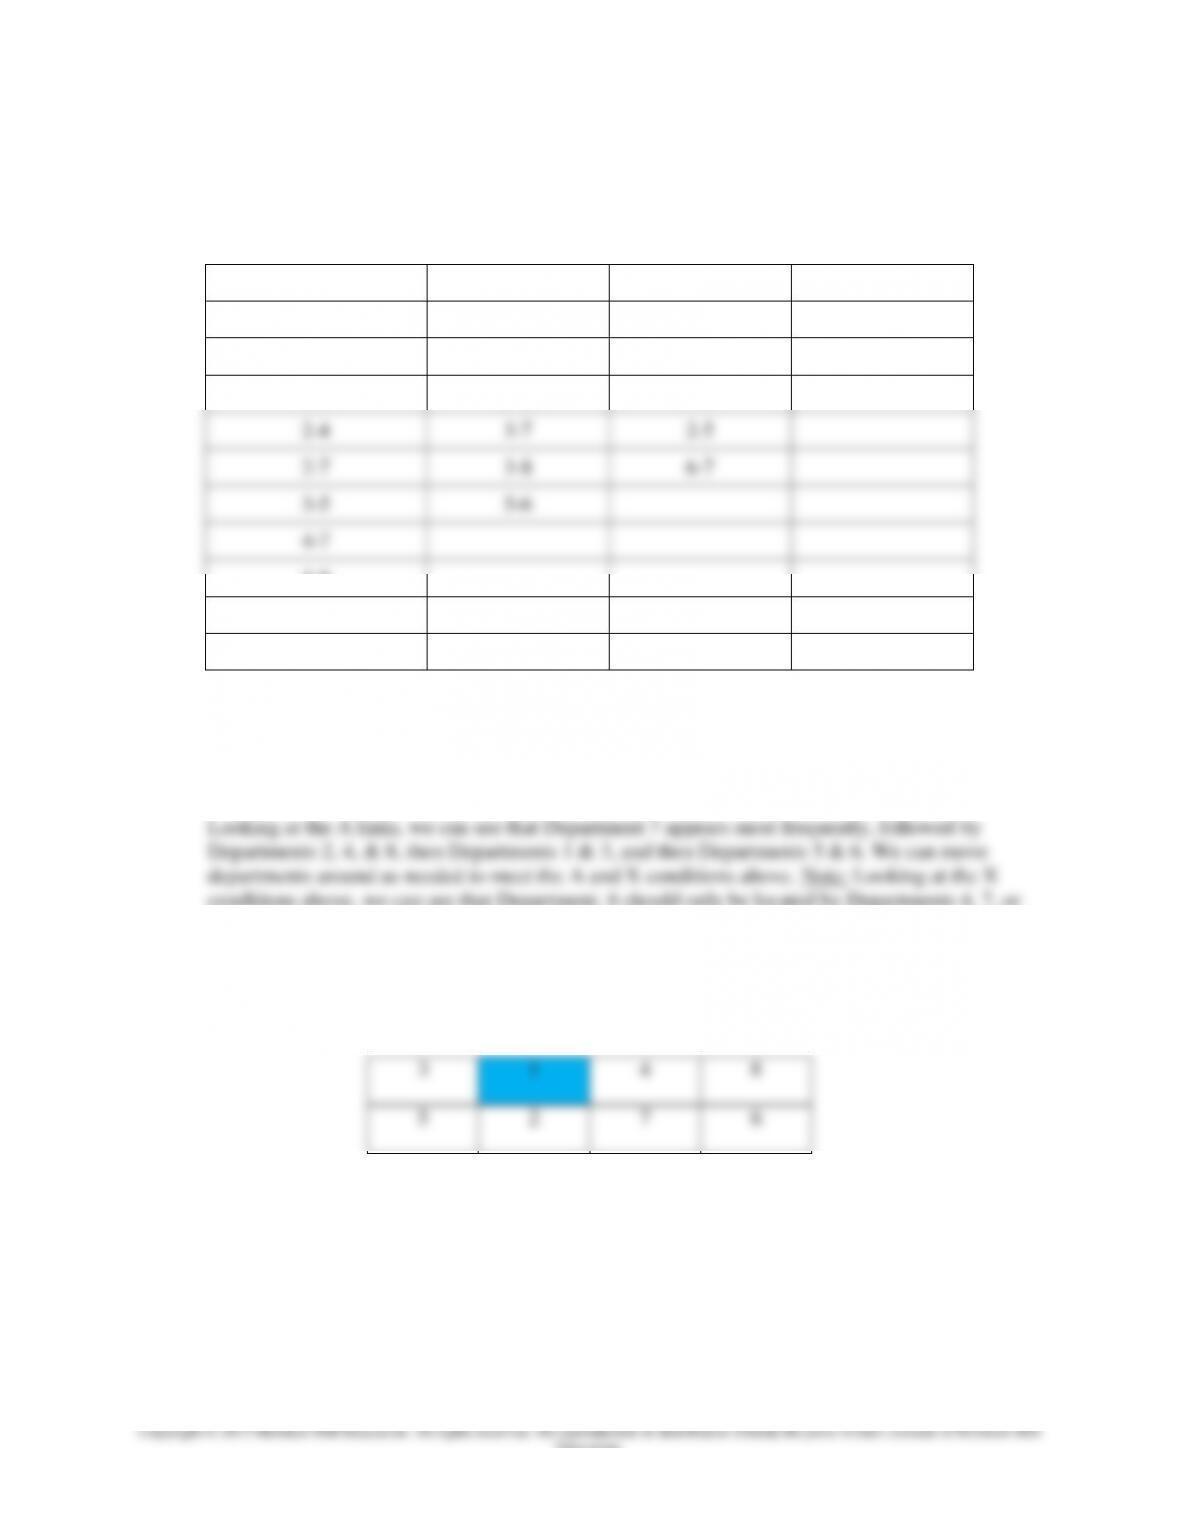
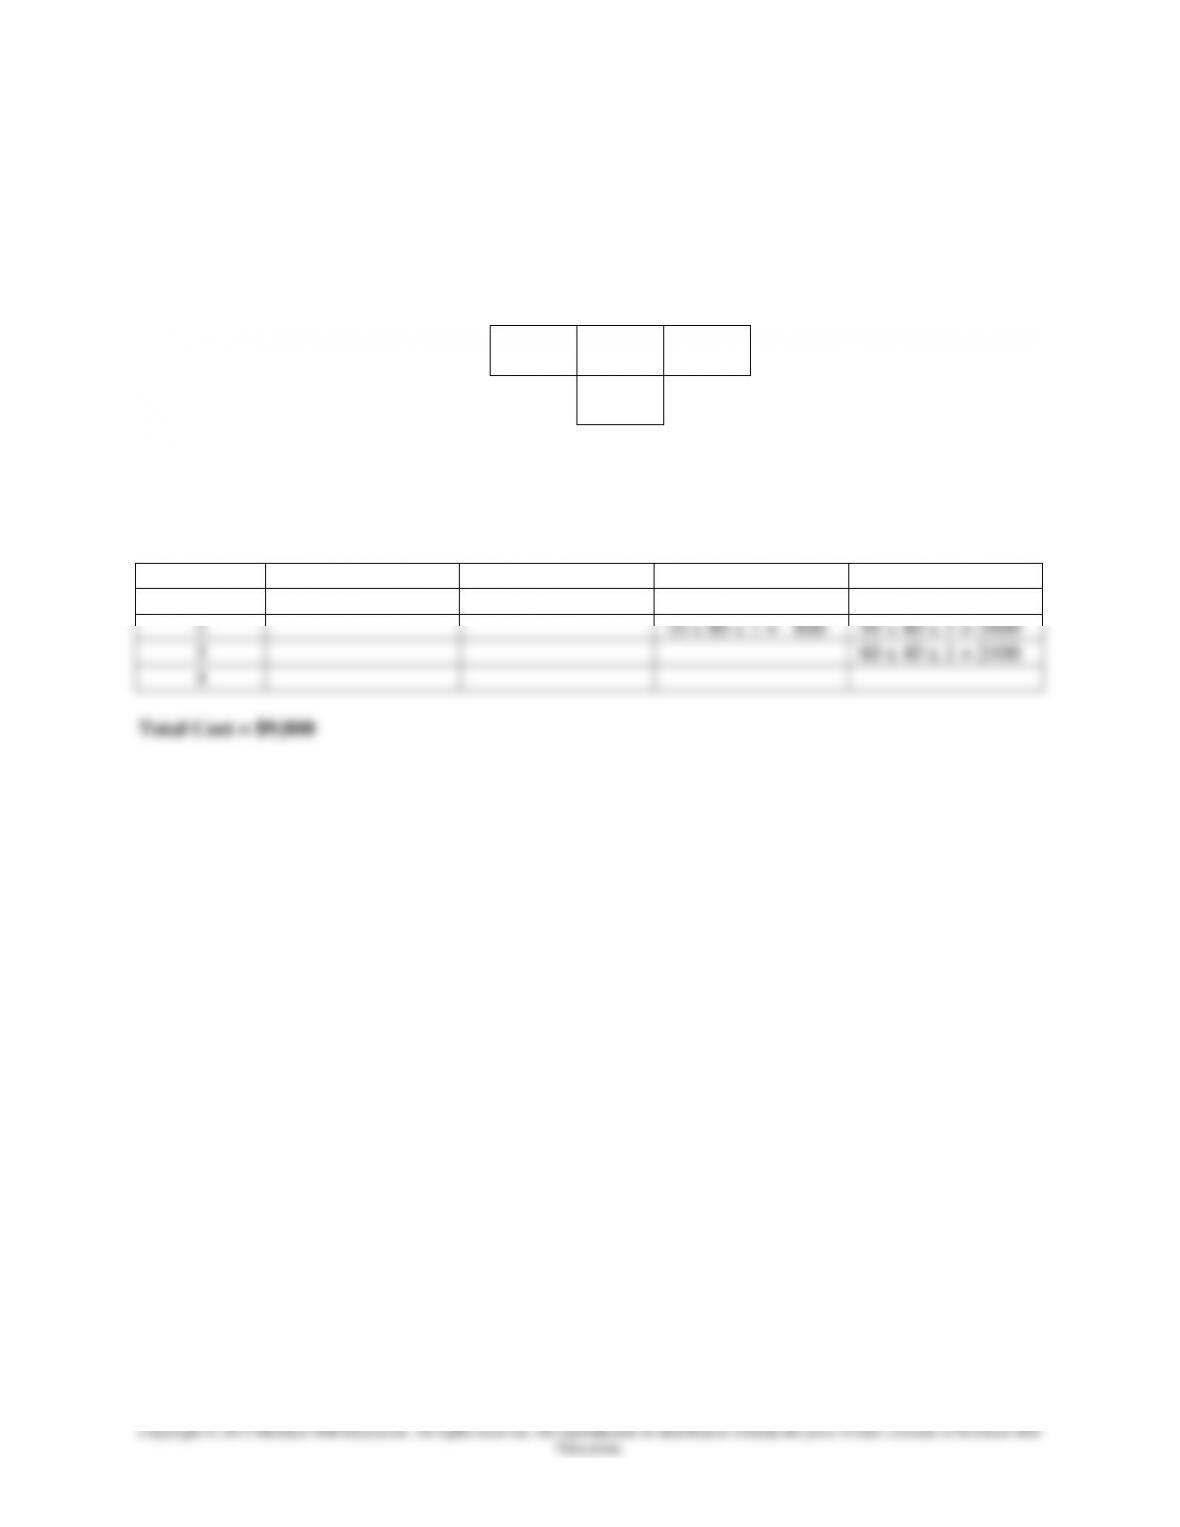
12. Arrange the departments into a 2 x 4 grid. Department 1 must be located in the shaded location.
First, we transfer the Muther grid information to a table as shown below:
A Links
X Links
E Links
I Links
1-3
1-6
1-2
4-6
1-7
2-6
1-4
2-3
3-6
1-5
2-4
3-7
2-5
2-7
3-8
6-7
3-5
5-6
4-7
4-8
6-8
7-8
Rather than drawing clusters, we can start with a blank layout and then try to satisfy the A
and X conditions above. After that, we can shift departments around to satisfy E conditions
followed by I conditions.
conditions above, we can see that Department. 6 should only be located by Departments 4, 7, or
8. We can shift departments more if needed using trial and error to meet E conditions and then I
conditions.
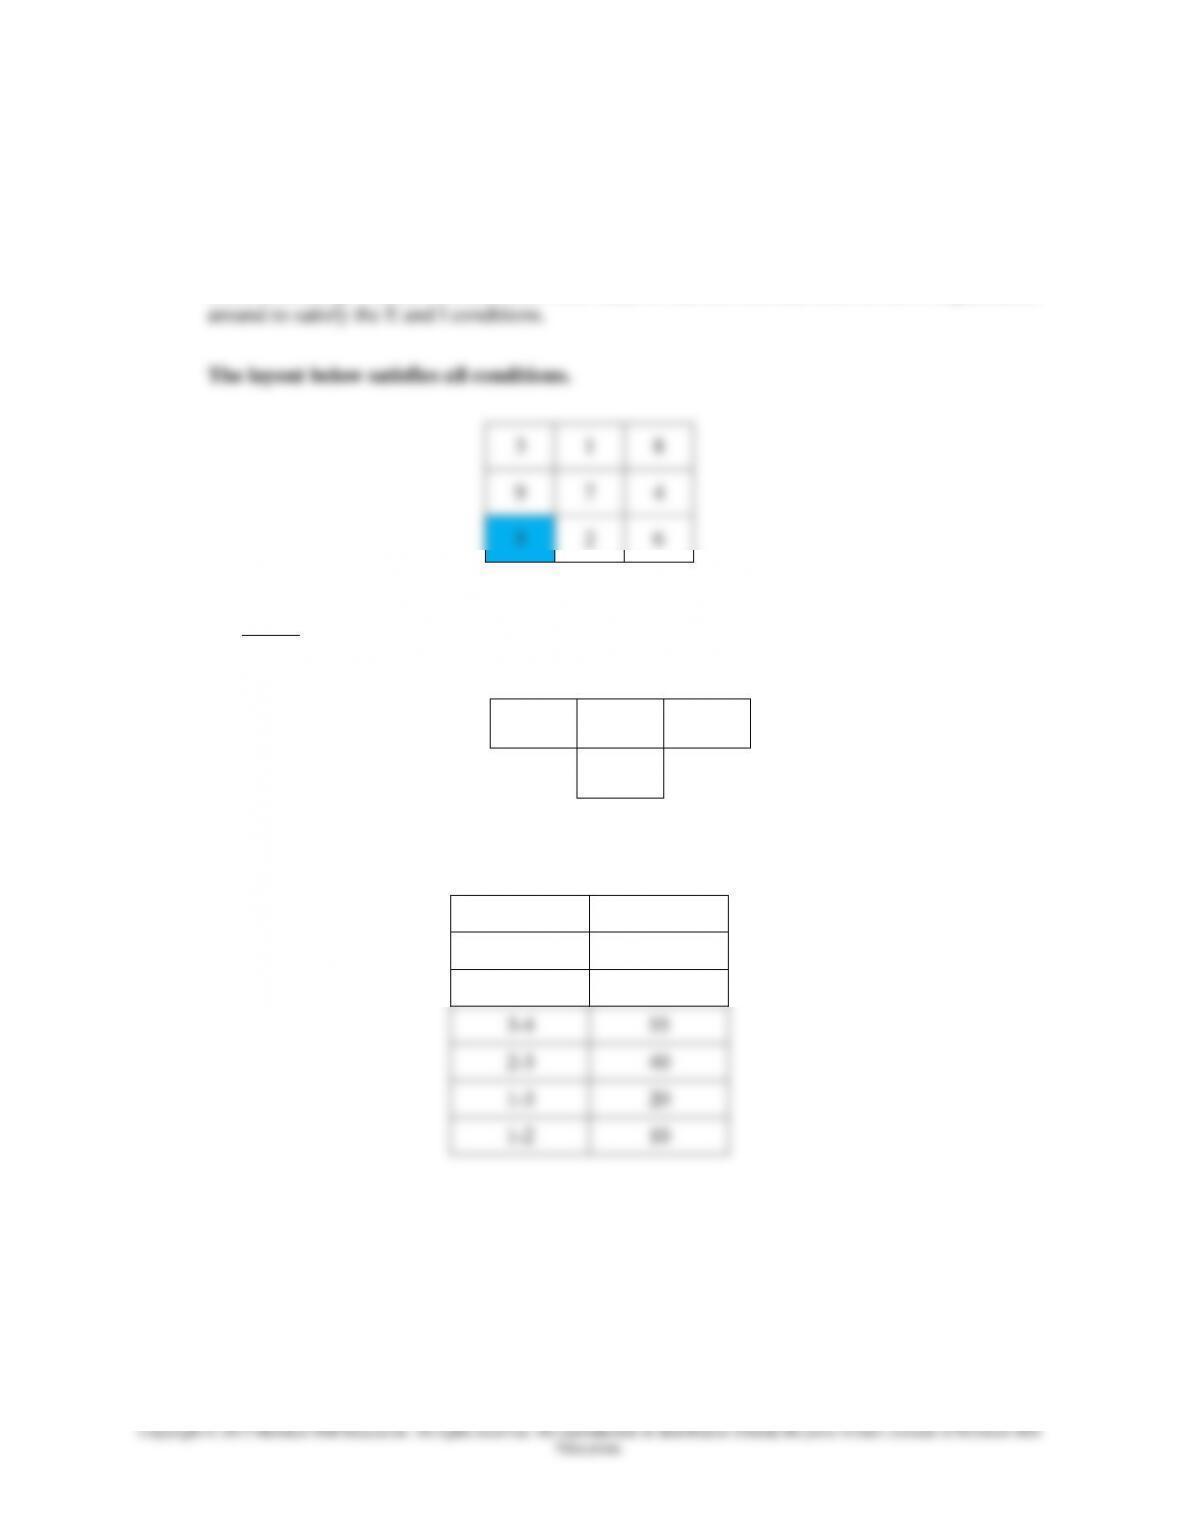
The layout below meets all conditions. The next page shows all of the possible layouts
that meet all conditions.
3
1
4
8
5
2
7
6
Chapter 06 – Process Selection and Facility Layout
6-42
Education.
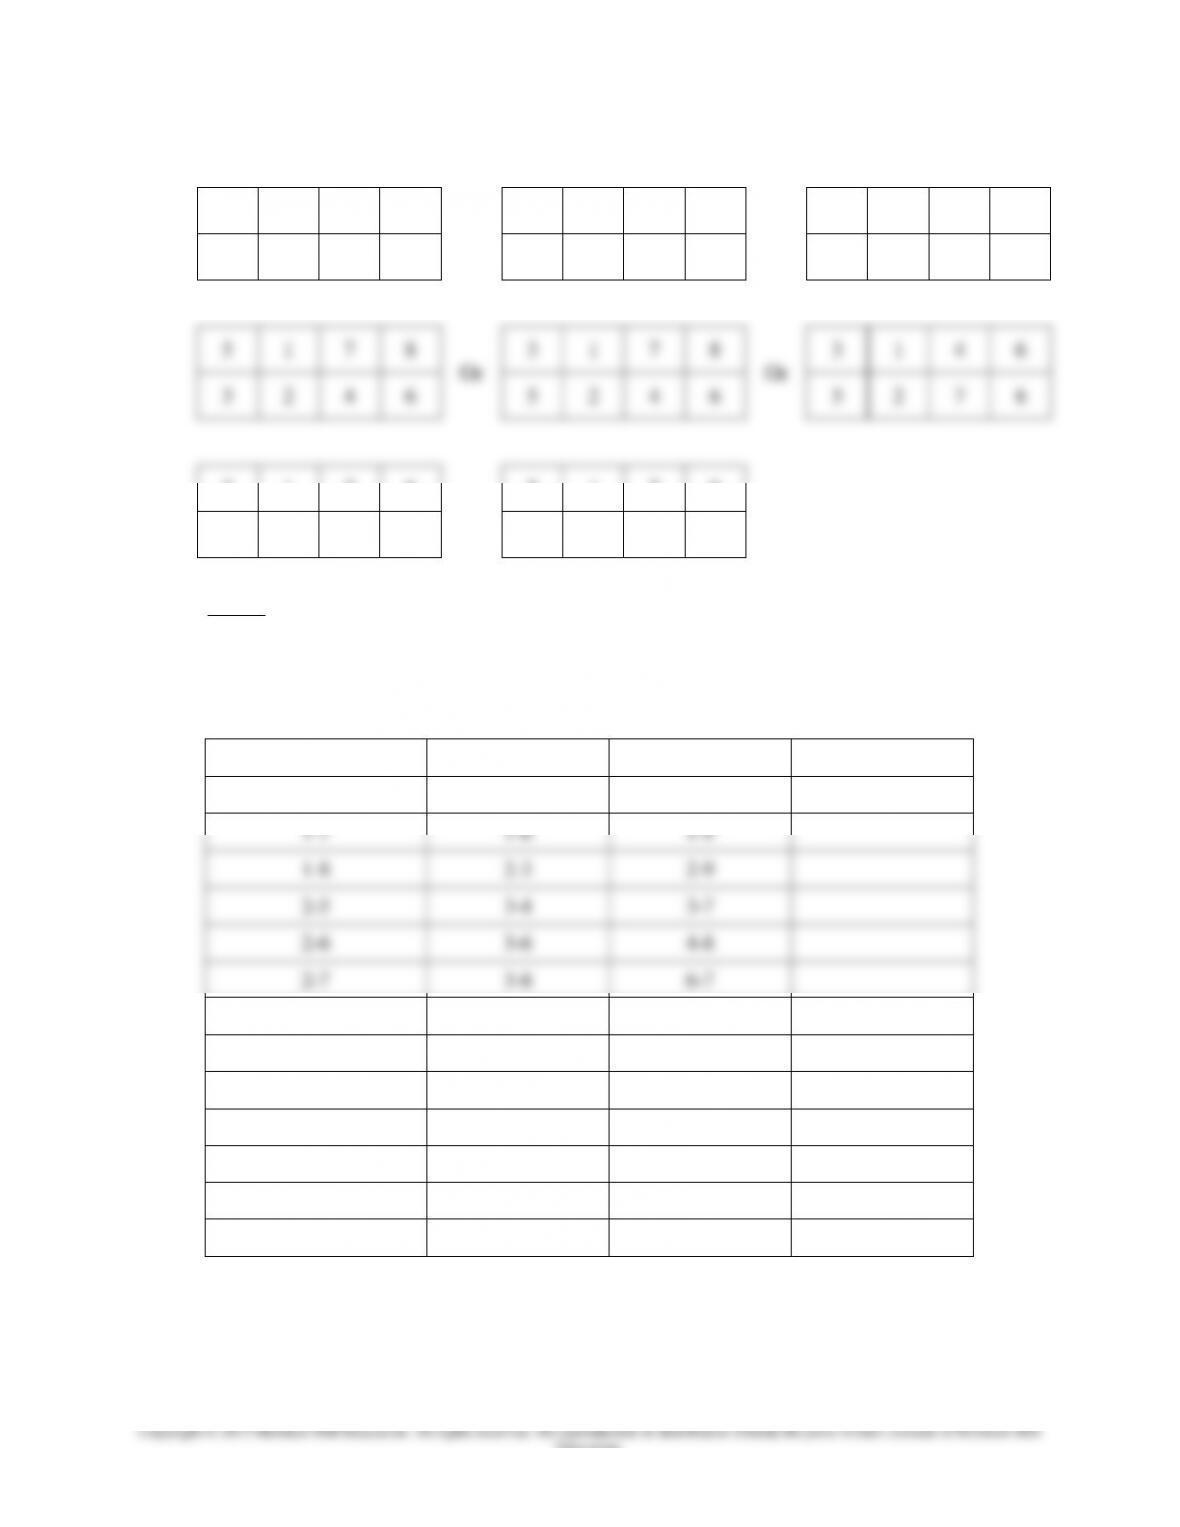
All possible layouts for Problem 12:
3
1
4
8
Or
5
1
4
8
Or
5
1
4
6
5
2
7
6
3
2
7
6
3
2
7
8
5
1
7
8
Or
3
1
7
8
Or
3
1
4
6
3
2
4
6
5
2
4
6
5
2
7
8
3
1
7
6
Or
5
1
7
6
5
2
4
8
3
2
4
8
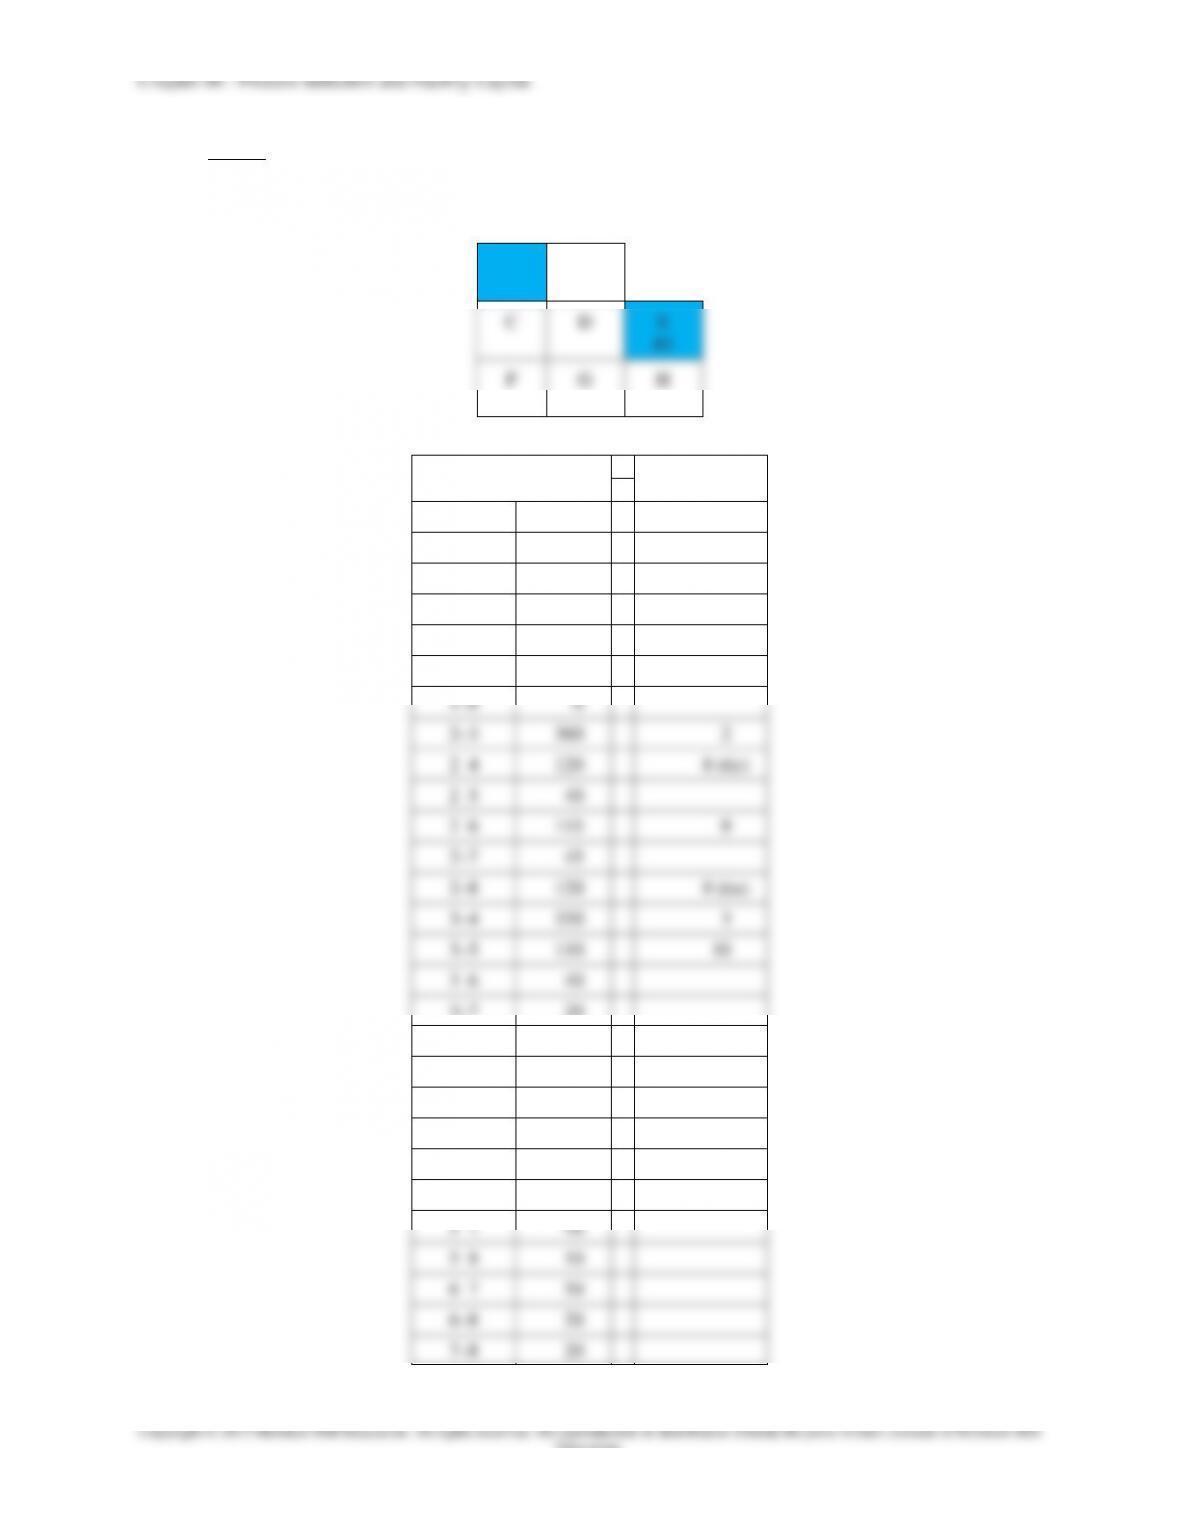
13. Given: We must arrange departments in a 3 x 3 grid, and Department 5 must be located in the
lower left corner (shown in the shaded area in the layout).
We start by placing the Muther grid information into a table.
A Links
X Links
E Links
I Links
1-3
1-2
1-4
2-4
1-7
1-6
1-9
1-8
2-3
2-9
2-5
3-4
3-7
2-6
3-6
4-8
2-7
3-8
6-7
3-9
4-5
4-6
4-9
4-7
5-6
5-7
5-8
5-9
6-9
7-8
8-9
7-9
Chapter 06 – Process Selection and Facility Layout
Looking at the A links, we can see that that Department 7 appears most frequently followed by
Departments 1, 2, 5, & 9, and then Departments 3, 4, 6, & 8.
Department 7 is a good candidate for a central location. Then, we satisfy the remaining A
conditions along with the X conditions. After that, we can use trial and error to move departments
Chapter 06 – Process Selection and Facility Layout
6-44
From this, we can see that Departments 2 and 4 have the greatest interdepartmental workflow, so
they should be close, perhaps at Locations C and B. Next, we can see that the workflows for
Departments 1 and 4, and Departments 3 and 4 are high. Therefore, Department 4 has to be
located at a central location (Location B), while Department 2 is in Location C, Department 1 is
in Location A, and Department 3 is in Location D as shown below.
A
#1
B
#4
C
#2
D
#3
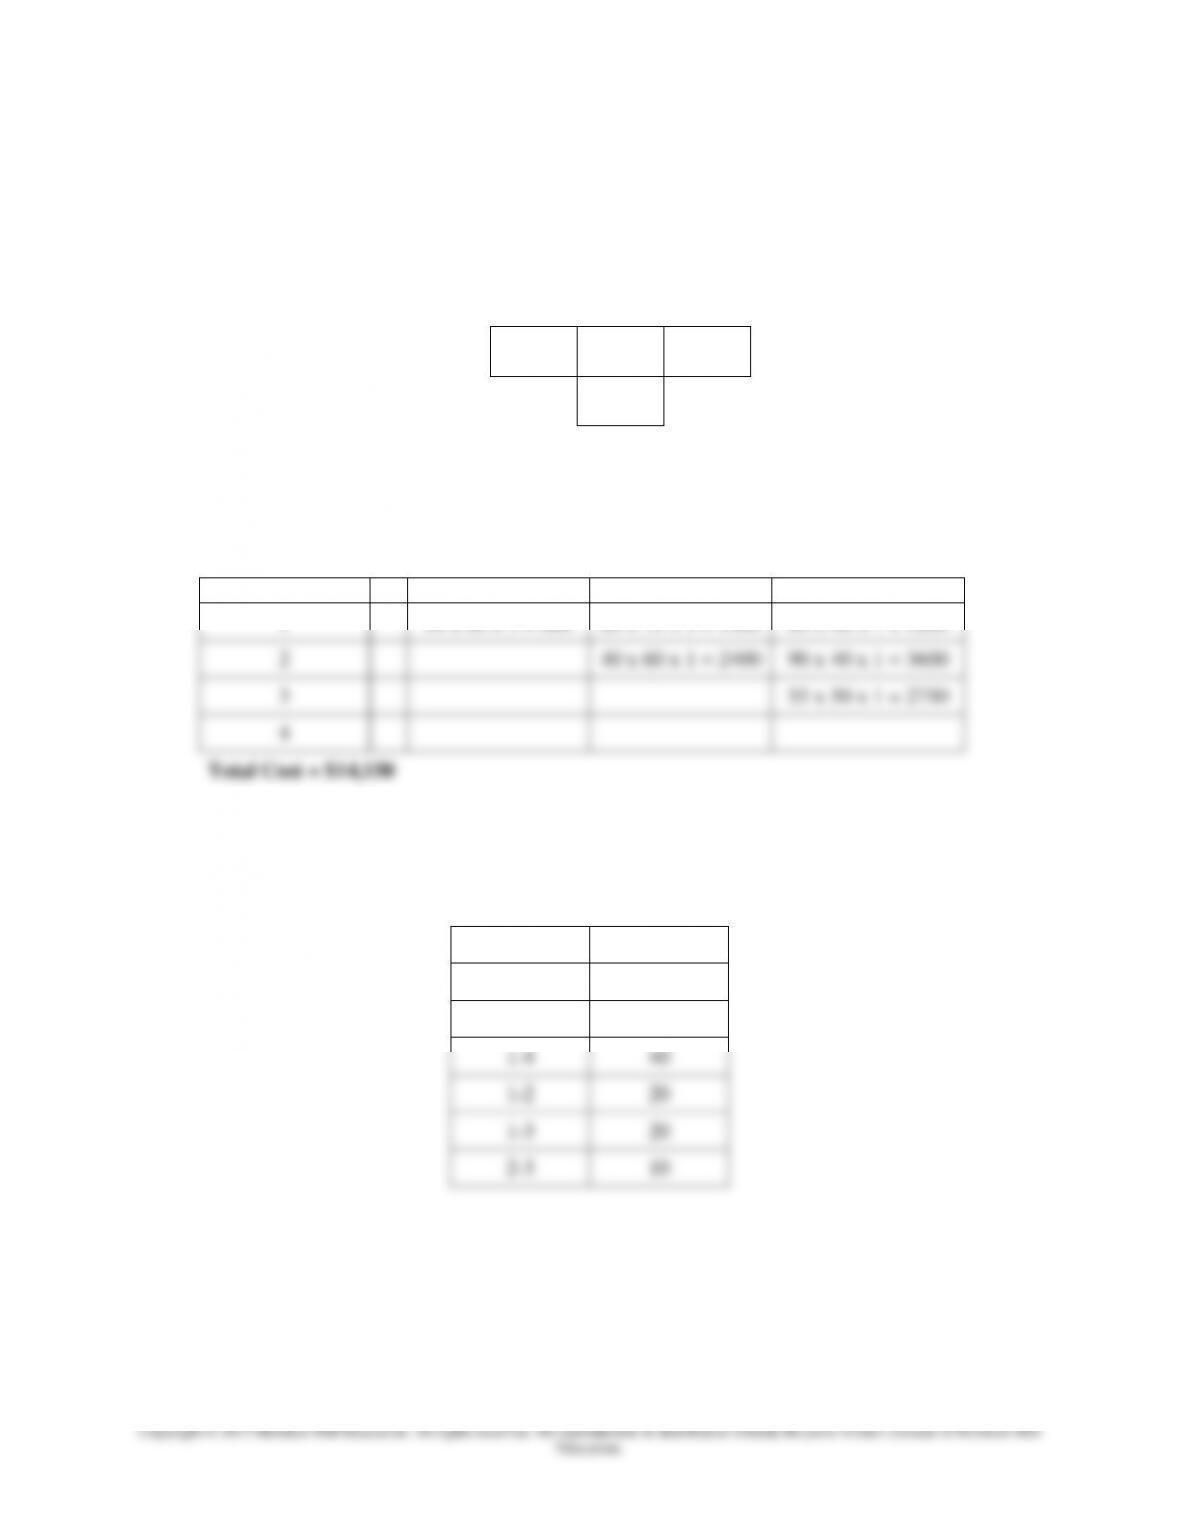
Second, we must determine the cost for each department pair by multiplying Number of Trips
x Distance x $1.
Number of Trips x Distance x Cost ($1)
Department
1
2
3
4
1
10 x 80 x 1 = 800
20 x 70 x 1 = 1400
80 x 40 x 1 = 3200
2
40 x 60 x 1 = 2400
90 x 40 x 1 = 3600
3
55 x 50 x 1 = 2750
4
Total Cost = $14,150
b. Revised layout given the new number of trips between departments.
First, we rank or arrange the number of trips between departments from high to low.
Dept. Pair
# of Trips
3-4
60
2-4
50
1-4
40
1-2
20
1-3
20
2-3
10
Chapter 06 – Process Selection and Facility Layout
6-45
From this, we can see that Departments 3 and 4 have the greatest interdepartmental workflow, so
they should be close, perhaps at Locations C and B. Next, we can see that the workflows for
Departments 2 and 4, and Departments 1 and 4 are high. Therefore, Department 4 has to be
located at a central location (Location B), while Department 2 is in Location A, and Department 1
is in Location D.
Second, we must determine the cost for each department pair by multiplying Number of Trips
x Distance x $1.
Number of Trips x Distance x Cost ($1)
Department
1
2
3
4
1
20 x 70 x 1 = 1400
20 x 60 x 1 = 1200
40 x 50 x 1 = 2000
2
10 x 80 x 1 = 800
50 x 40 x 1 = 2000
3
60 x 40 x 1 = 2400
4
Total Cost = $9,800
A
#2
B
#4
C
#3
D
#1
6-46
Education.
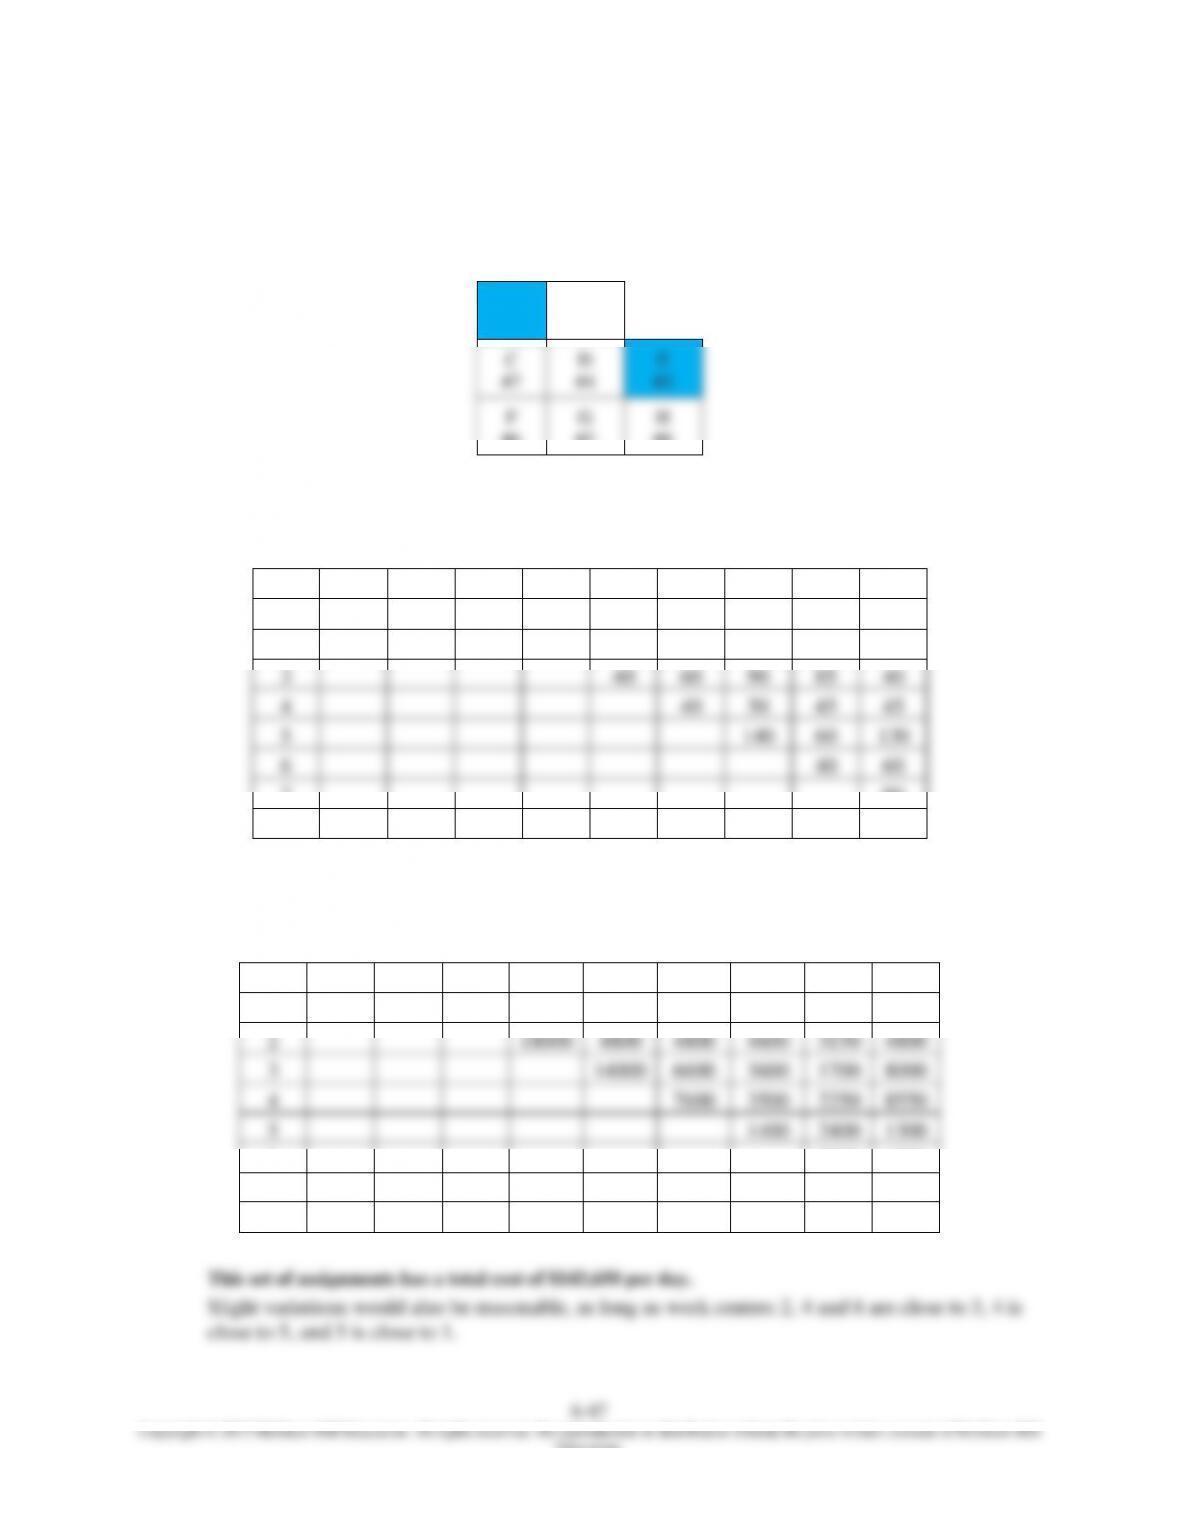
15. Given: Work centers 1 & 3 must be positioned in the diagram below as shown in the shaded
areas. We have 8 work centers that we must arrange in the layout. Transportation costs are $1 per
load per meter. Assume that reverse distances are the same.
C
D
E
First, we will assign work center pairs based on ranking them by number of trips between them.
No. of Trips
Between
Order of
Assignment
1–2
10
1–3
5
1–4
90
11
1–5
370
1
1–6
135
6
1–7
125
7
1–8
0
2–3
360
2
2–4
120
8 (tie)
2–5
40
2–6
115
9
2–7
45
2–8
120
8 (tie)
3–4
350
3
3–5
110
10
3–6
40
3–7
20
3–8
200
4
4–5
190
5 (tie)
4–6
70
12
4–7
50
4–8
190
5 (tie)
5–6
10
5–7
40
5–8
10
6–7
50
6–8
20
7–8
20
A
#1
B
F
G
H
Chapter 06 – Process Selection and Facility Layout
Education.
From this, we can see that work centers 1-5 have the highest number of trips between them,
followed by work centers 2-3, 3-4, 3-8, 4-5, 4-8, 1-6, 1-7, 2-4, 2-8, etc.
A reasonable (intuitive) set of assignments is:
C
#7
D
#4
E
#3
The distance (in meters) between work centers for this option is shown below:
From
To
1
2
3
4
5
6
7
8
1
100
120
60
40
80
40
110
2
50
40
120
40
70
40
3
40
60
90
85
40
4
40
50
45
45
5
140
60
130
6
40
60
7
90
8
Then, for each work center pair, we must multiply Number of Trips x Distance x $1.
Number of Trips x Distance x $1
From
To
1
2
3
4
5
6
7
8
1
1000
600
5400
14800
10800
5000
0
2
18000
4800
4800
4600
3150
4800
3
14000
6600
3600
1700
8000
4
7600
3500
2250
8550
5
1400
2400
1300
6
2000
1200
7
1800
8
A
#1
B
#5
F
#6
G
#2
H
#8
Chapter 06 – Process Selection and Facility Layout
6-48
Education.
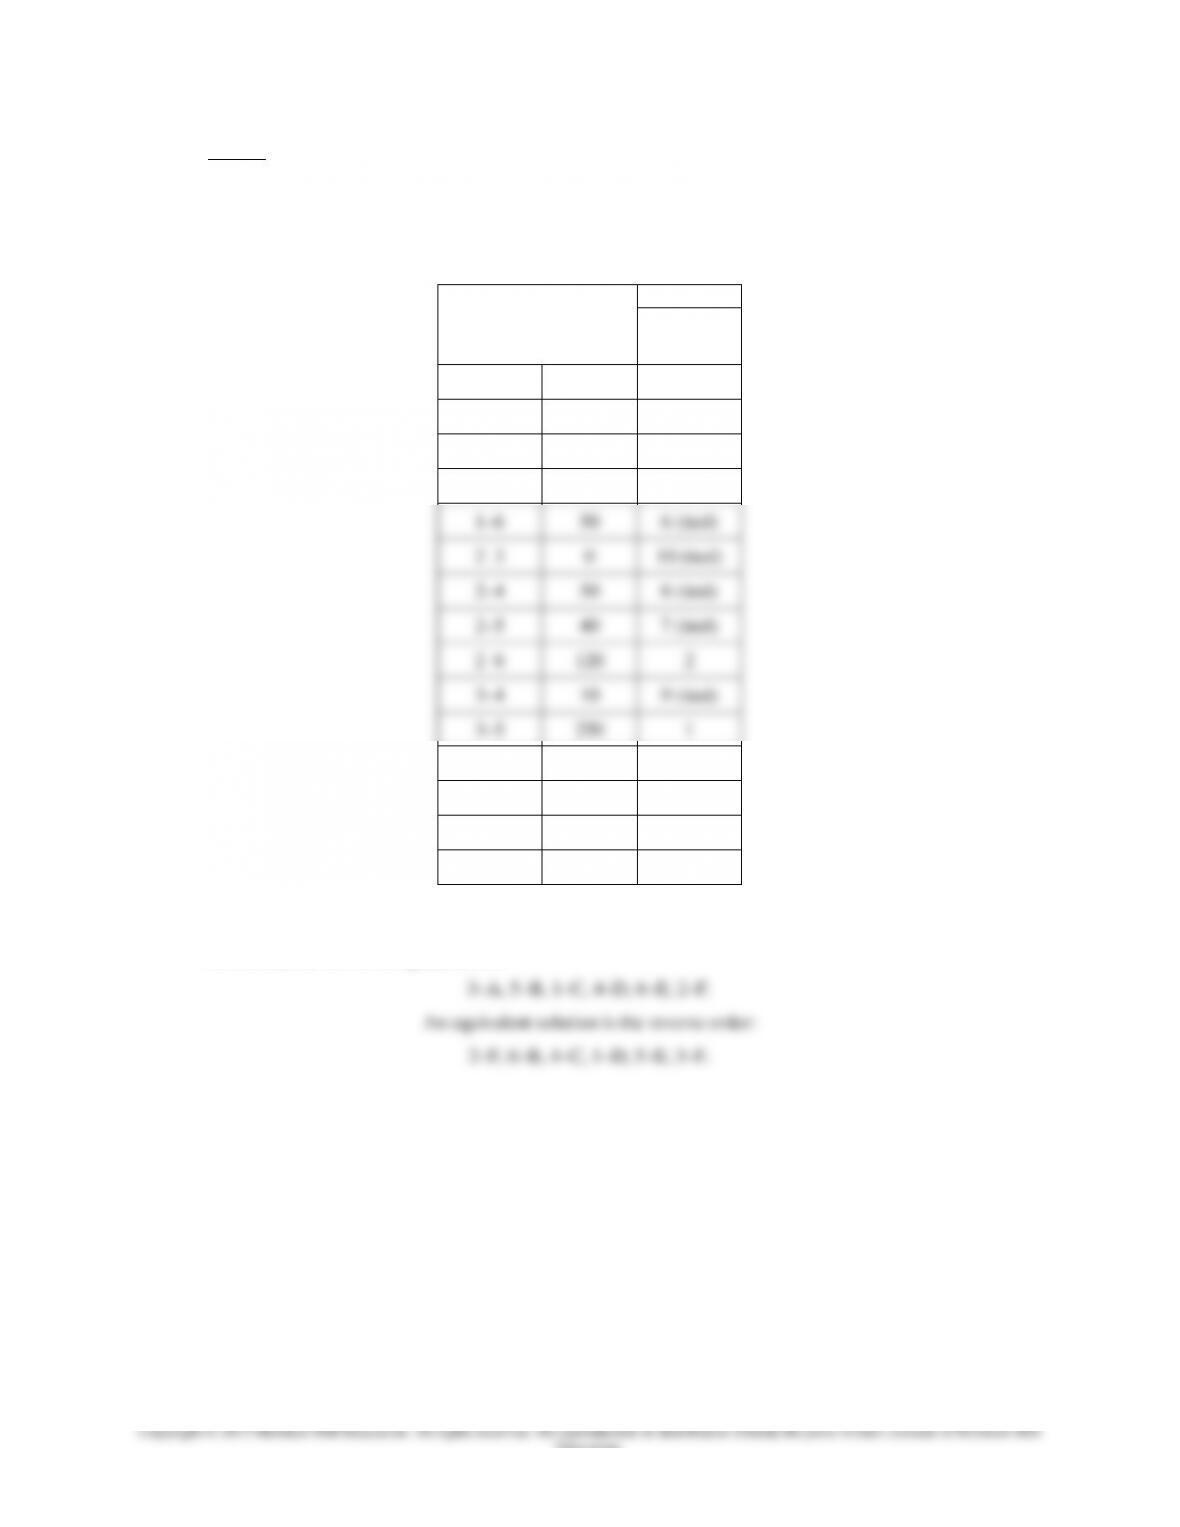
16. Given: Distance between the reception area and each potential location (A, B, C, D, E, & F) = 35
feet. The reception area must remain in the central location; therefore, we can omit the reception
area from our analysis.
First, we will list the department pairs and the number of trips between them.
No. of Trips
Between
Order of
Assignment
1–2
0
10
1–3
40
7 (tied)
1–4
110
3
1–5
80
5
1–6
50
6 (tied)
2–3
0
10 (tied)
2–4
50
6 (tied)
2–5
40
7 (tied)
2–6
120
2
3–4
10
9 (tied)
3–5
250
1
3–6
10
9 (tied)
4–5
40
7 (tied)
4–6
90
4
5–6
20
8
Second, we will assign departments based on ranking the number of trips between departments.
A reasonable set of assignments is:
3–A, 5–B, 1–C, 4–D, 6–E, 2–F.
An equivalent solution is the reverse order:
2–F, 6–B, 4–C, 1–D, 5–E, 3–F.