Chapter 05 – Strategic Capacity Planning for Products and Services
5–11
8.
Given:
Source
FC
v
Internal 1
$200,000
$17
Internal 2
240,000
14
Vendor A
20 up to 30,000 units
Vendor B
22 for 1 to 1,000; 18 each if larger amount
Vendor C
21 for 1 to 1,000; 19 each for additional units
a.
TC for 10,000 units
TC for 20,000 units
Int. 1: 200,000 + 17(10,000) = $370,000
200,000 + 17(20,000) = $540,000
Int. 2: 240,000 + 14(10,000) = $380,000
240,000 + 14(20,000) = $520,000
Vend A: 20(10,000) = $200,000
20(20,000) = $400,000
Vend B: 18(10,000) = $180,000
18(20,000) = $360,000
Vend C: 21,000 + 19(9,000) = $192,000
21,000 + 19(19,000) = $382,000
b. Given:
Cost functions for each alternative:
Internal 1: $200,000 + $17Q
Internal 2: $240,000 + $14Q
Vendor A: $20Q (Q ≤ 30,000)
Vendor B: $22Q (Q ≤ 1,000) $18Q for all units when Q > 1,000
Vendor C: $21Q (Q ≤ 1,000) $21Q + $19(Q – 1,000) when Q > 1,000
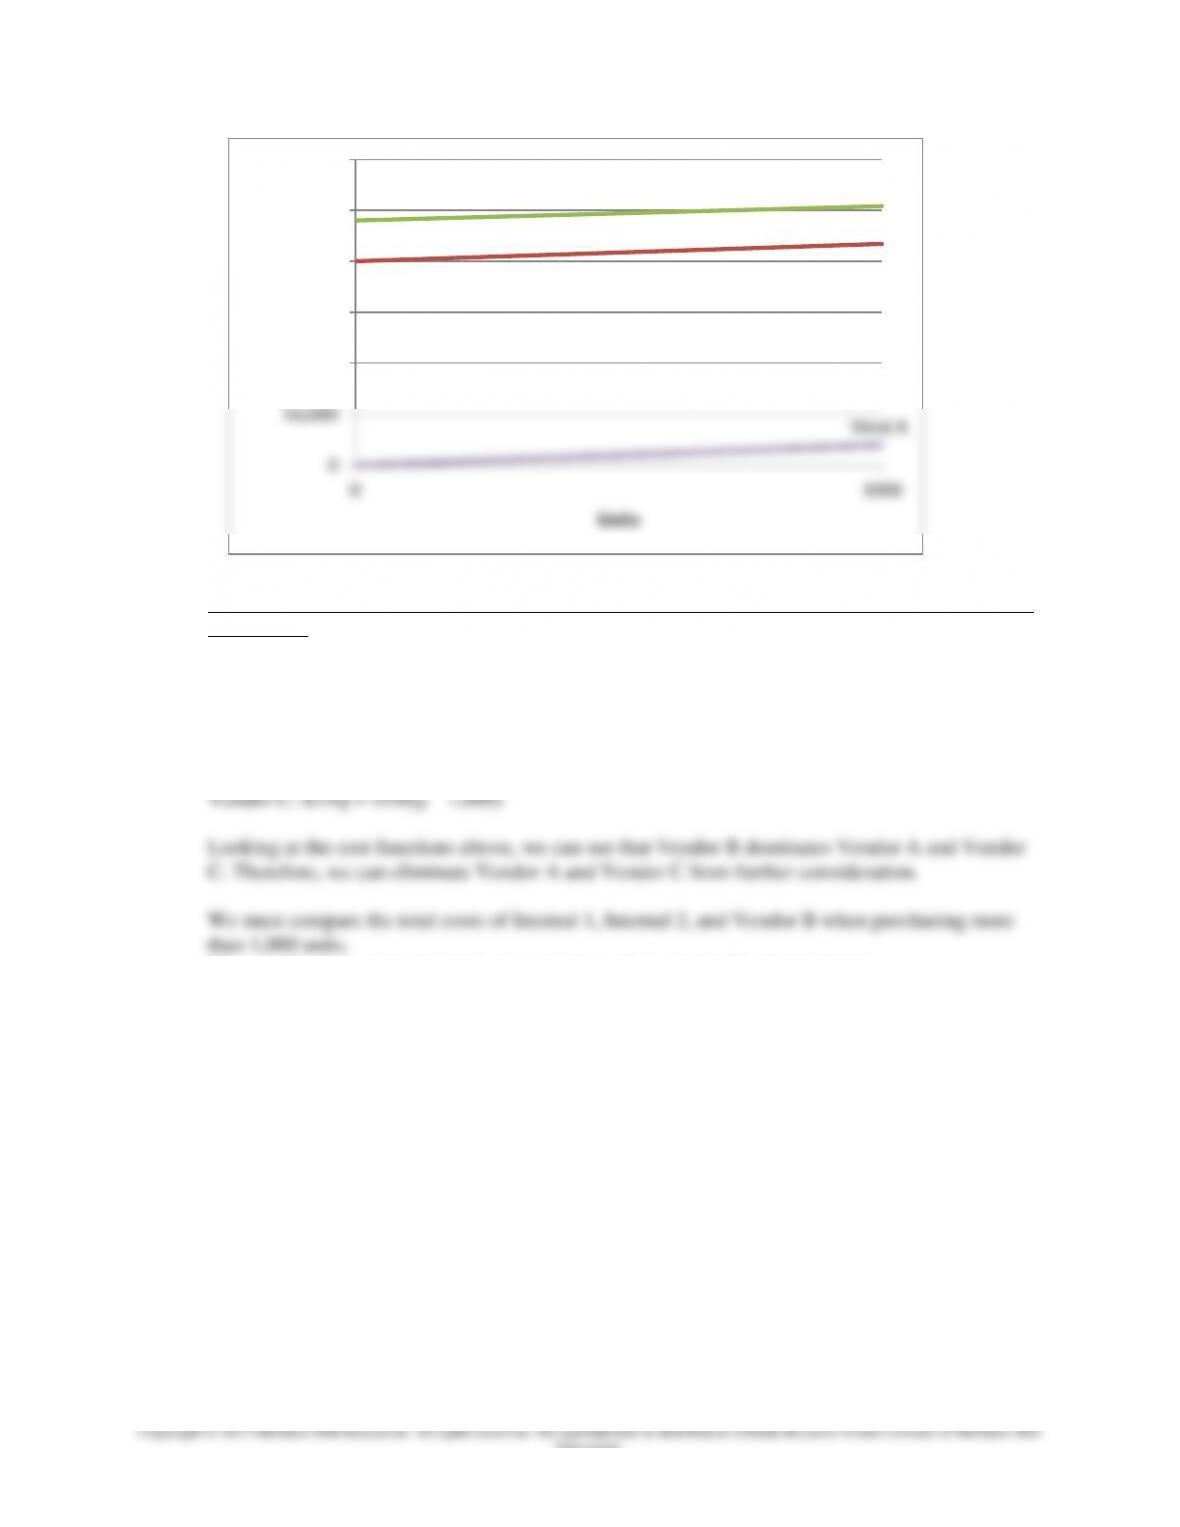
First, we analyze the range of 1 – 1,000 units:
Vendor A exhibits lower total cost over this range than do Vendor B and Vendor C; therefore,
we can eliminate Vendors B & C from consideration for this range.
Next, we could graph the costs functions of the remaining three options for the range of 1 –
Chapter 05 – Strategic Capacity Planning for Products and Services
5–12
Education.
Second, we analyze the range of 1,001 units or more to determine the total costs if we purchase >
1,000 units:
Total Cost Functions (when purchasing 1,001 units or more):
Internal 1: $200,000 + $17Q
Internal 2: $240,000 + $14Q
Vendor A: $20Q (≤ 30,000 units)
Vendor B: $18Q
We can plot these costs functions on a graph as shown in the Excel chart below:
Int. 1
Int. 2
Vend A
0
50,000
100,000
150,000
200,000
250,000
300,000
0 1000
$
Units
Chapter 05 – Strategic Capacity Planning for Products and Services
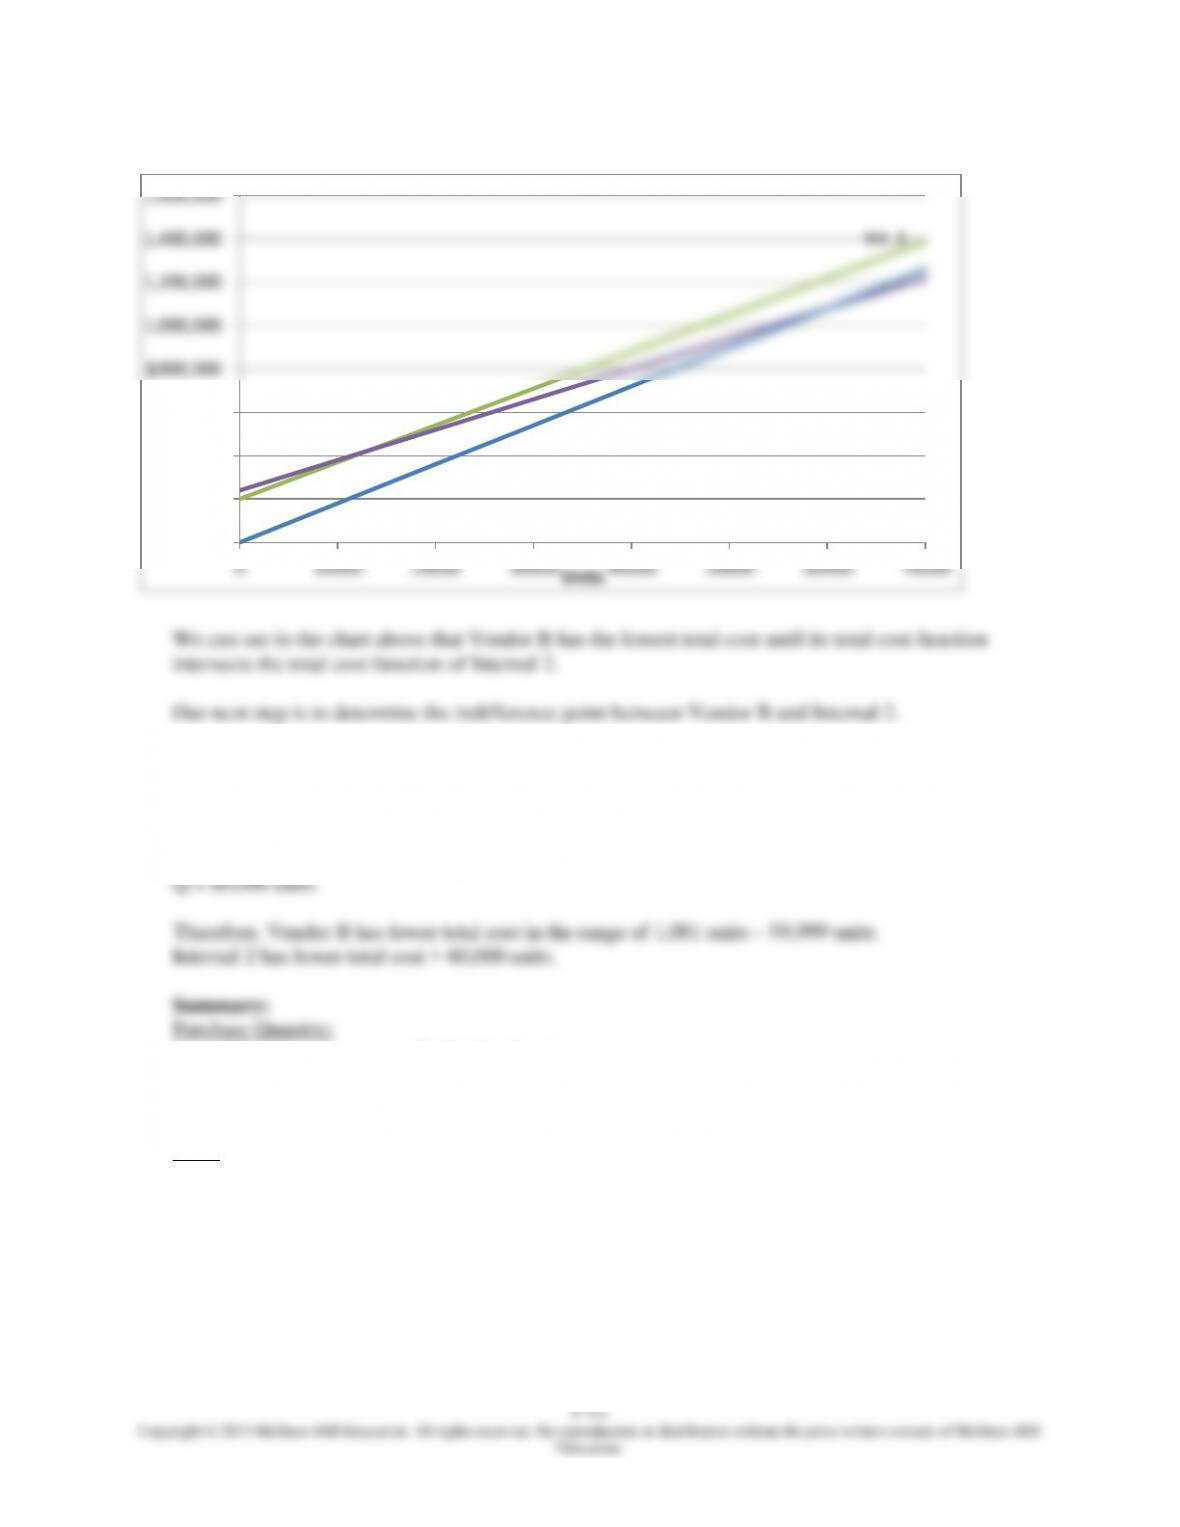
Set the two cost functions equal and solve for Q:
$18Q = $240,000 + $14Q
$18Q – $14Q = $240,000
$4Q = $240,000
Q = $240,000/$40
1 – 1,000 units Prefer Vendor A
1,001 – 59,999 units Prefer Vendor B
60,000 units Indifferent between Vendor B & Internal 2
> 60,000 units Prefer Internal 2
Note: Internal 1 and Vendor C are never best.
Int. 1
Vend B
Int. 2
0
200,000
400,000
600,000
800,000
1,000,000
1,200,000
1,400,000
1,600,000
0 10000 20000 30000 40000 50000 60000 70000
$
Units
Chapter 05 – Strategic Capacity Planning for Products and Services
9. Given: Actual output will be 225 per day per cell. 240 working days/year. Projected annual demand =
150,000 within 2 years.
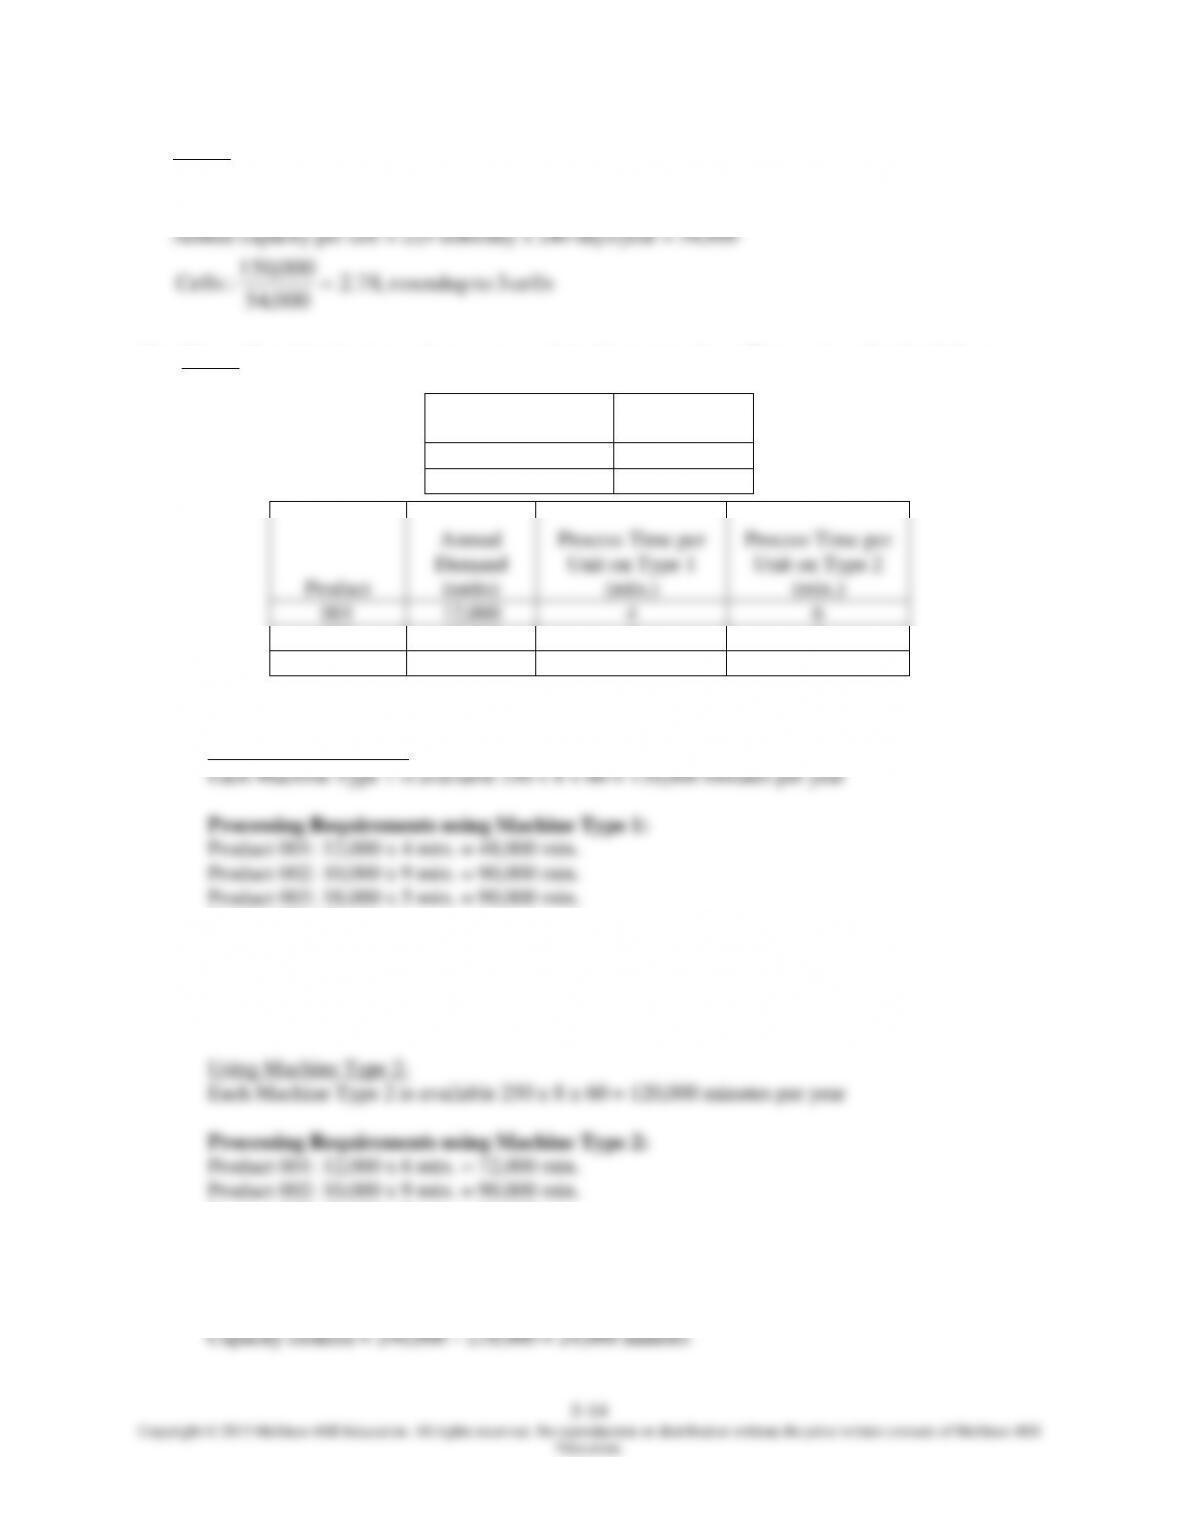
10. Given: Our objective is to select one type of machine to purchase. We are given the data below:
a. Number of machines of each type needed if the machines will operate 60 minutes per hour, 8
hours per day, 250 days per year.
Using Machine Type 1:
Total = 228,000 min.
Number of Machine Type 1 Needed = processing time needed / processing time capacity per unit
= 228,000 / 120,000 = 1.9 = 2 machines (round up)
Capacity = 2 x 120,000 minutes = 240,000 minutes
Capacity cushion = 240,000 – 228,000 = 12,000 minutes
Product 003: 18,000 x 3 min. = 54,000 min.
Total = 216,000 min.
Number of Machine Type 2 Needed = processing time needed / processing time capacity per unit
= 216,000 / 120,000 = 1.8 = 2 machines (round up)
Capacity = 2 x 120,000 minutes = 240,000 minutes
Machine Type
Purchasing
Cost/Machine
1
$10,000
2
$14,000
001
12,000
4
6
002
10,000
9
9
003
18,000
5
3
Chapter 05 – Strategic Capacity Planning for Products and Services
5–16
Education.
b. Given: Operating Costs: A = $10/hour/machine; B = $11/hour/machine; C =
$12/hour/machine.
Total cost for each type of machine:
A (2): 186,000 min. / 60 min./hour = 3,100.00 hrs. x $10 = $31,000 + $80,000 = $111,000
B (2): 208,000 min. / 60 min./hour = 3,466.67 hrs. x $11 = $38,133 + $60,000 = $98,133
C(1): 122,000 min. / 60 min./hour = 2,033.33 hrs. x $12 = $24,400 + $80,000 = $104,400
12. Given: R = $45 per customer, v = $20 per customer, each machine can process 100 customers per
day, fixed cost for one machine = $2,000 per day total; and fixed cost for two machines = $3,800 per
day total.
a. FC Range
vR
FC
QBEP
5–17
Education.
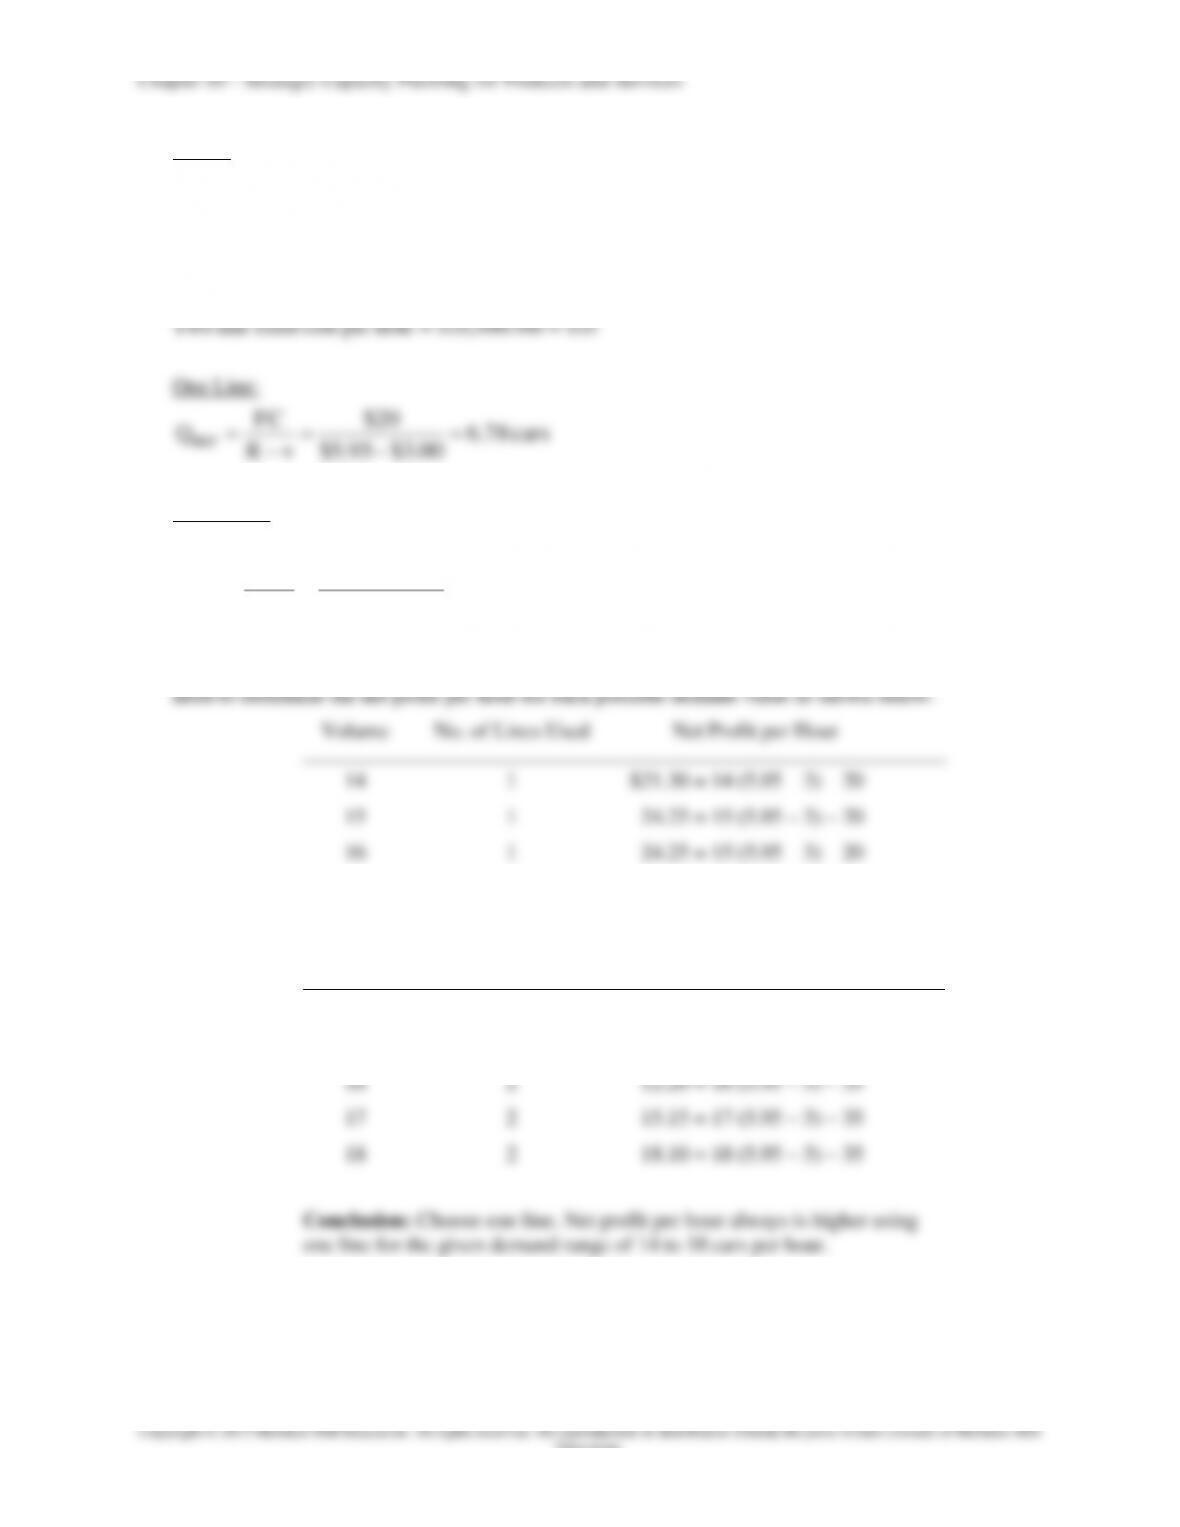
13. Given: R = $5.95/car, v = $3/car, Fixed Cost for one line = $6,000/month, Fixed Cost for two lines =
$10,500/month, each line can process 15 cars/hour, & the car wash is open 300 hours/month.
Determine the break-even for each option:
To do this, we will need to convert fixed costs per month to fixed costs per hour.
One line fixed cost per hour = $6,000/300 = $20
00.3$95.5$
R
Two Lines:
cars 86.11
00.3$95.5$
35$
R
v
FC
QBEP
If demand averages between 14 and 18 cars an hour, either option would break even. Therefore, we
Volume
No. of Lines Used
Net Profit per Hour
14
1
$21.30 = 14 (5.95 – 3) – 20
15
1
24.25 = 15 (5.95 – 3) – 20
16
1
24.25 = 15 (5.95 – 3) – 20
17
1
24.25 = 15 (5.95 – 3) – 20
18
1
24.25 = 15 (5.95 – 3) – 20
Volume
No. of Lines Used
Net Profit per Hour
14
2
$6.30 = 14 (5.95 – 3) – 35
15
2
9.25 = 15 (5.95 – 3) – 35
16
2
12.20 = 16 (5.95 – 3) – 35
17
2
15.15 = 17 (5.95 – 3) – 35
18
2
18.10 = 18 (5.95 – 3) – 35
Conclusion: Choose one line. Net profit per hour always is higher using
one line for the given demand range of 14 to 18 cars per hour.
Chapter 05 – Strategic Capacity Planning for Products and Services
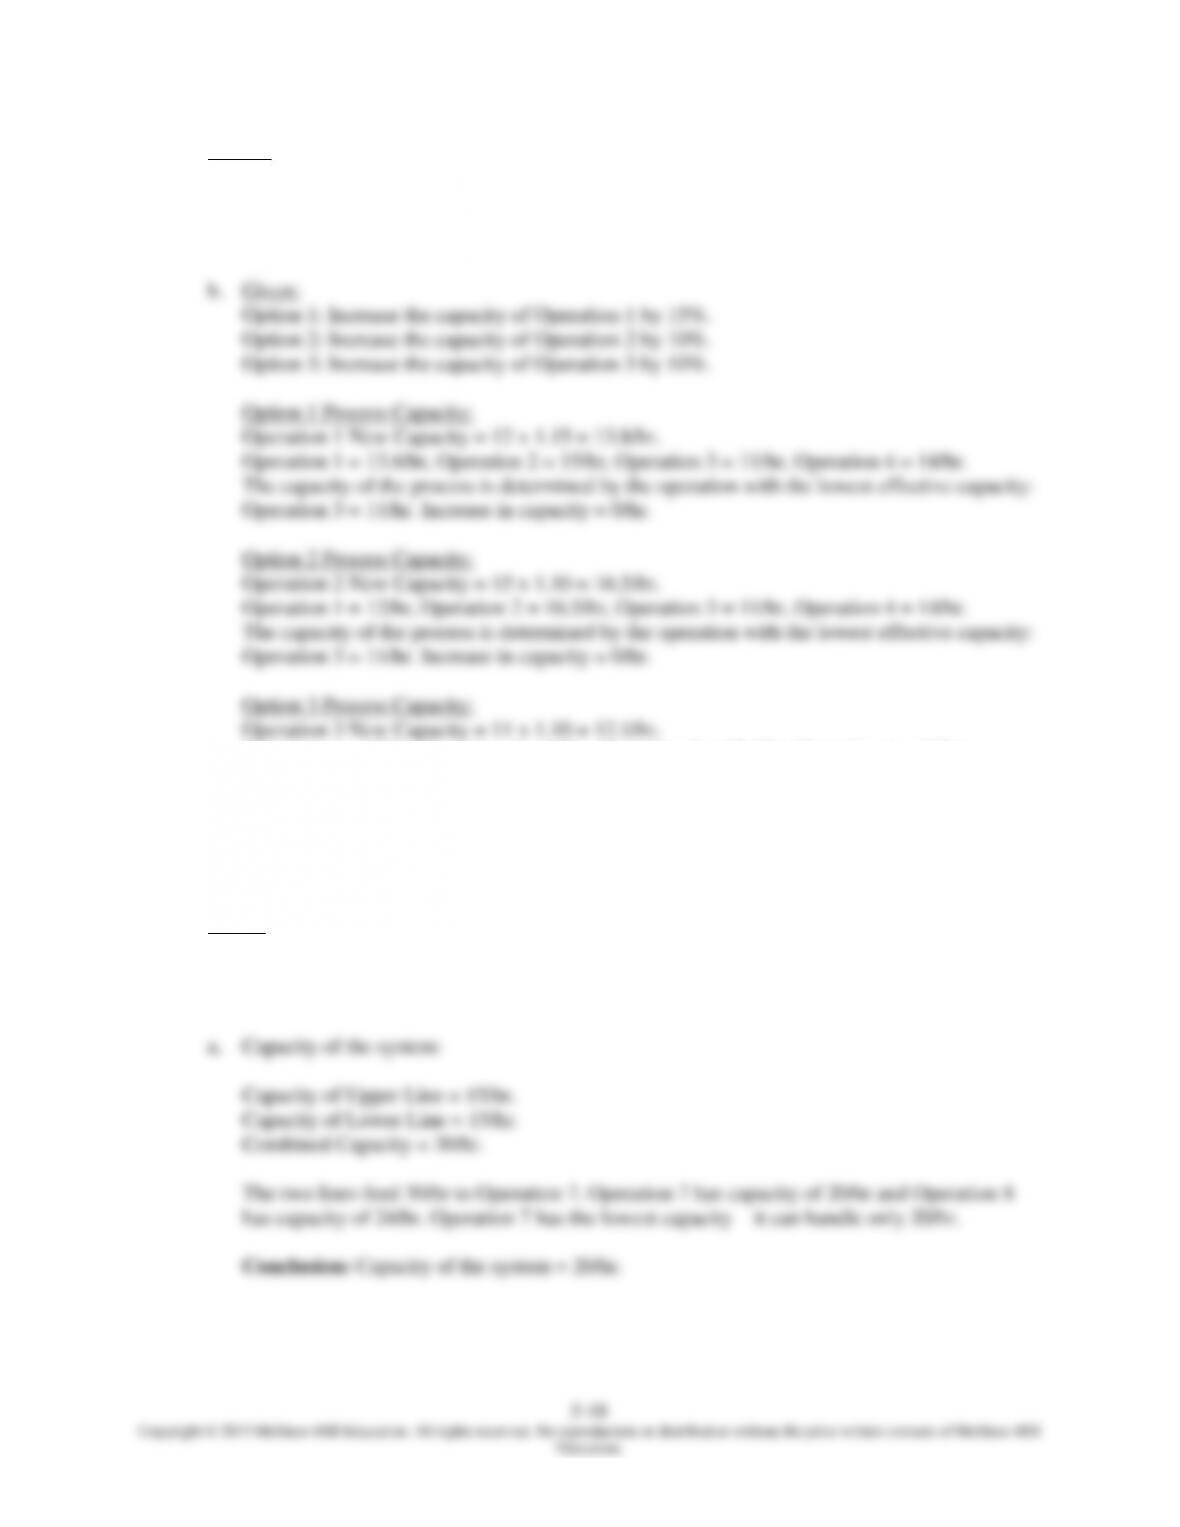
14. Given : We have a 4-step process with the following effective capacity for each operation:
Operation 1 = 12/hr, Operation 2 = 15/hr, Operation 3 = 11/hr, Operation 4 = 14/hr.
a. The capacity of the process is determined by the operation with the lowest effective capacity:
Operation 3 = 11/hr.
Operation 1 = 12/hr, Operation 2 = 15/hr, Operation 3 = 12.1/hr, Operation 4 = 14/hr.
The capacity of the process is determined by the operation with the lowest effective capacity:
Operation 1 = 12/hr. Increase in capacity = 1/hr (12/hr – 11/hr).
Conclusion: Select Option 3. Increasing the capacity of Operation 3 by 10% yields the
greatest increase in process capacity (1/hr).
15. Given: Two parallel lines feed their combined output to Operation 7.
Upper Line Capacities: Operation 1 = 18/hr, Operation 2 = 15/hr, Operation 3 = 16/hr.
Lower Line Capacities: Operation 4 = 17/hr, Operation 5 = 15/hr, Operation 6 = 17/hr.
Capacity of Operation 7 = 20/hr. Capacity of Operation 8 = 24/hr.
5–19
Copyright © 2015 McGraw-Hill Education. All rights reserved. No reproduction or distribution without the prior written consent of McGraw-Hill
Education.
b. Given: The capacity of one operation could be increased.
Process capacity is limited by Operation 7; therefore, increase the capacity of Operation 7 by
4 units/hour from 20 units/hour to 24 units/hour at which time Operation 8 also becomes a
bottleneck.
16. Given: Three parallel lines feed their combined output to Operation 10.
Upper Line Capacities: Operation 1 = 22/hr, Operation 2 = 17/hr, Operation 3 = 18/hr.
Middle Line Capacities: Operation 4 = 20/hr, Operation 5 = 18/hr, Operation 6 = 18/hr.
17. Given: Two parallel lines feed their combined output to Operation 7.
Upper Line Capacities: Operation 1 = 15/hr, Operation 2 = 10/hr, Operation 3 = 20/hr.
Lower Line Capacities: Operation 4 = 5/hr, Operation 5 = 8/hr, Operation 6 = 12/hr.
Capacity of Operation 7 = 34/hr. Capacity of Operation 8 = 30/hr.
Conclusion: Increase the capacity of Operation 2 by 5/hr. The resulting process capacity
would be 20/hr.