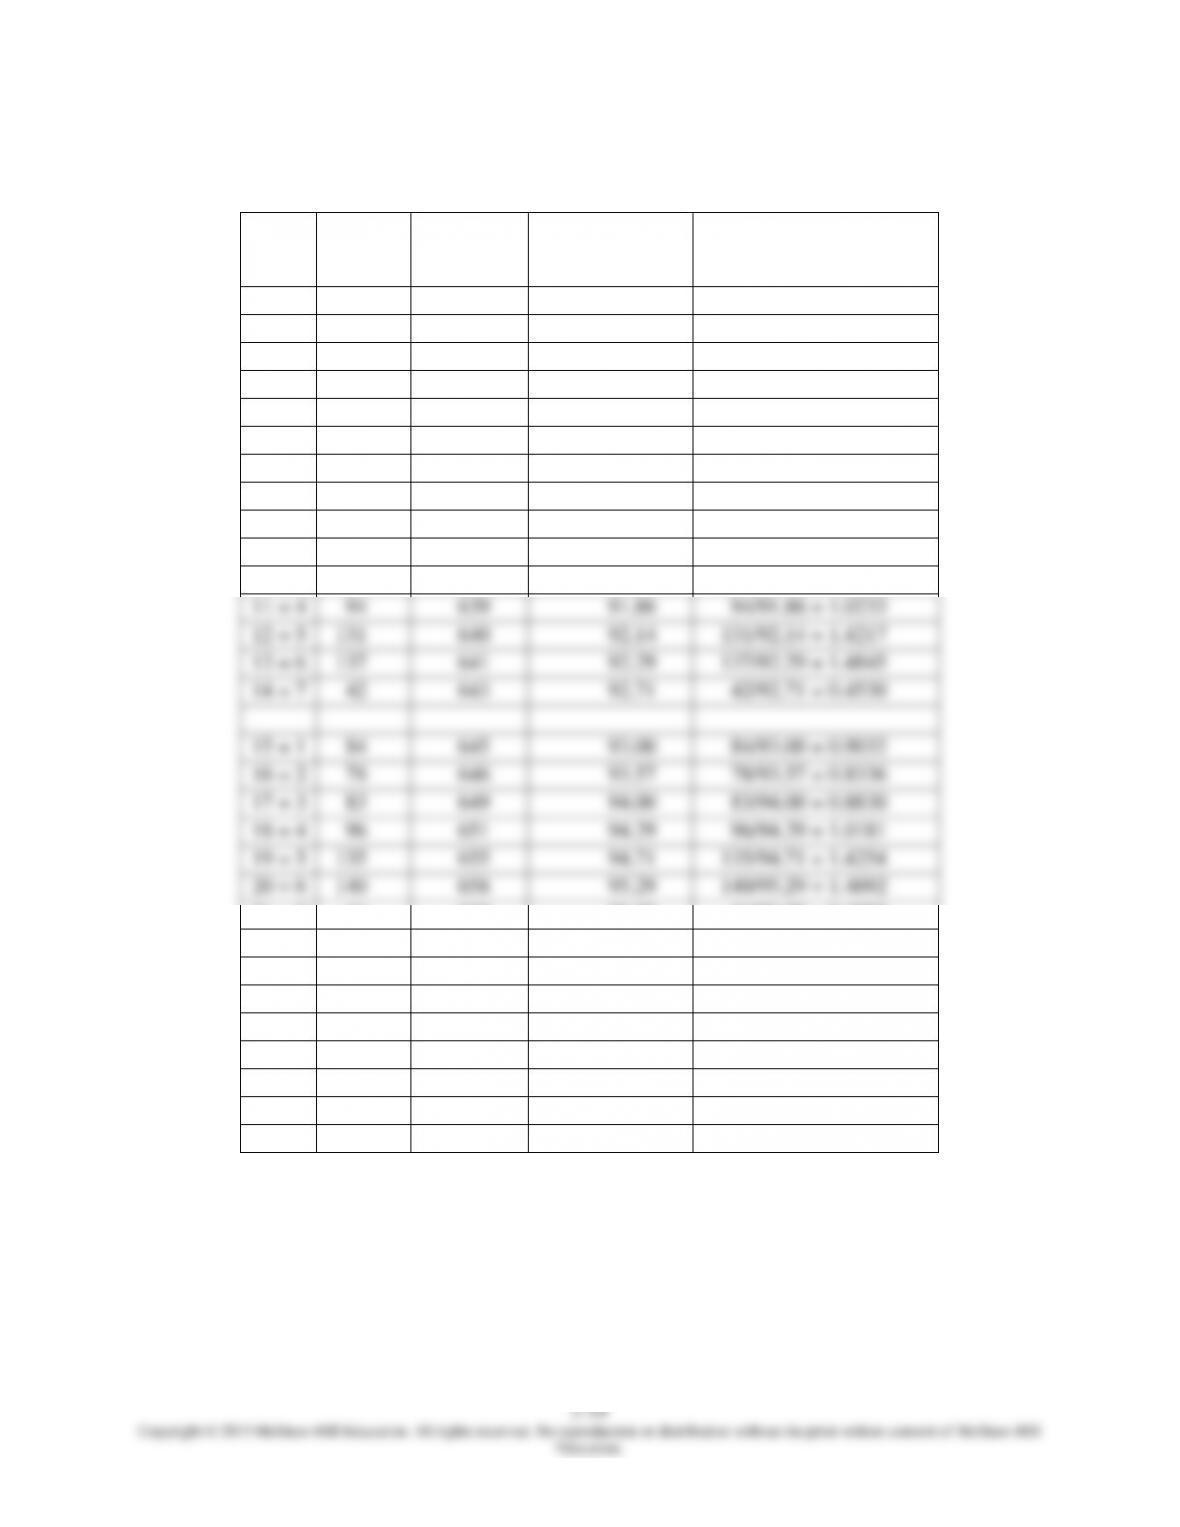
Chapter 03 – Forecasting
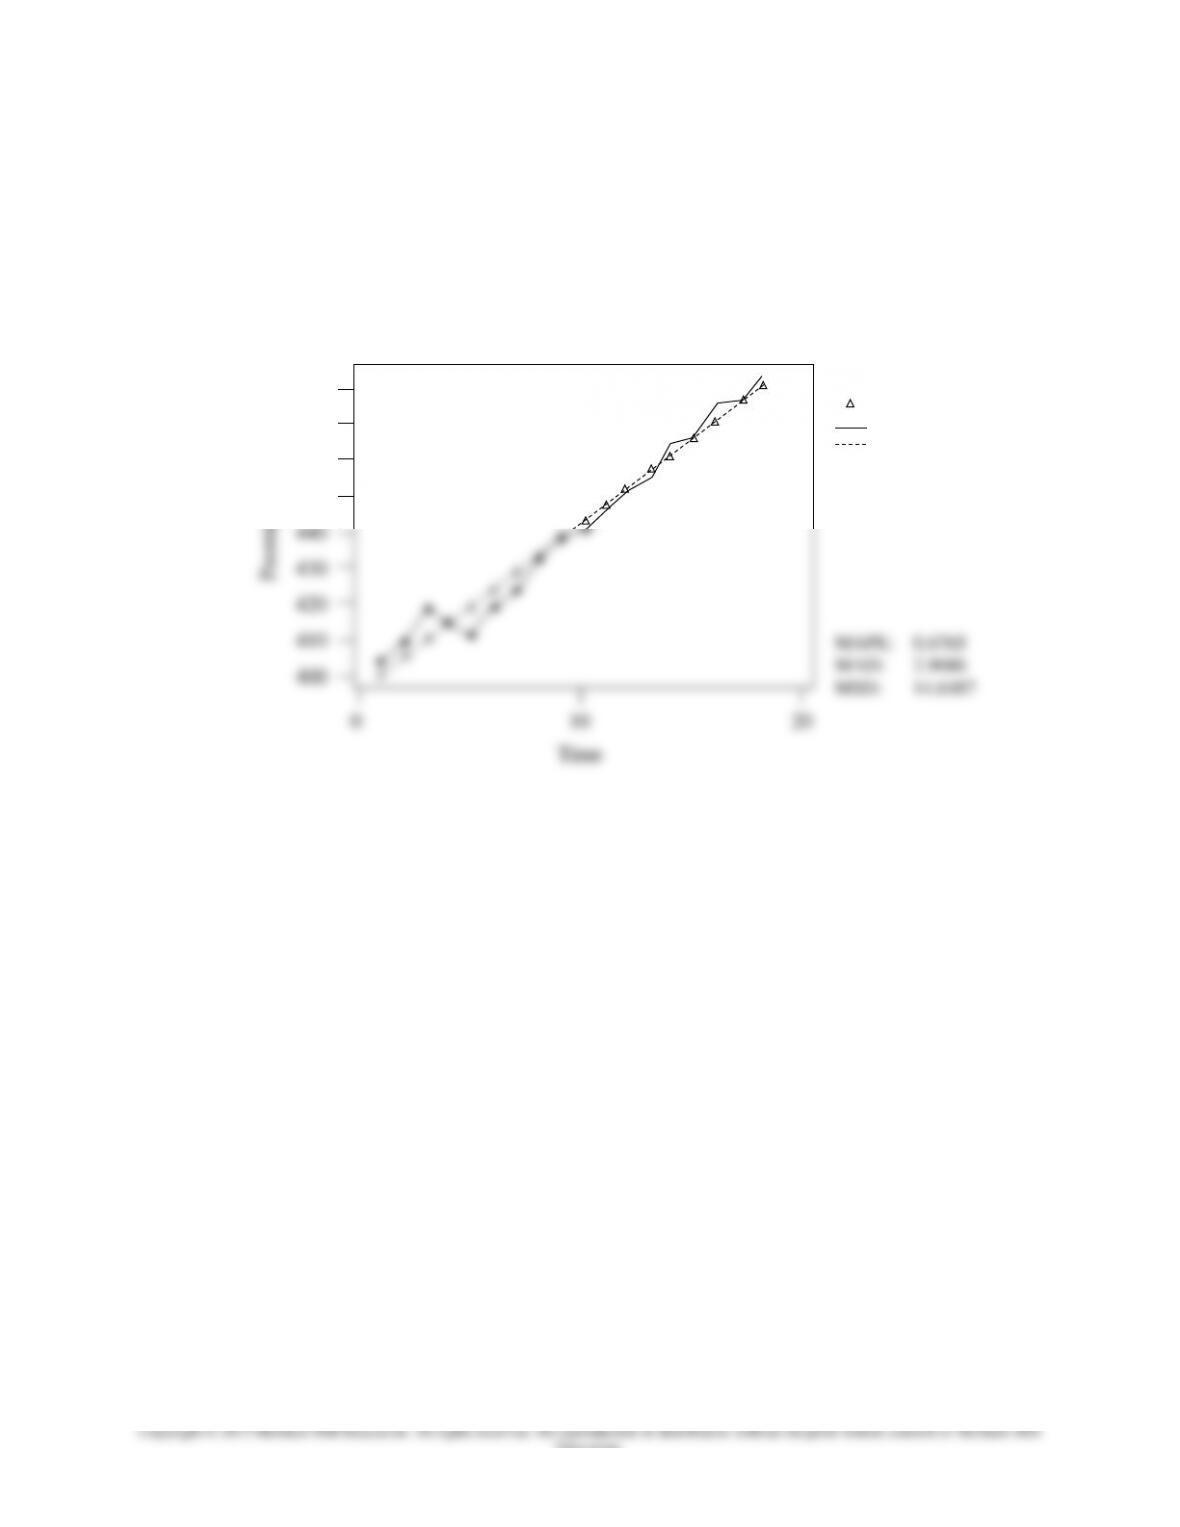
8. a. There appears to be a long-term upward increasing trend in the data. If we use an averaging
technique, the forecast will underestimate when data values increase.
b.
480
470
460
450
Actual
Fits
Actual
Fits
Trend Analysis for Passengers
Linear Trend Model
Yt = 397.01 + 4.59t
Chapter 03 – Forecasting
3–12
Education.
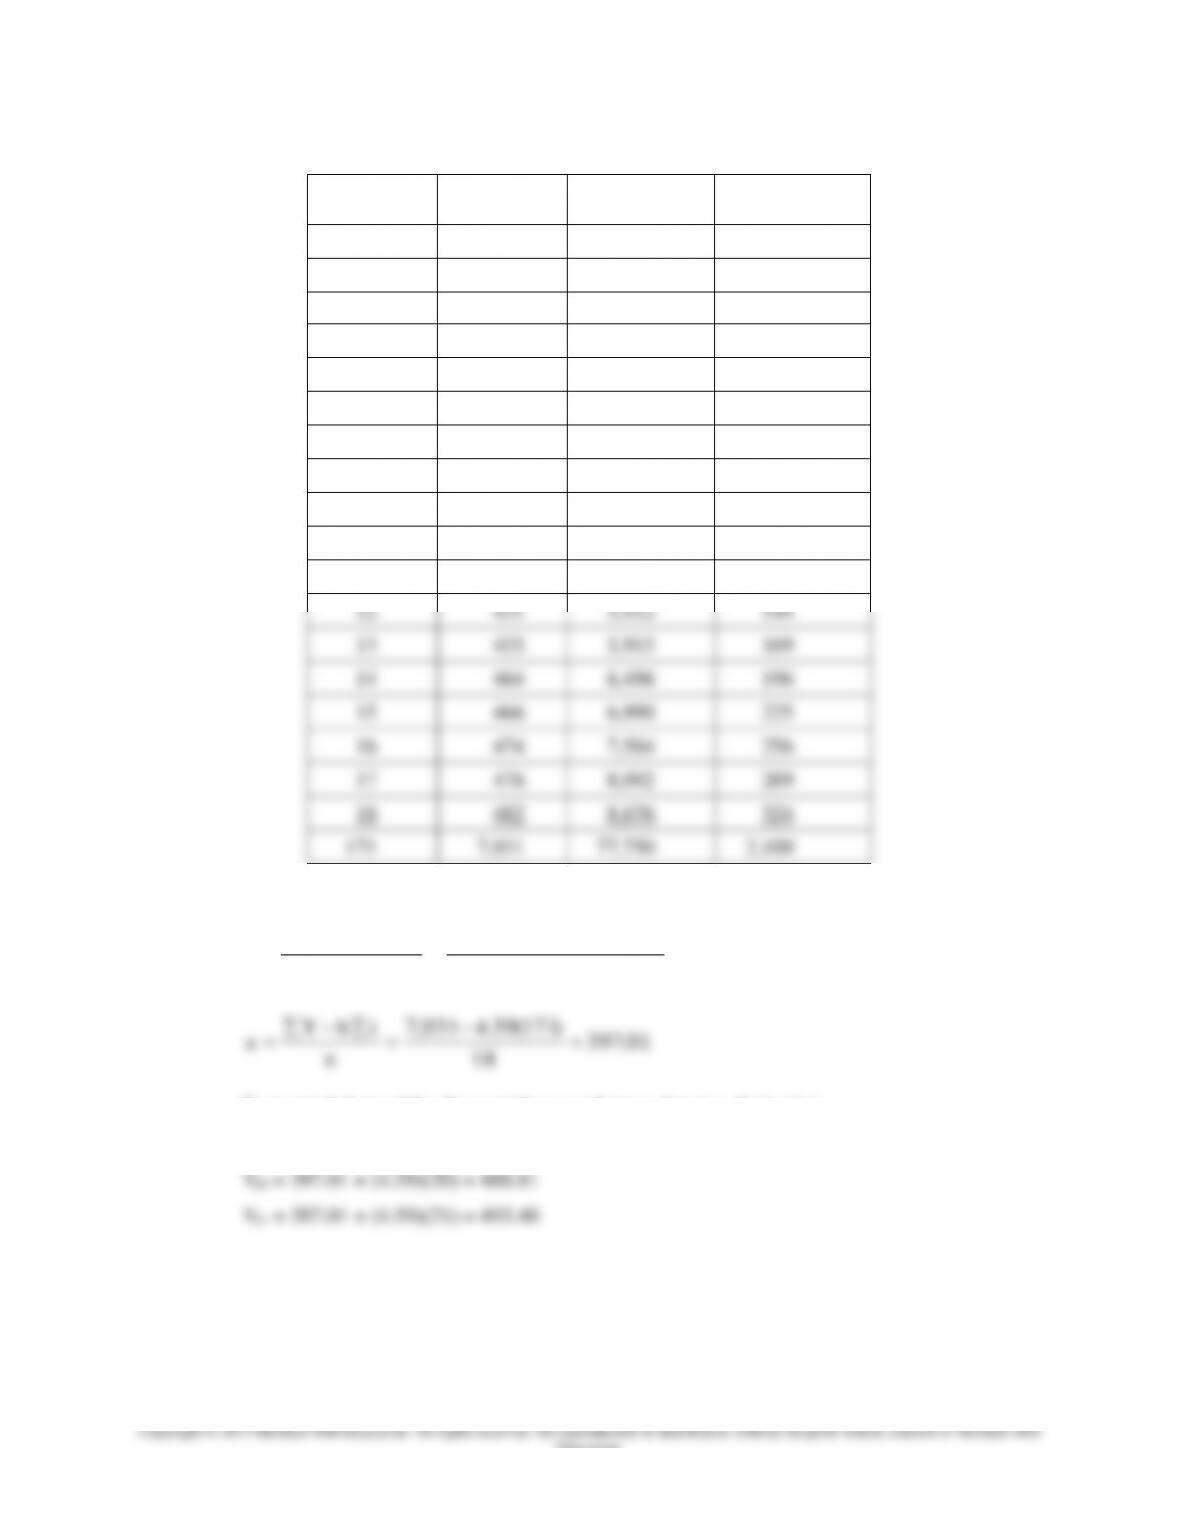
t
Y
t*Y
t2
1
405
405
1
2
410
820
4
3
420
1,260
9
4
415
1,660
16
5
412
2,060
25
6
420
2,520
36
7
424
2,968
49
8
433
3,464
64
9
438
3,942
81
10
440
4,400
100
11
446
4,906
121
12
451
5,412
144
13
455
5,915
169
14
464
6,496
196
15
466
6,990
225
16
474
7,584
256
17
476
8,092
289
18
482
8,676
324
171
7,931
77,750
2,109
Round b & a to two decimals:
59.4
)171()109,2(18
)931,7(171)750,77(18
)( 222
ttn
YttYn
b
01.397
18
)171(59.4931,7
n
tbY
a
Forecasted demand for the next three week (round to two decimals):
Y19 = 397.01 + (4.59)(19) = 484.22
Chapter 03 – Forecasting
Education.
9.
a.
t
Y
t*Y
t2
1
200
200
1
2
214
428
4
3
211
633
9
4
228
912
16
5
235
1,175
25
6
232
1,332
36
7
248
1,736
49
8
250
2,000
64
9
253
2,277
81
10
267
2,670
100
11
281
3,091
121
12
275
3,300
144
13
280
3,640
169
14
288
4,032
196
15
310
4,650
225
120
3,772
32,136
1,240
Round b & a to two decimals:
00.7
)120()240,1(15
)772,3(120)136,32(15
)( 222
ttn
YttYn
b
47.195
15
)120(00.7772,3
n
tbY
a
Forecasts for periods 16 through 19 using Linear Trend are (round to two decimals):
Y16 = 195.47 + (7.00)(16) = 307.47
Chapter 03 – Forecasting
3–14
Education.
b. Round values to two decimals.
Initial Trend =
33.9
3
200228
Period
Actual
St-1 + Tt–1 = TAFt
TAFt + .3(At – TAFt) = St
Tt–1 + .2 (TAFt – TAFt–1 – Tt–1) = Tt
5
235
228.00 + 9.33 = 237.33
237.33 + .3(235 – 237.33) = 236.63
9.33
6
232
236.63 + 9.33 = 245.96
245.96 + .3(232 – 245.96) = 241.77
9.33 + .2(245.96 – 237.33 – 9.33) = 9.19
7
248
241.77 + 9.19 = 250.96
250.96 + .3(248 – 250.96) = 250.07
9.19 + .2(250.96 – 245.96 – 9.19) = 8.35
8
250
250.07 + 8.35 = 258.42
258.42 + .3(250 – 258.42) = 255.89
8.35 + .2(258.42 – 250.96 – 8.35) = 8.17
9
253
255.89 + 8.17 = 264.06
264.06 + .3(253 – 264.06) = 260.74
8.17 + .2(264.06 – 258.42 – 8.17) = 7.66
10
267
260.74 + 7.66 = 268.40
268.40 + .3(267 – 268.40) = 267.98
7.66 + .2(268.40 – 264.06 – 7.66) = 7.00
11
281
267.98 + 7.00 = 274.98
274.98 + .3(281 – 274.98) = 276.79
7.00 + .2(274.98 – 268.40 – 7.00) = 6.92
12
275
276.79 + 6.92 = 283.71
283.71 + .3(275 – 283.71) = 281.10
6.92 + .2(283.71 – 274.98 – 6.92) = 7.28
13
280
281.10 + 7.28 = 288.38
288.38 + .3(280 – 288.38) = 285.87
7.28 + .2(288.38 – 283.71 – 7.28) = 6.76
14
288
285.87 + 6.76 = 292.63
292.63 + .3(288 – 292.63) = 291.24
6.76 + .2(292.63 – 288.38 – 6.76) = 6.26
15
310
291.24 + 6.26 = 297.50
297.50 + .3(310 – 297.50) = 301.25
6.26 + .2(297.50 – 292.63 – 6.26) = 5.98
16
301.25 + 5.98 = 307.23
10. The initial estimate of trend is based on the net change of 30 for the three periods from 1 to 4, for
an average of +10 units. Use = .5 and = .4. Round values to two decimals.
Initial trend = (240 – 210)/3 = 10.00
Period
Actual
1
210
Model
2
224
Development
3
229
4
240
Actual
St + Tt = TAFt
TAFt + .5(At – TAFt) = St
Tt–1 + .4 (TAFt – TAFt–1 – Tt–1) = Tt
5
255
240.00 + 10.00 = 250.00
250.00 + .5(255 – 250.00) = 252.50
10.00
6
265
252.50 + 10.00 = 262.50
262.50 + .5(265 – 262.50) = 263.75
10.00 + .4(262.50 – 250.00 – 10.00) = 11.00
Model Test
7
272
263.75 + 11.00 = 274.75
274.75 + .5(272 – 274.75) = 272.38
11.00 + .4(274.75 – 262.50 – 11.00) = 11.50
8
285
272.38 + 11.50 = 284.88
284.88 + .5(285 – 284.88) = 284.94
11.50 + .4(284.88 – 274.75 – 11.50) = 10.95
9
294
284.94 + 10.95 = 295.89
295.89 + .5(294 – 295.89) = 294.95
10.95 + .4(295.89 – 284.88 – 10.95) = 10.97
Next
Forecast
10
294.95 + 10.97 = 305.92
Chapter 03 – Forecasting
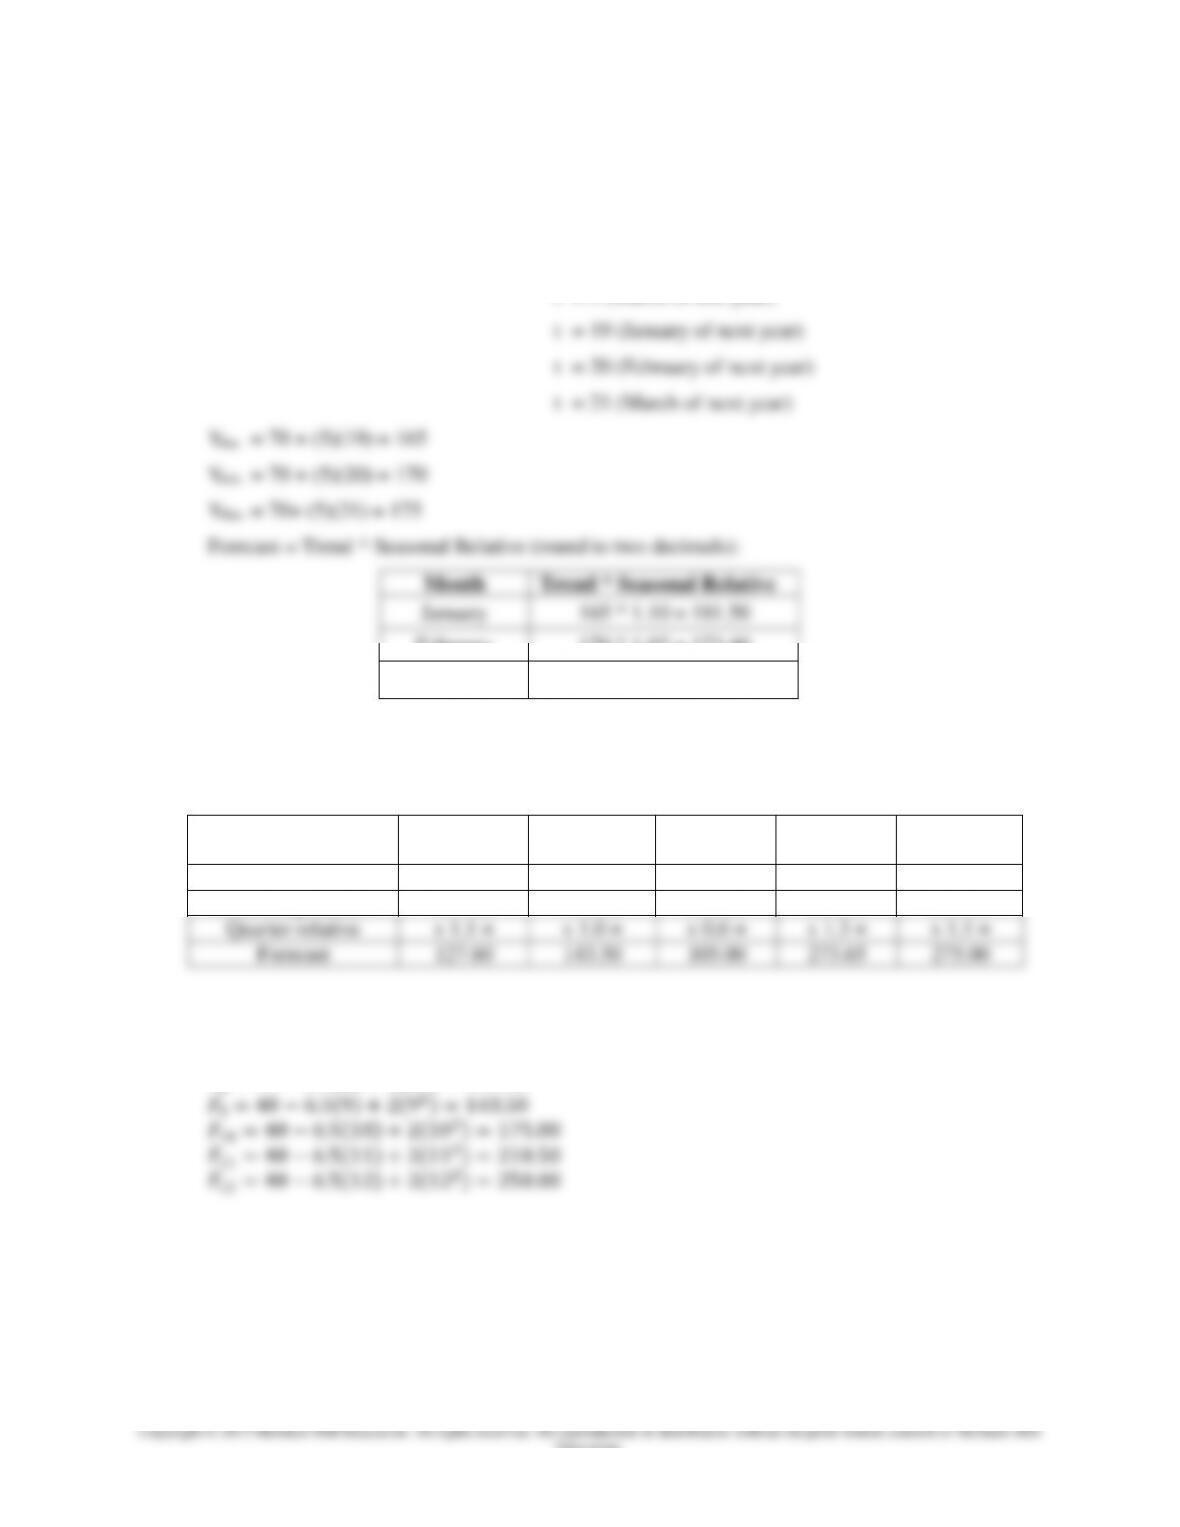
11. Yt = 70 + 5t t = 0 (June of last year)
t = 1 (July of last year)
t = 7 (January of this year)
t = 8 (February of this year)
t = 9 (March of this year)
3–16
Education.
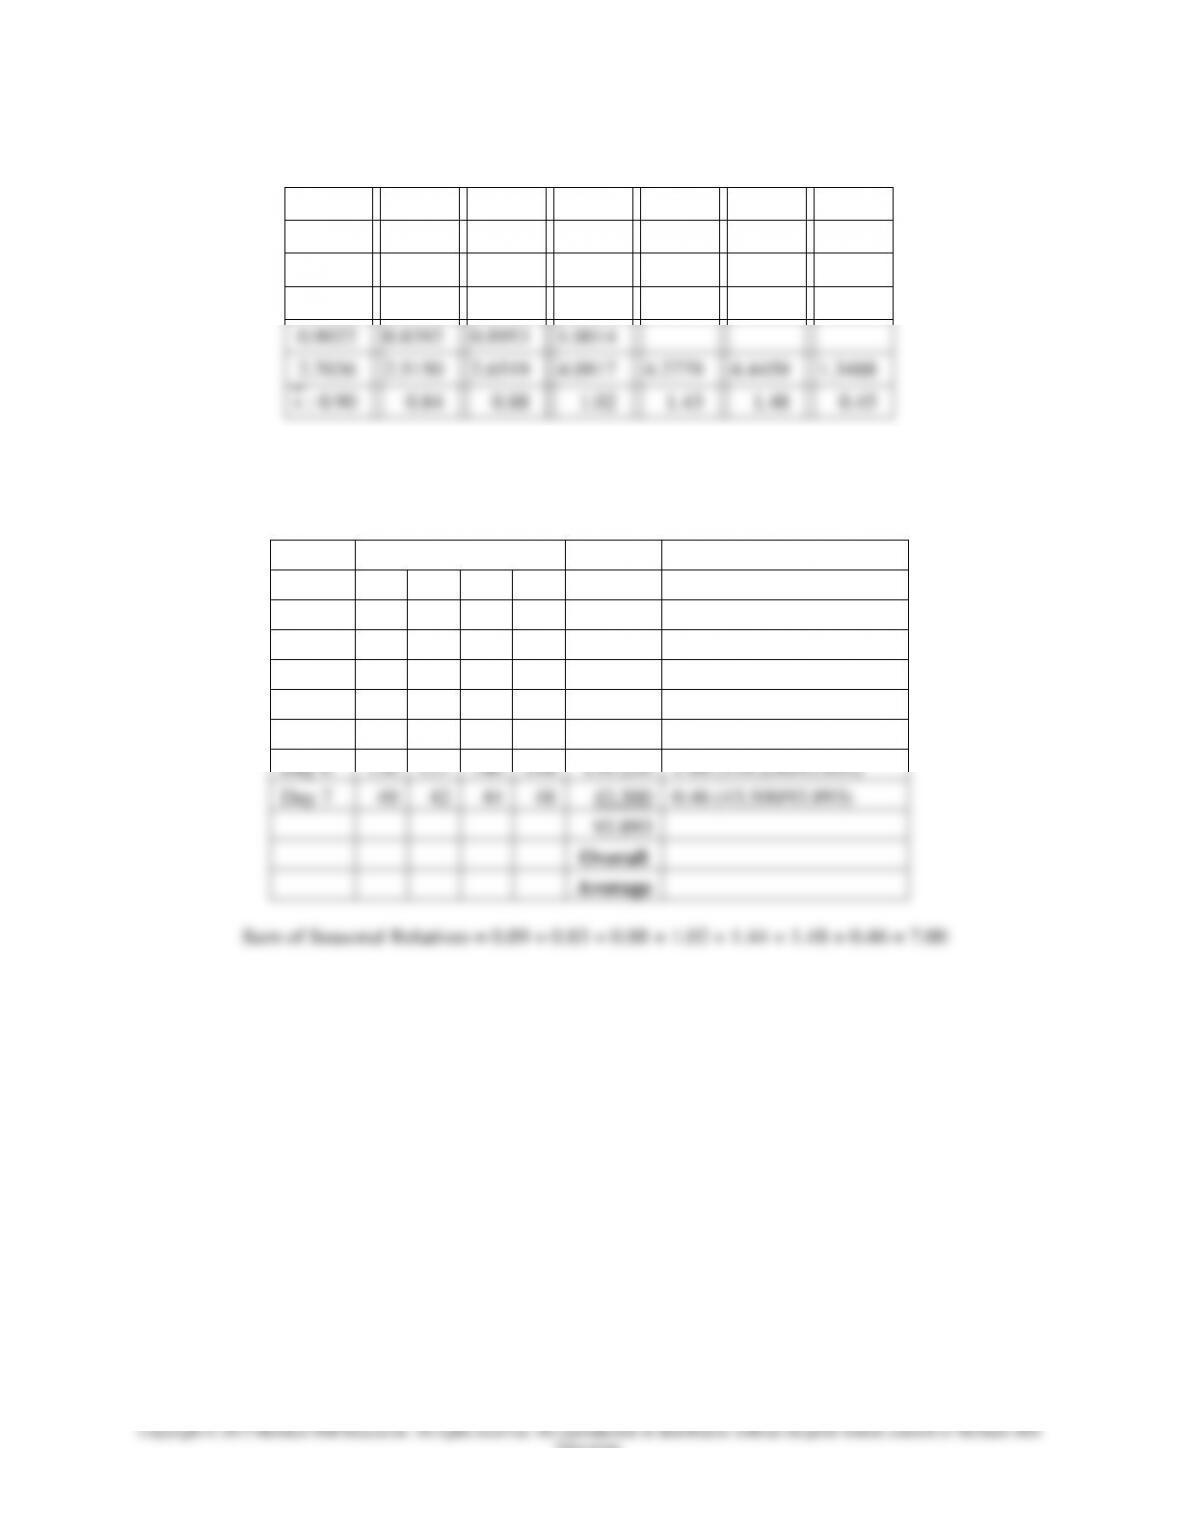
13. Given:
Quarter
Year 1
Year 2
Year 3
Year 4
1
2
3
7
4
2
6
10
18
14
3
2
6
8
8
4
5
9
15
11
SA method (round season averages to three decimals and seasonal relatives to two decimals):
Quarter
Year 1
Year 2
Year 3
Year 4
Season
Average
Seasonal Relative
1
2
3
7
4
4.000
0.50 (4.000/8.000)
2
6
10
18
14
12.000
1.50 (12.000/8.000)
3
2
6
8
8
6.000
0.75 (6.000/8.000)
4
5
9
15
11
10.000
1.25 (10.000/8.000)
8.000
Overall
Average
Sum of Seasonal Relatives = 0.50 + 1.50 + 0.75 + 1.25 = 4.00
Chapter 03 – Forecasting
3–17
Education.
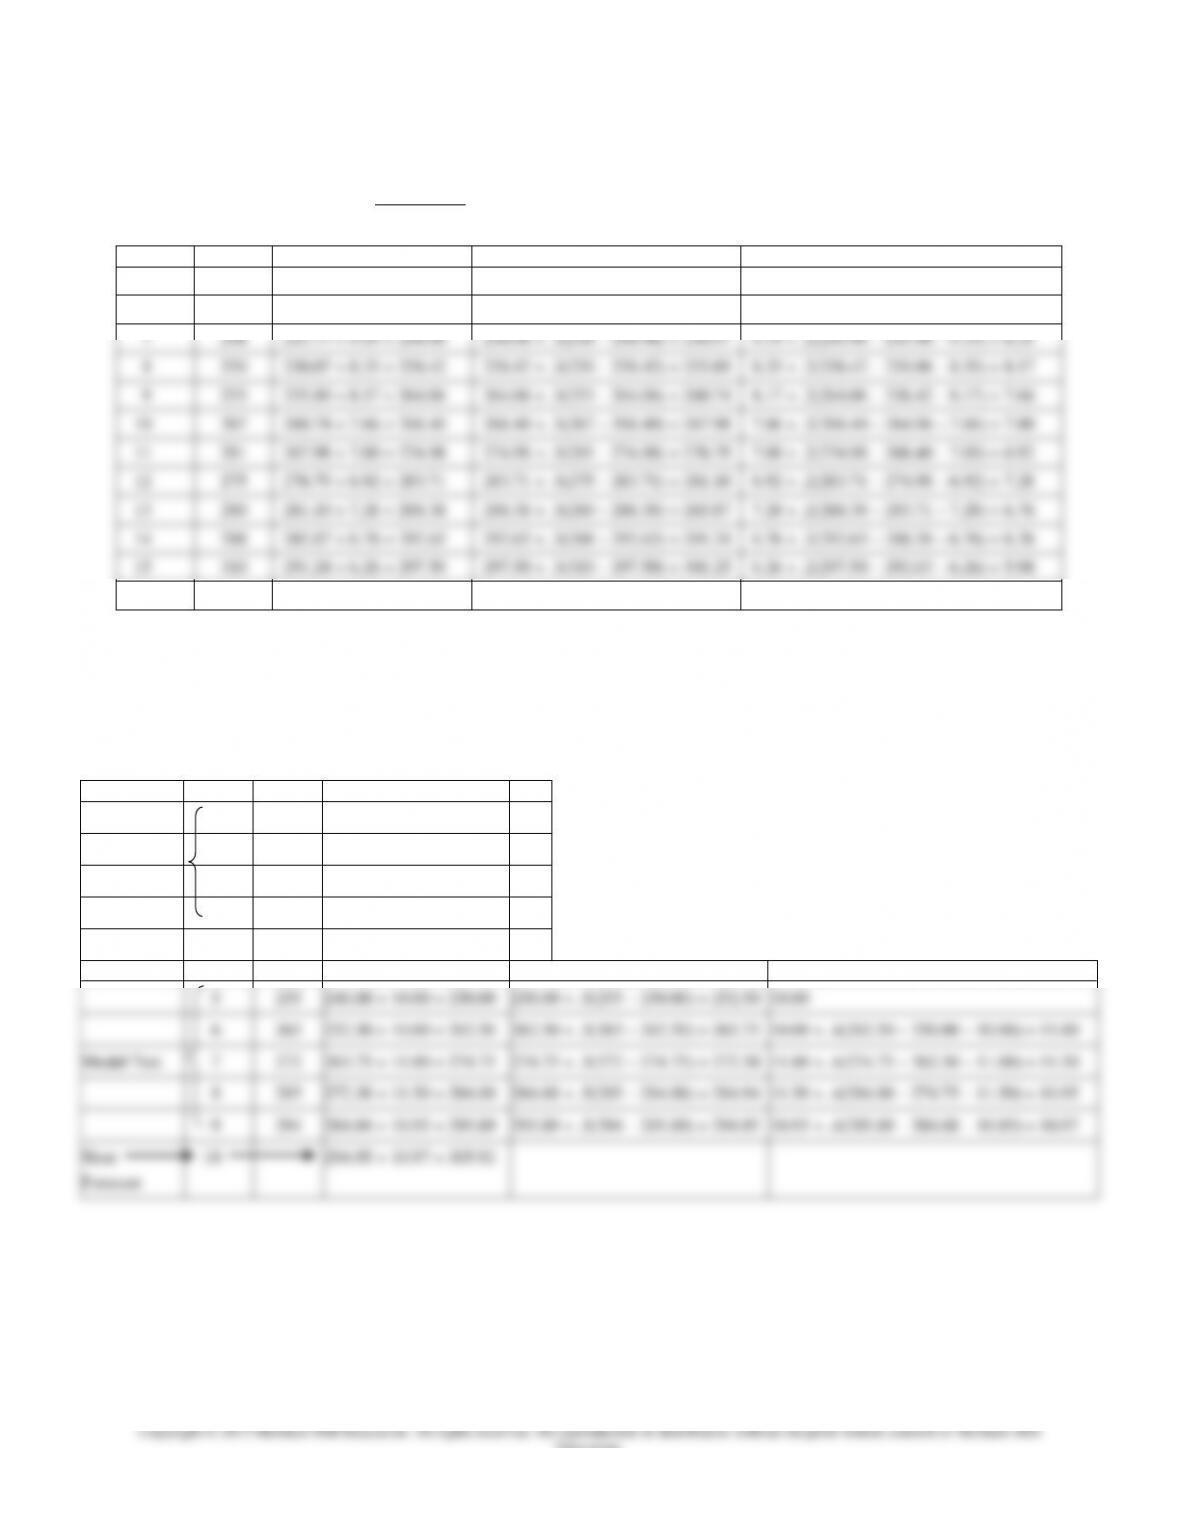
14. a. Centered Moving Average Method (round CMA to two decimals & Index to four
decimals):
Week
Day
Sales
Moving
Total
Centered
Moving
Average
Index
Sales/MA3
Fri
149
1
Sat
250
188.33
1.3275
Sat
Sun
166
565
190.00
0.8737
Fri
154
570
191.67
0.8035
2
Sat
255
575
190.33
1.3398
Sat
Sun
162
571
189.67
0.8541
Fri
152
569
191.33
0.7944
3
Sat
260
574
194.33
1.3379
Sat
Sun
171
583
193.67
0.8829
Fri
150
581
196.33
0.7640
4
Sat
268
589
197.00
1.3604
Sat
Sun
173
591
200.00
0.8650
Fri
159
600
201.67
0.7884
5
Sat
273
605
202.67
1.3470
Sat
Sun
176
608
204.00
0.8627
Fri
163
612
205.00
0.7951
6
Sat
276
615
207.33
1.3312
Sat
Sun
183
622
Seasonal relatives (round to two decimals):
x
: Fri = 0.79; Sat = 1.34; Sun = 0.87
Sum of Seasonal Relatives = 0.79 + 1.34 + 0.87 = 3.00
Chapter 03 – Forecasting
3–18
Education.
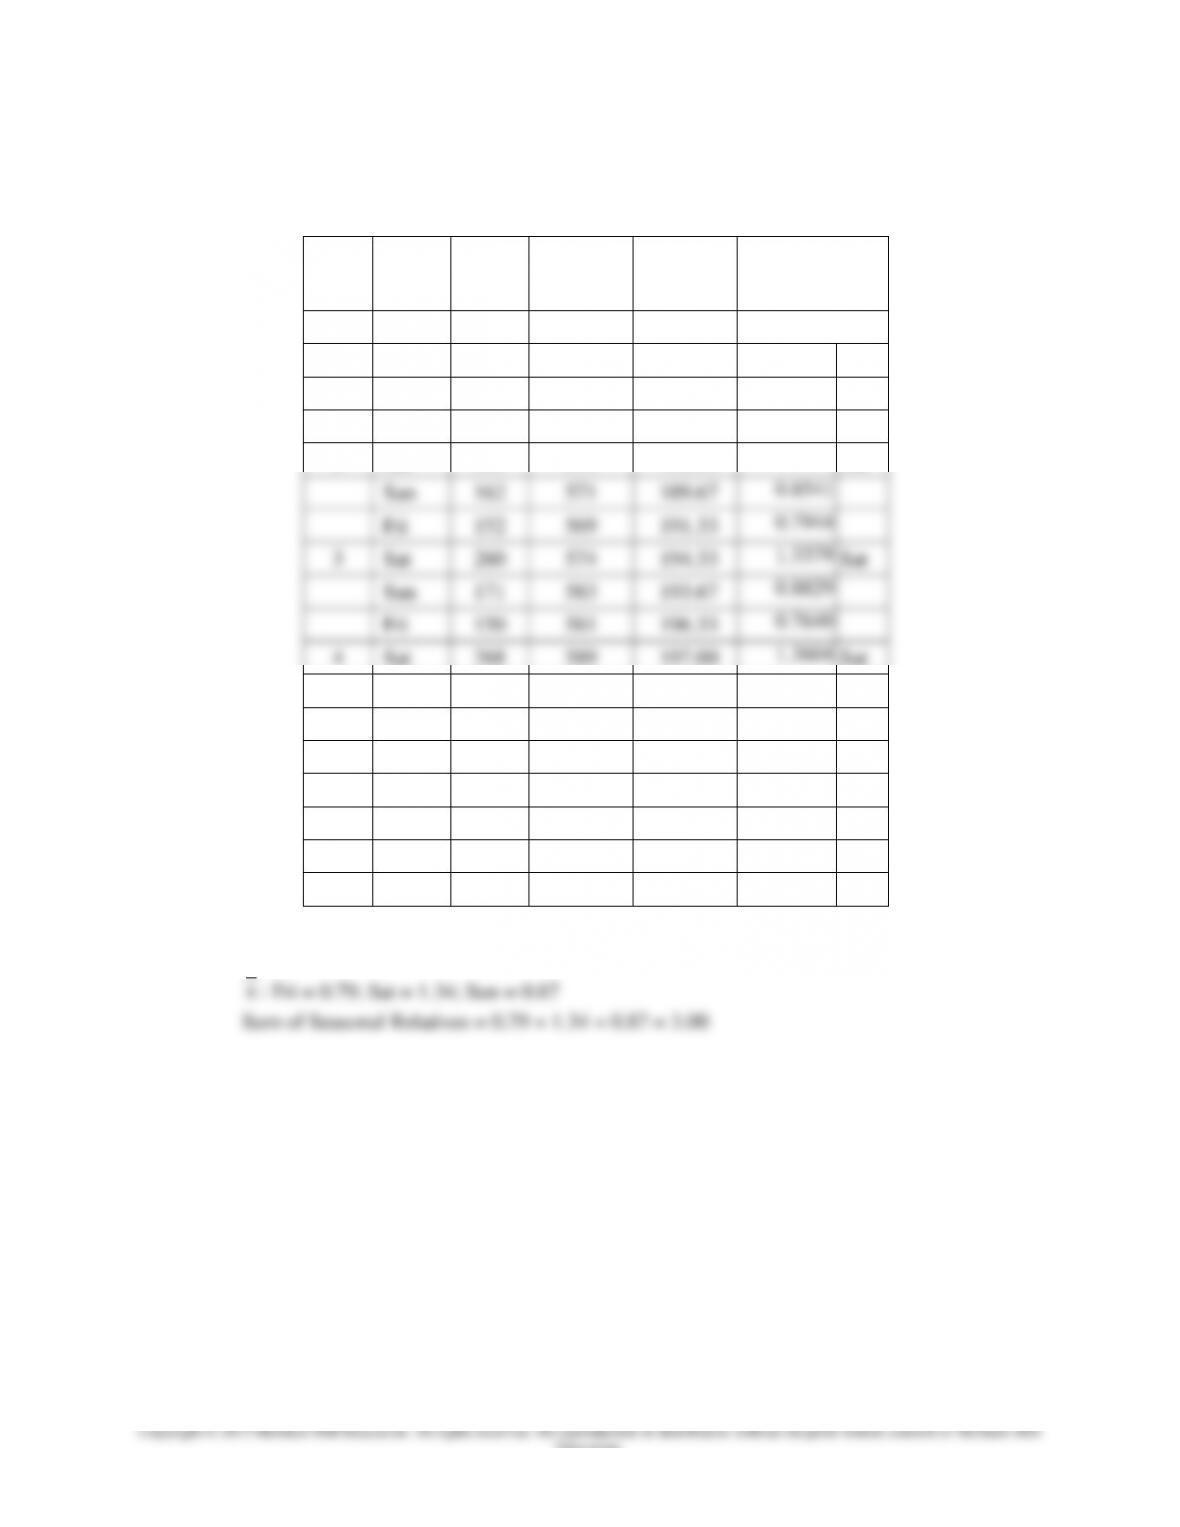
b. SA Method (round season averages to three decimals & seasonal relatives to two decimals).
Week
Season
Seasonal
Season
1
2
3
4
5
6
Average
Relative
Friday
149
154
152
150
159
163
154.500
0.79
(154.500/196.667)
Saturday
250
255
260
268
273
276
263.667
1.34
(263.667/196.667)
Sunday
166
162
171
173
176
183
171.833
0.87
(171.833/196.667)
196.667
Overall
Average
c. In this problem, the two methods provide similar results because there are only 3 seasons;
therefore, the two methods are essentially averaging the same data. In addition, there is no
trend in the data.
15. Given:
The restaurant is open 4 days. Thursday night accounts for 0.20 of the business. Friday night
accounts for 0.35 of the business. Saturday night accounts for 0.30 of the business.
Wednesday night: 1.00 – 0.20 – 0.35 – 0.30 = 0.15 (15.00%) of the business.
Chapter 03 – Forecasting
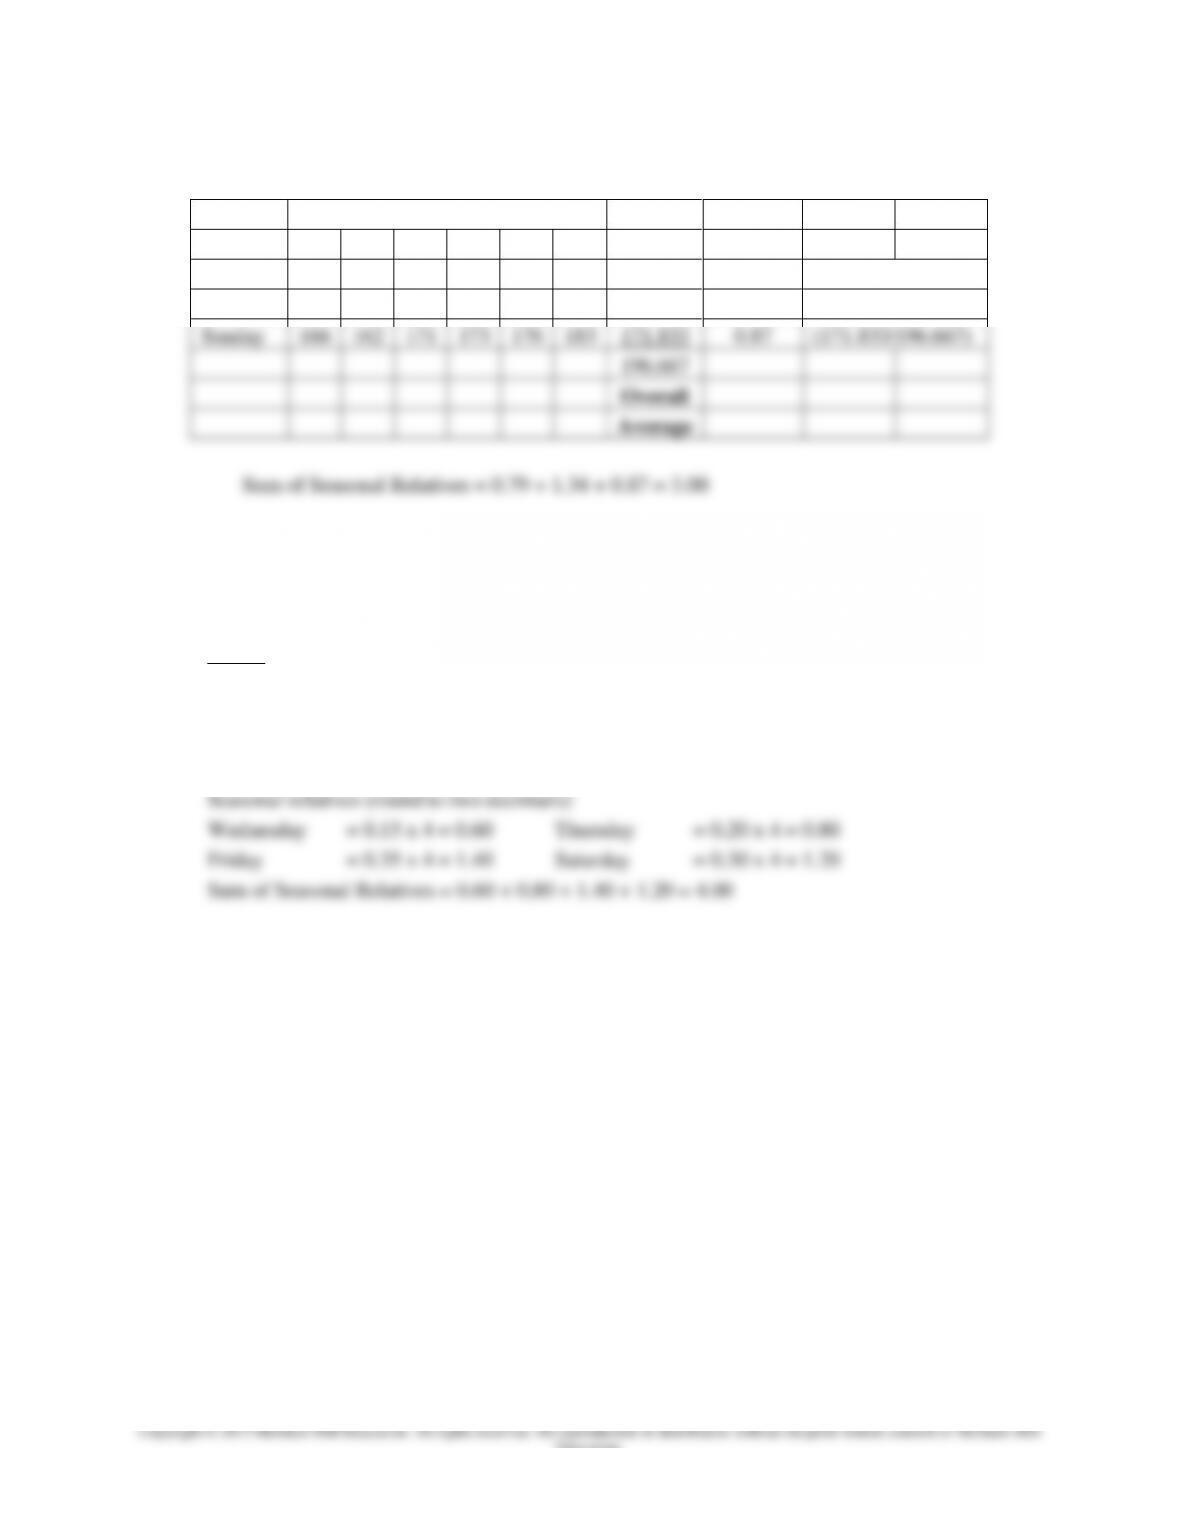
16. a. Centered Moving Average Method (round CMA to two decimals & Index to four decimals):
Day
(Data)
No.
Served
Moving
Total
Centered
Moving Average
Index
1 = 1
80
2 = 2
75
3 = 3
78
4 = 4
95
90.57
95/90.57 = 1.0489
5 = 5
130
90.86
130/90.86 = 1.4308
6 = 6
136
91.14
136/91.14 = 1.4922
7 = 7
40
634
91.43
40/91.43 = 0.4375
8 = 1
82
636
91.29
82/91.29 = 0.8982
9 = 2
77
638
91.43
77/91.43 = 0.8422
10 = 3
80
640
91.57
80/91.57 = 0.8736
11 = 4
94
639
91.86
94/91.86 = 1.0233
12 = 5
131
640
92.14
131/92.14 = 1.4217
13 = 6
137
641
92.29
137/92.29 = 1.4845
14 = 7
42
643
92.71
42/92.71 = 0.4530
15 = 1
84
645
93.00
84/93.00 = 0.9032
16 = 2
78
646
93.57
78/93.57 = 0.8336
17 = 3
83
649
94.00
83/94.00 = 0.8830
18 = 4
96
651
94.29
96/94.29 = 1.0181
19 = 5
135
655
94.71
135/94.71 = 1.4254
20 = 6
140
658
95.29
140/95.29 = 1.4692
21 = 7
44
660
96.00
44/96.00 = 0.4583
22 = 1
87
663
96.43
87/96.43 = 0.9022
23 = 2
82
667
97.71
82/97.71 = 0.8392
24 = 3
88
672
98.29
88/98.29 = 0.8953
25 = 4
99
675
98.86
99/98.86 = 1.0014
26 = 5
144
684
27 = 6
144
688
28 = 7
48
692
Chapter 03 – Forecasting
3–20
Education.
Group and Average the Indexes to Derive Seasonal Relatives
1’s
2’s
3’s
4’s
5’s
6’s
7’s
1.0489
1.4308
1.4922
0.4375
0.8982
0.8422
0.8736
1.0233
1.4217
1.4845
0.4530
0.9032
0.8336
0.8830
1.0181
1.4254
1.4692
0.4583
0.9022
0.8392
0.8953
1.0014
2.7036
2.5150
2.6519
4.0917
4.2779
4.4459
1.3488
x
: 0.90
0.84
0.88
1.02
1.43
1.48
0.45
Sum of Seasonal Relatives = 0.90 + 0.84 + 0.88 + 1.02 + 1.43 + 1.48 + 0.45 = 7.00
b. SA Method (round season averages to three decimals & seasonal relatives to two decimals):
Week
Season
Seasonal
Season
1
2
3
4
Average
Relative
Day 1
80
82
84
87
83.250
0.89 (83.250/93.893)
Day 2
75
77
78
82
78.000
0.83 (78.000/93.893)
Day 3
78
80
83
88
82.250
0.88 (82.250/93.893)
Day 4
95
94
96
99
96.000
1.02 (96.000/93.893)
Day 5
130
131
135
144
135.000
1.44 (135.000/93.893)
Day 6
136
137
140
144
139.250
1.48 (139.250/93.893)
Day 7
40
42
44
48
43.500
0.46 (43.500/93.893)
93.893
Overall
Average