Chapter 18 – Management of Waiting Lines
18–31
Education.
b. What is the average wait time for service by customers in the various classes (Wq in the
template)?
Class 1: 0.0333 hours
Class 2: 0.0555 hours
Class 3: 0.1202 hours
Class 4: 0.2705 hours
How many are waiting in each class, on average (Lq in the template)?
Class 1: 0.0666 customers
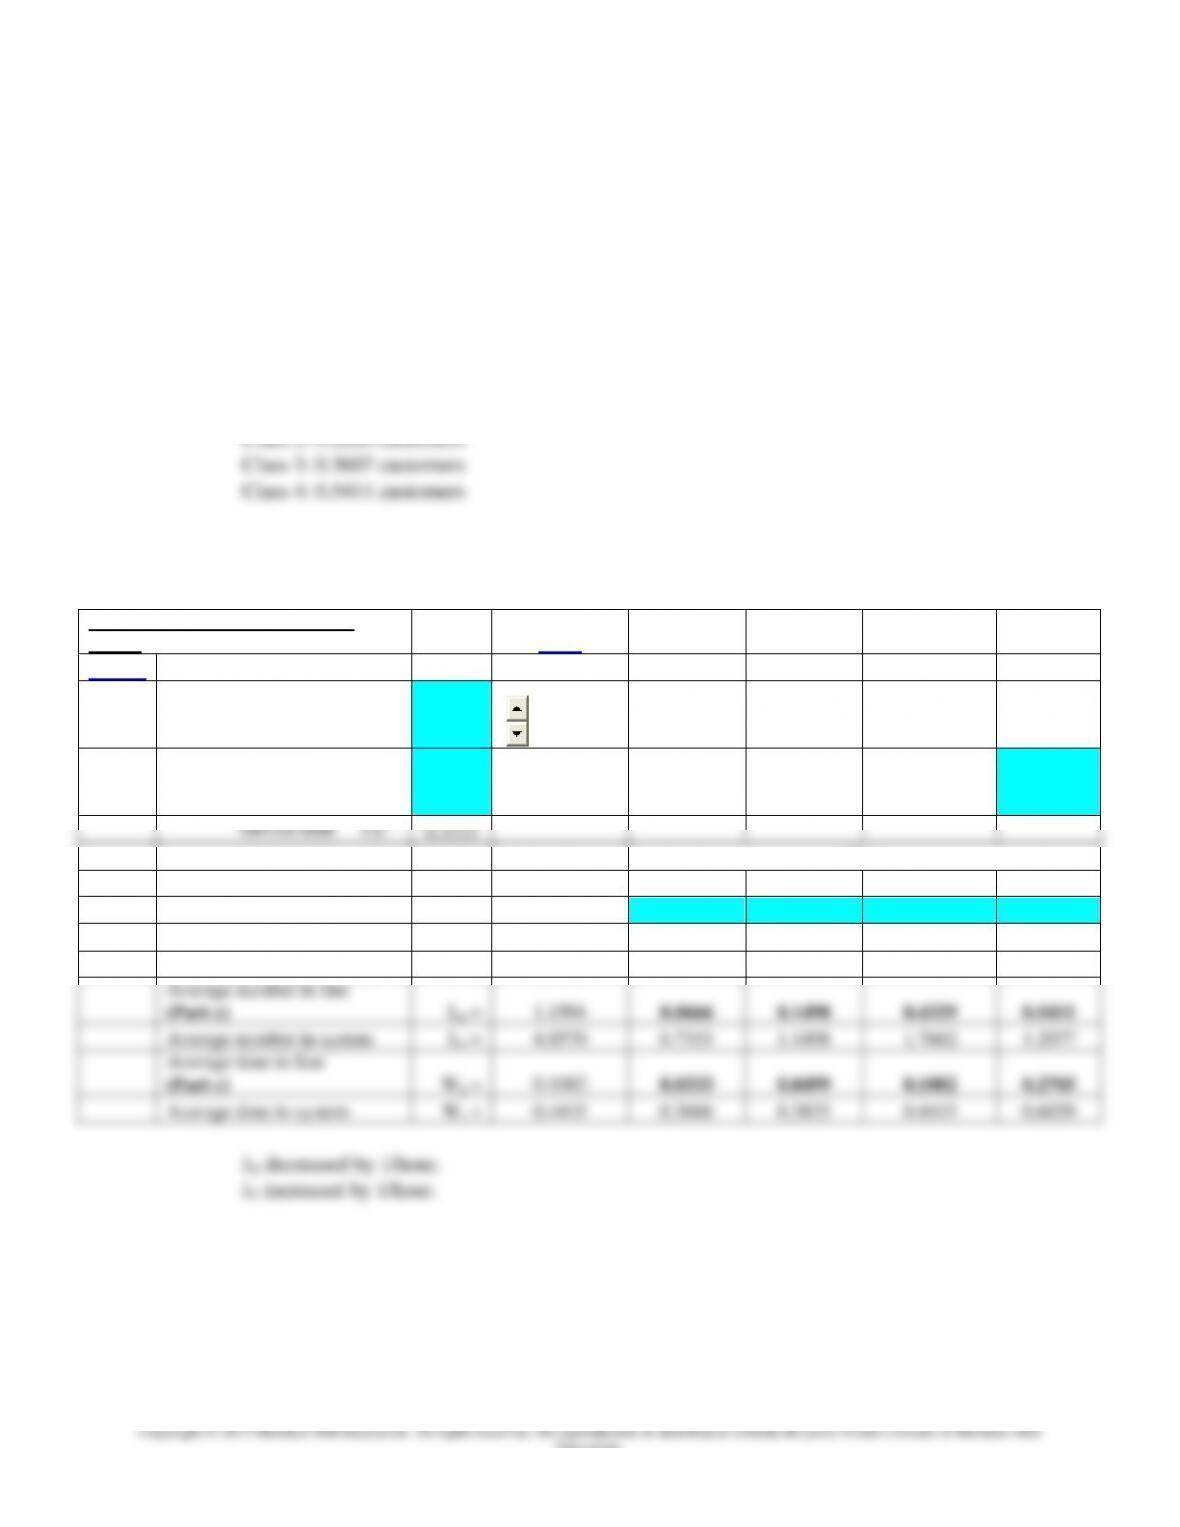
c. If the arrival rate of the second priority class could be reduced to 3 units per hour by shifting
some arrivals into the third priority class, how would the answers to Part b change?
Multiple Priorities Waiting Line
Model
Basic
<Back
Service rate =
3
Increment Δ =
1
Number of
servers M
=
5
Service time 1/ =
0.3333
Class
System
1
2
3
4
Arrival rate
=
11.0000
2
3
4
2
System Utilization
ρ =
0.7333
Probability system is empty
P0 =
0.0209
Average number in line
(Part c)
Lq =
1.1904
0.0666
0.1498
0.4329
0.5411
Average number in system
Ls =
4.8570
0.7333
1.1498
1.7662
1.2077
Average time in line
(Part c)
Wq =
0.1082
0.0333
0.0499
0.1082
0.2705
Average time in system
Ws =
0.4415
0.3666
0.3833
0.4415
0.6039
2 decreased by 1/hour.
3 increased by 1/hour.
Chapter 18 – Management of Waiting Lines
What is the average wait time for service by customers in the various classes (Wq in the
template)? The values that change are highlighted in bold below:
Class 1: 0.0333 hours
Class 2: 0.0499 hours
Class 3: 0.1082 hours
Class 4: 0.2705 hours
How many are waiting in each class, on average (Lq in the template)? The values that change
are highlighted in bold below:
Class 1: 0.0666 customers
Class 2: 0.1498 customers
Class 3: 0.4329 customers
Class 4: 0.5411 customers
d. What observations could you make based on your answers to Part c?
Only the performance measures for Class 2 and Class 3 were affected. All other values
remained the same.
Class 2 average wait time decreased by 0.0056 hours (0.0555 – 0.0499).
Class 3 average wait time decreased by 0.0120 hours (0.1202 – 0.1082).
18–33
Education.
17. Given:
Refer back to Problem 16. Now, each server can process an average of = 4 customers/hour.
A priority waiting system assigns arriving customers to one of four classes. Arrival rates
(Poisson) for the classes are shown below:
Class
Arrivals per Hour
1
2
2
4
3
3
4
2
M = 5
[Multiple priority model]
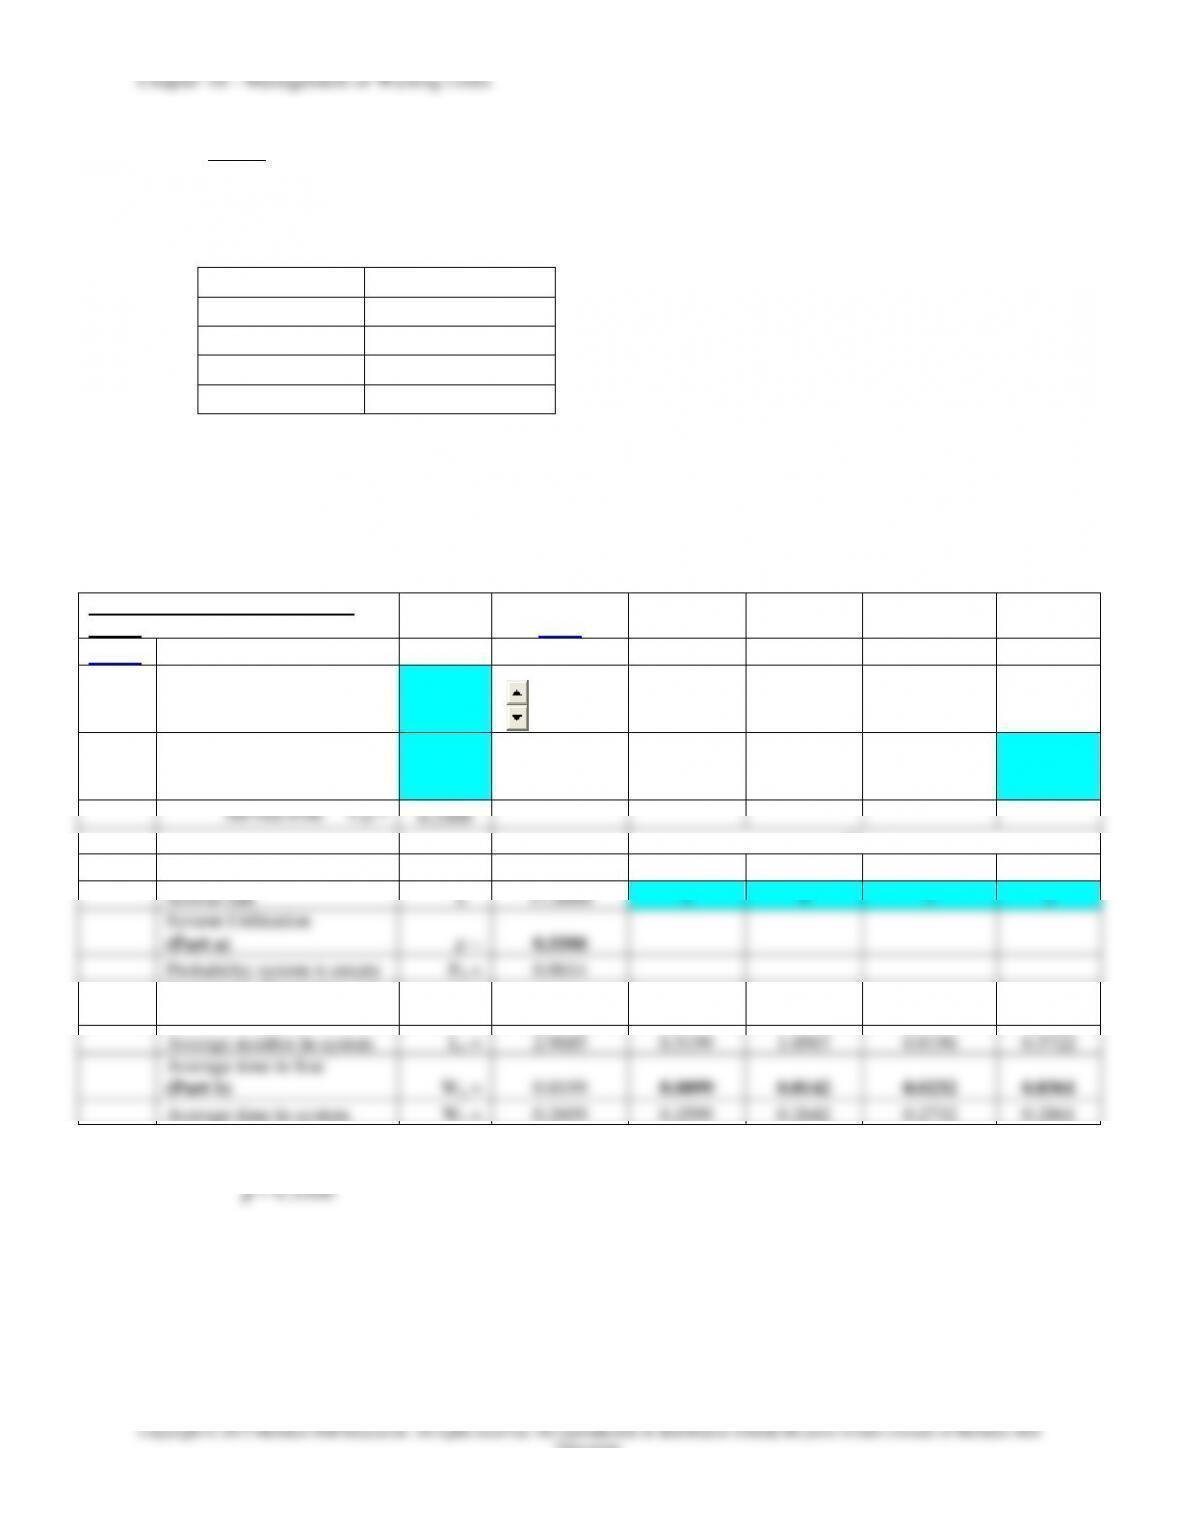
The solutions using the top part of the Multiple Priorities Waiting Line Template are highlighted
in bold below:
Multiple Priorities Waiting Line
Model
Basic
<Back
Service rate =
4
Increment Δ =
1
Number of
servers M
=
5
Service time 1/ =
0.2500
Class
System
1
2
3
4
Arrival rate
=
11.0000
2
4
3
2
System Utilization
(Part a)
ρ =
0.5500
Probability system is empty
P0 =
0.0614
Average number in line
(Part b)
Lq =
0.2185
0.0199
0.0567
0.0696
0.0722
Average number in system
Ls =
2.9685
0.5199
1.0567
0.8196
0.5722
Average time in line
(Part b)
Wq =
0.0199
0.0099
0.0142
0.0232
0.0361
Average time in system
Ws =
0.2699
0.2599
0.2642
0.2732
0.2861
a. What is the system utilization (ρ in the template)?
Chapter 18 – Management of Waiting Lines
18–34
b. What is the average wait time for service by customers in the various classes (Wq in the
template)?
Class 1: 0.0099 hours
Class 2: 0.0142 hours
How many are waiting in each class, on average (Lq in the template)?
Class 1: 0.0199 customers
Class 4: 0.0722 customers
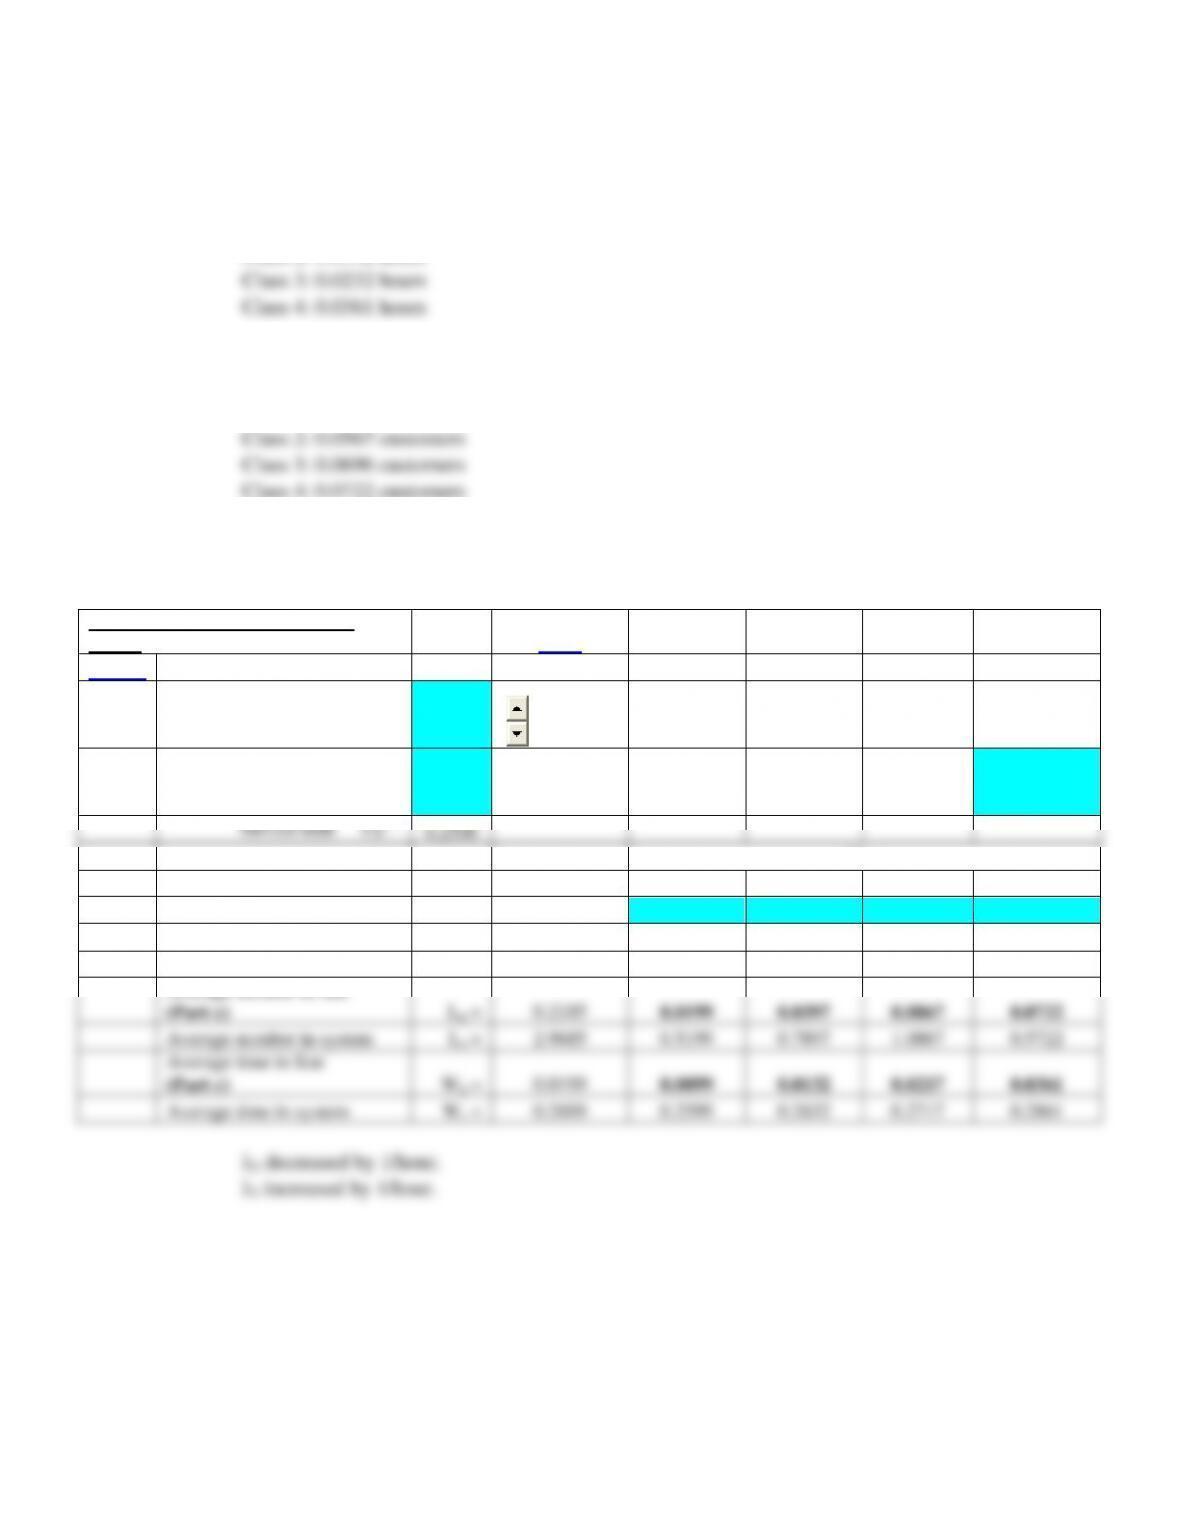
c. If the arrival rate of the second priority class could be reduced to 3 units per hour by shifting
some arrivals into the third priority class, how would the answers to Part b change?
Multiple Priorities Waiting Line
Model
Basic
<Back
Service rate =
4
Increment Δ =
1
Number of
servers
M =
5
Service time 1/ =
0.2500
Class
System
1
2
3
4
Arrival rate
=
11.0000
2
3
4
2
System Utilization
ρ =
0.5500
Probability system is empty
P0 =
0.0614
Average number in line
(Part c)
Lq =
0.2185
0.0199
0.0397
0.0867
0.0722
Average number in system
Ls =
2.9685
0.5199
0.7897
1.0867
0.5722
Average time in line
(Part c)
Wq =
0.0199
0.0099
0.0132
0.0217
0.0361
Average time in system
Ws =
0.2699
0.2599
0.2632
0.2717
0.2861
2 decreased by 1/hour.
3 increased by 1/hour.
Chapter 18 – Management of Waiting Lines
18–35
Education.
What is the average wait time for service by customers in the various classes (Wq in the
template)? The values that change are highlighted in bold below:
Class 1: 0.0099 hours
Class 4: 0.0361 hours
How many are waiting in each class, on average (Lq in the template)? The values that change
are highlighted in bold below:
d. What observations could you make based on your answers to Part c?
Only the performance measures for Class 2 and Class 3 were affected. All other values
remained the same.
Class 2 average wait time decreased by 0.0010 hours (0.0142 – 0.0132).
Class 3 average wait time decreased by 0.0015 hours (0.0232 – 0.0217).
Class 2 average number waiting decreased by 0.0170 customers (0.0567 – 0.0397).
Class 3 average number waiting increased by 0.0171 customers (0.0867 – 0.0696).
Conclusion: Shifting some of the arrivals from Class 2 to Class 3 reduced the average wait
time for both classes. In addition, the average number waiting decreased for Class 2, while
the average number waiting for Class 3 increased by an almost identical amount.
Answers from Problem 16:
18–36
18. Given:
Telephone calls arrive a rate of = 40 per hour (Poisson). Calls that cannot be answered
immediately are put on hold. The system can handle 8 callers on hold. If additional calls come in,
they receive a busy signal. The 3 customer service representatives spend an average of 3 minutes
with a customer.
We must solve for firstμ
= 60 minutes/hour / 3 minutes/customer = 20 customers/hour
a. What is the probability that a caller will get a busy signal?
We can use Excel to experiment with different values of K (carry K to four decimals) as
shown below:
Column
Row
A
B
C
D
1
K =
2
ρ =
Step 1:
Enter the value of ρ in Cell B2.
Step 2:
Chapter 18 – Management of Waiting Lines
Step 3:
Enter different values for K in Cell B1 until Cell D1 is close to 8 (the maximum number on
Chapter 18 – Management of Waiting Lines
18–38
Step 5:
Plug in K = 0.0390 in the formula below and solve for the Specified %:
b. What is the probability that a customer will be put on hold?
Chapter 18 – Management of Waiting Lines
18–39
Education.
Case: Big Bank
Given:
= 80 customers/hour.
Average processing time for customers with a single transaction = 90 seconds, while the processing time
for customers with multiple transactions = 4 minutes.
60% of customers are expected to have multiple transactions.
Option a) One waiting line and have the first person in line go to the next available teller.
We must determine the average processing time first:
Average processing time for Option a:
Average processing time = 0.60(4 minutes/customer) + 0.40(1.5 minutes/customer) = 3 minutes/customer
= 60 minutes/hour / 3 minutes/customer = 20 customers/hour
[Multiple Servers, M/M/S]
Chapter 18 – Management of Waiting Lines
Option b) Two waiting lines: One teller for customers who have a single transaction and four tellers who
handle customers who have multiple transactions.
One teller (M/M/1):
= 0.40 x 80 customers/hour = 32 customers/hour
= 60 minutes/hour / 1.5 minutes/customer = 40 customers/hour
Four tellers (M/M/S):
[Multiple Servers, M/M/S]
= 0.60 x 80 customer/hour = 48 customers/hour
= 60 minutes/customer / 4 minutes/customer = 15 customers/hour
Summary
Option Average waiting time in the line
a 0.028 hours
b Single 0.100 hours
Multiple 0.050 hours
The results indicate that the better choice would be to use a single line with five tellers processing both
single and multiple transactions. The disparity comes from the assumption (see the last assumption
below) that the idle tellers do not process customers from the “other” waiting line.
Assumptions: