Chapter 10 – Quality Control
10–11
Education.
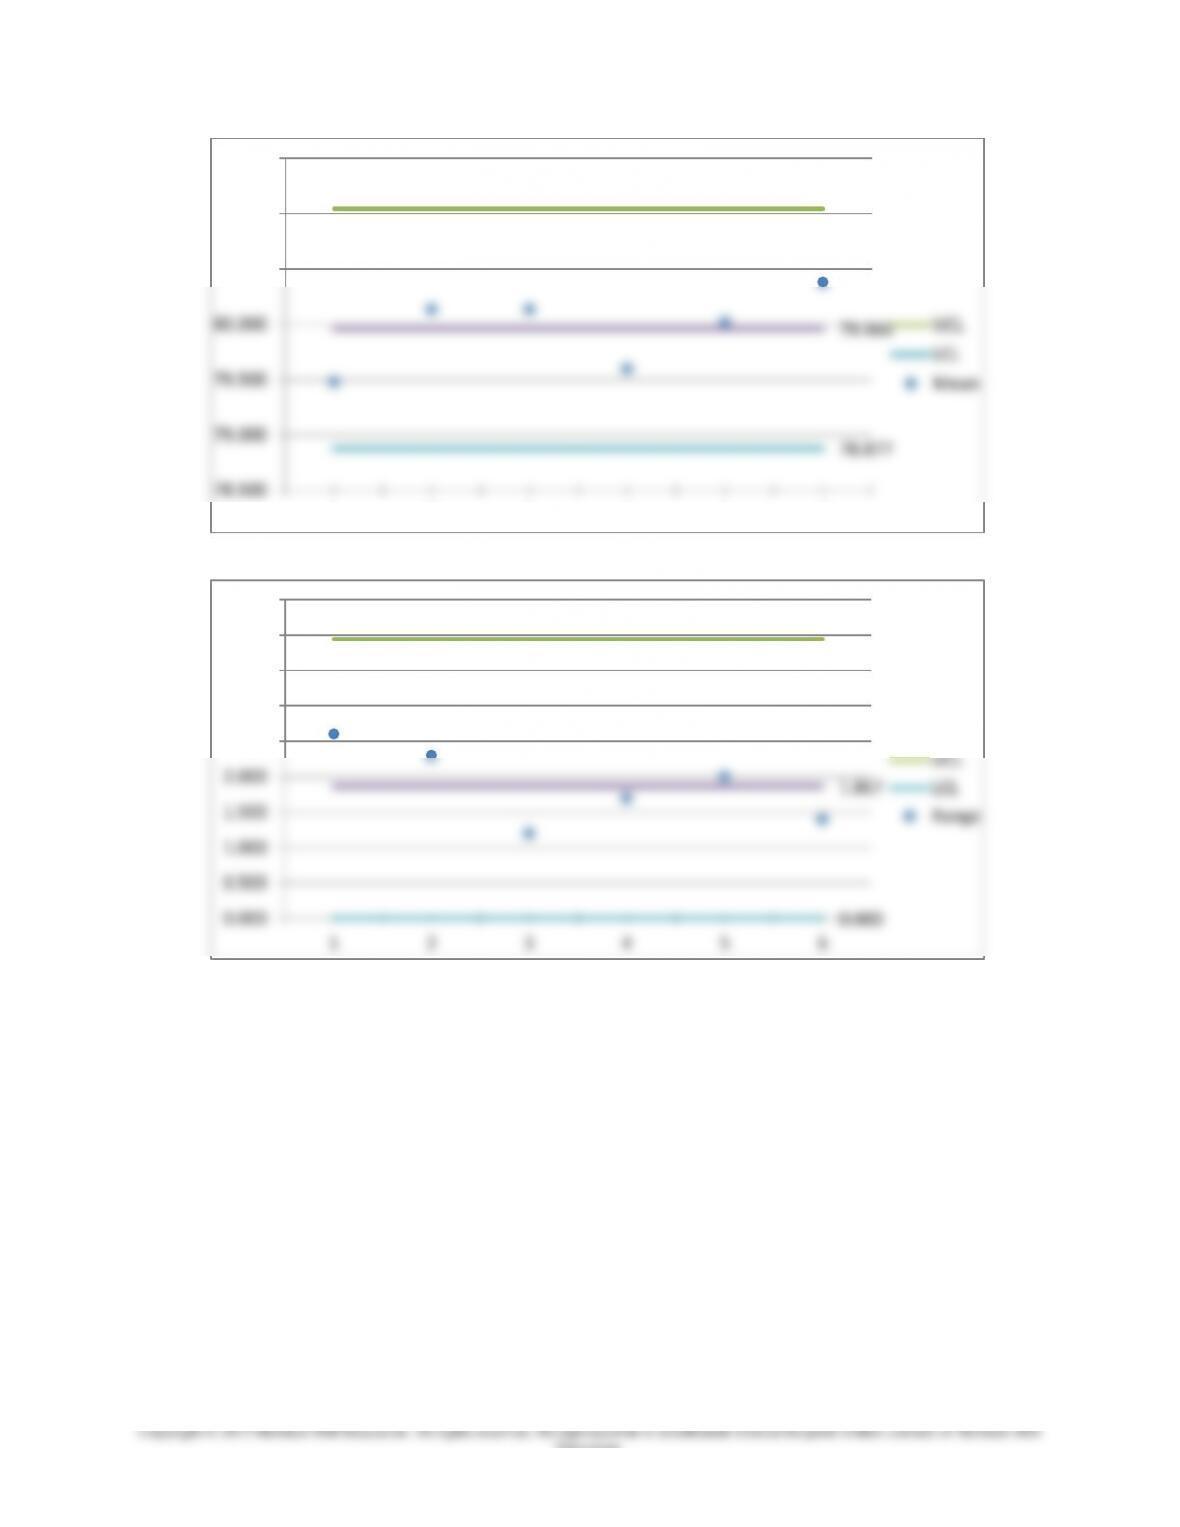
All sample means are within the control limits on the Mean chart.
All sample ranges are within the control limits on the Range chart.
The process is in control.
81.043
79.960
78.877
78.500
79.000
79.500
80.000
80.500
81.000
81.500
1 2 3 4 5 6
Mean Chart
UCL
LCL
Mean
3.939
1.867
0.000
0.000
0.500
1.000
1.500
2.000
2.500
3.000
3.500
4.000
4.500
1 2 3 4 5 6
Range Chart
UCL
LCL
Range
5. Given:
Four samples of 200 credit card statements each were taken and the number with errors recorded
as shown below:
Sample
1
2
3
4
# with errors
4
2
5
9
a. Determine the fraction (proportion) defective for each sample. Round all values to a
maximum of four decimals.
Sample
1
2
3
4
# with errors
4
2
5
9
Prop. defective
(# with errors/200)
.020
.010
.025
.045
b. If the true fraction (proportion) defective is unknown, estimate the fraction defective. Round
all values to a maximum of four decimals.
(.020 + .010 + .025 + .045)/4 = .025
c. Estimate the mean and the standard distribution of the sampling distribution. Round all
values to a maximum of four decimals.
Chapter 10 – Quality Control
10–13
Education.
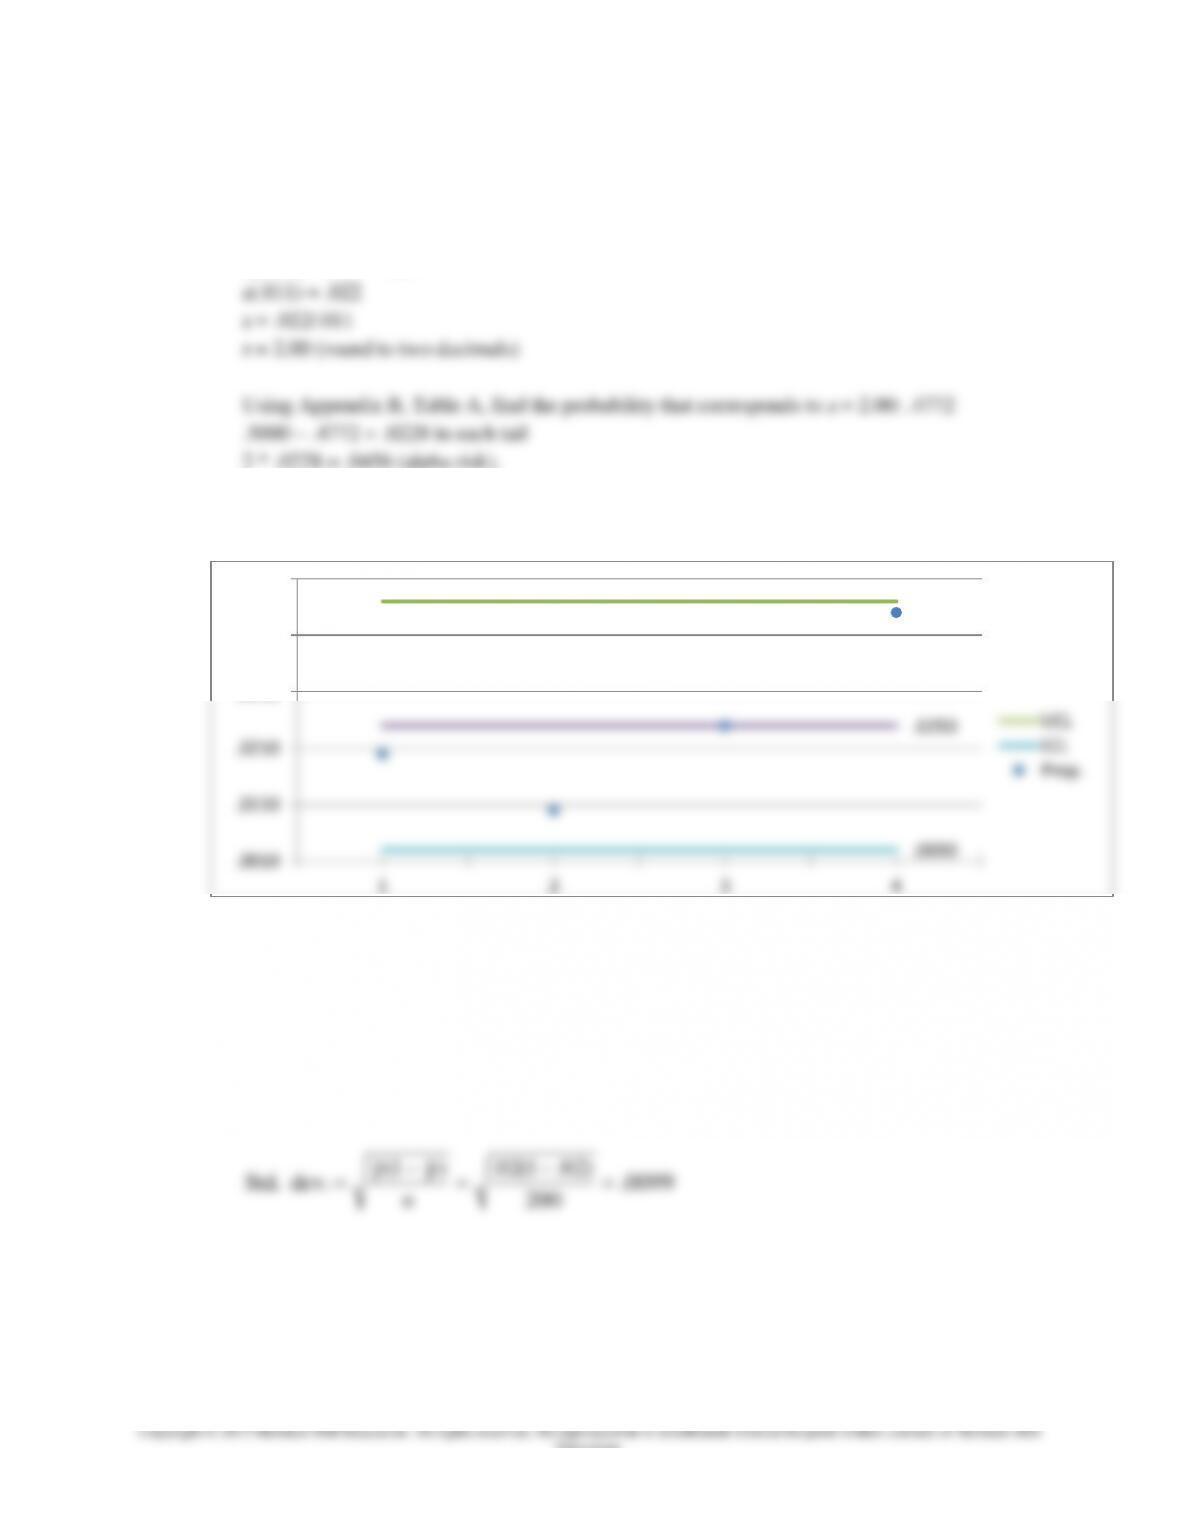
e. Determine the alpha risk provided by control limits of .047 and .003.
We know the following: .025 + z(.011) = .047
Solve for z:
z(.011) = .047 – .025
f. Using the control limits from part e, determine if the process is in control.
All points fall within the limits. The process is in control.
g. Assume that the long-run fraction (proportion) defective = 2% = .02. Determine the mean and
standard deviation of the sampling distribution. Round all intermediate values to a maximum
of four decimals. Round all p–Chart control limits to four decimals.
Mean = .02
0099.
200
)02.1(02.)1(
.dev Std.
n
pp
.0470
.0250
.0030
.0010
.0110
.0210
.0310
.0410
.0510
1 2 3 4
p-Chart
UCL
LCL
Prop.
Chapter 10 – Quality Control
h. Construct a control chart for the process, assuming a fraction (proportion) defective of 2%
(.02) using two-sigma control limits. Round all intermediate values to a maximum of four
decimals. Round all p-Chart control limits to four decimals.
LCL = .0002
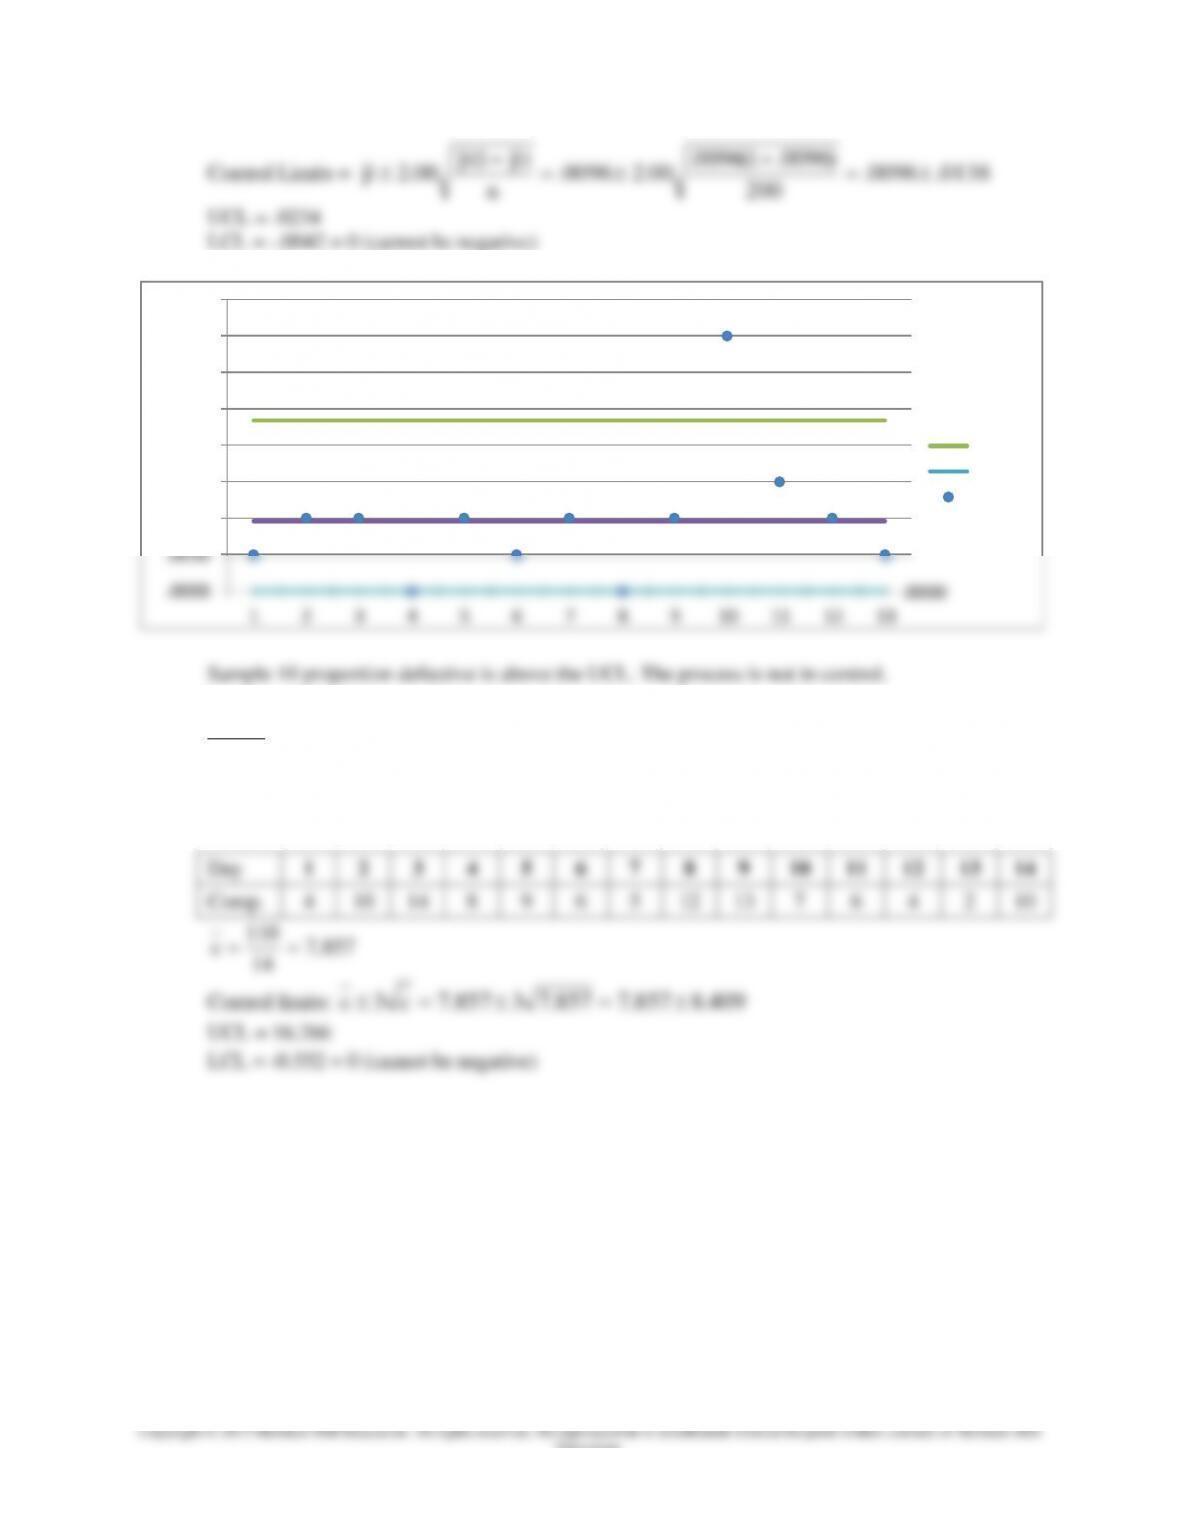
Sample 4 proportion defective is above the upper control limit. The process is not in control.
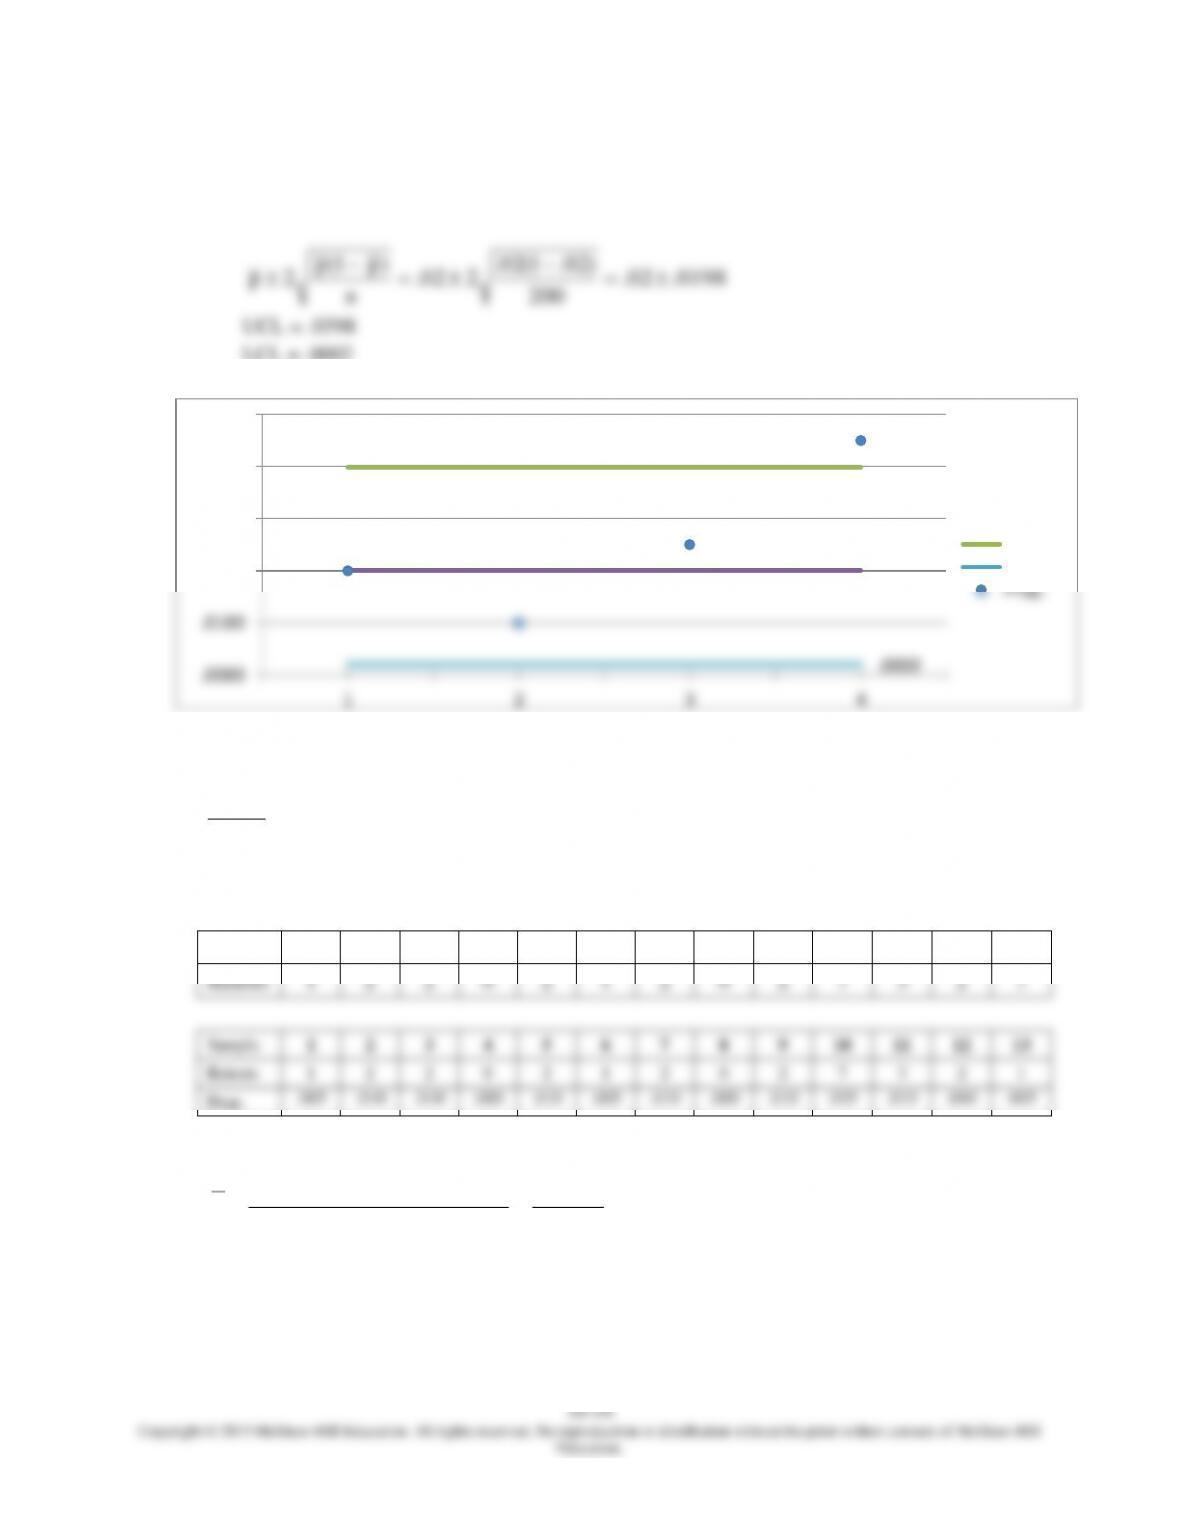
6. Given:
Samples of n = 200 were taken. The fraction (proportion) defective for 13 samples are given
below. Construct two-sigma control limits. Round all intermediate values to a maximum of four
decimals. Round all p-Chart control limits to four decimals.
Sample
1
2
3
4
5
6
7
8
9
10
11
12
13
Retests
1
2
2
0
2
1
2
0
2
7
3
2
1
Sample
1
2
3
4
5
6
7
8
9
10
11
12
13
Retests
1
2
2
0
2
1
2
0
2
7
3
2
1
Prop.
.005
.010
.010
.000
.010
.005
.010
.000
.010
.035
.015
.010
.005
Total number of defects = 25
0096.
)200(13
25
nsobservatio ofnumber total
defectives ofnumber total
p
.0398
.0200
.0002
.0000
.0100
.0200
.0300
.0400
.0500
p-Chart
UCL
LCL
Prop.
Chapter 10 – Quality Control
10–15
Education.
)0096.1(0096.
)1(
pp
7. Given:
The postmaster of a small town has recorded the number of complaints per day. Determine three-
sigma control limits using the data below. Round all intermediate values to a maximum of three
decimals. Round all c-Chart control limits to three decimals.
Day
1
2
3
4
5
6
7
8
9
10
11
12
13
14
Comp.
4
10
14
8
9
6
5
12
13
7
6
4
2
10
857.7
14
110
c
Control limits:
409.8857.7857.73857.73 cc
UCL = 16.266
LCL = –0.552 = 0 (cannot be negative)
.0234
.0096
.0000
.0000
.0050
.0100
.0150
.0200
.0250
.0300
.0350
.0400
1 2 3 4 5 6 7 8 9 10 11 12 13
p-Chart
UCL
LCL
Prop.
Copyright © 2015 McGraw-Hill Education. All rights reserved. No reproduction or distribution without the prior written consent of McGraw-Hill
Education.
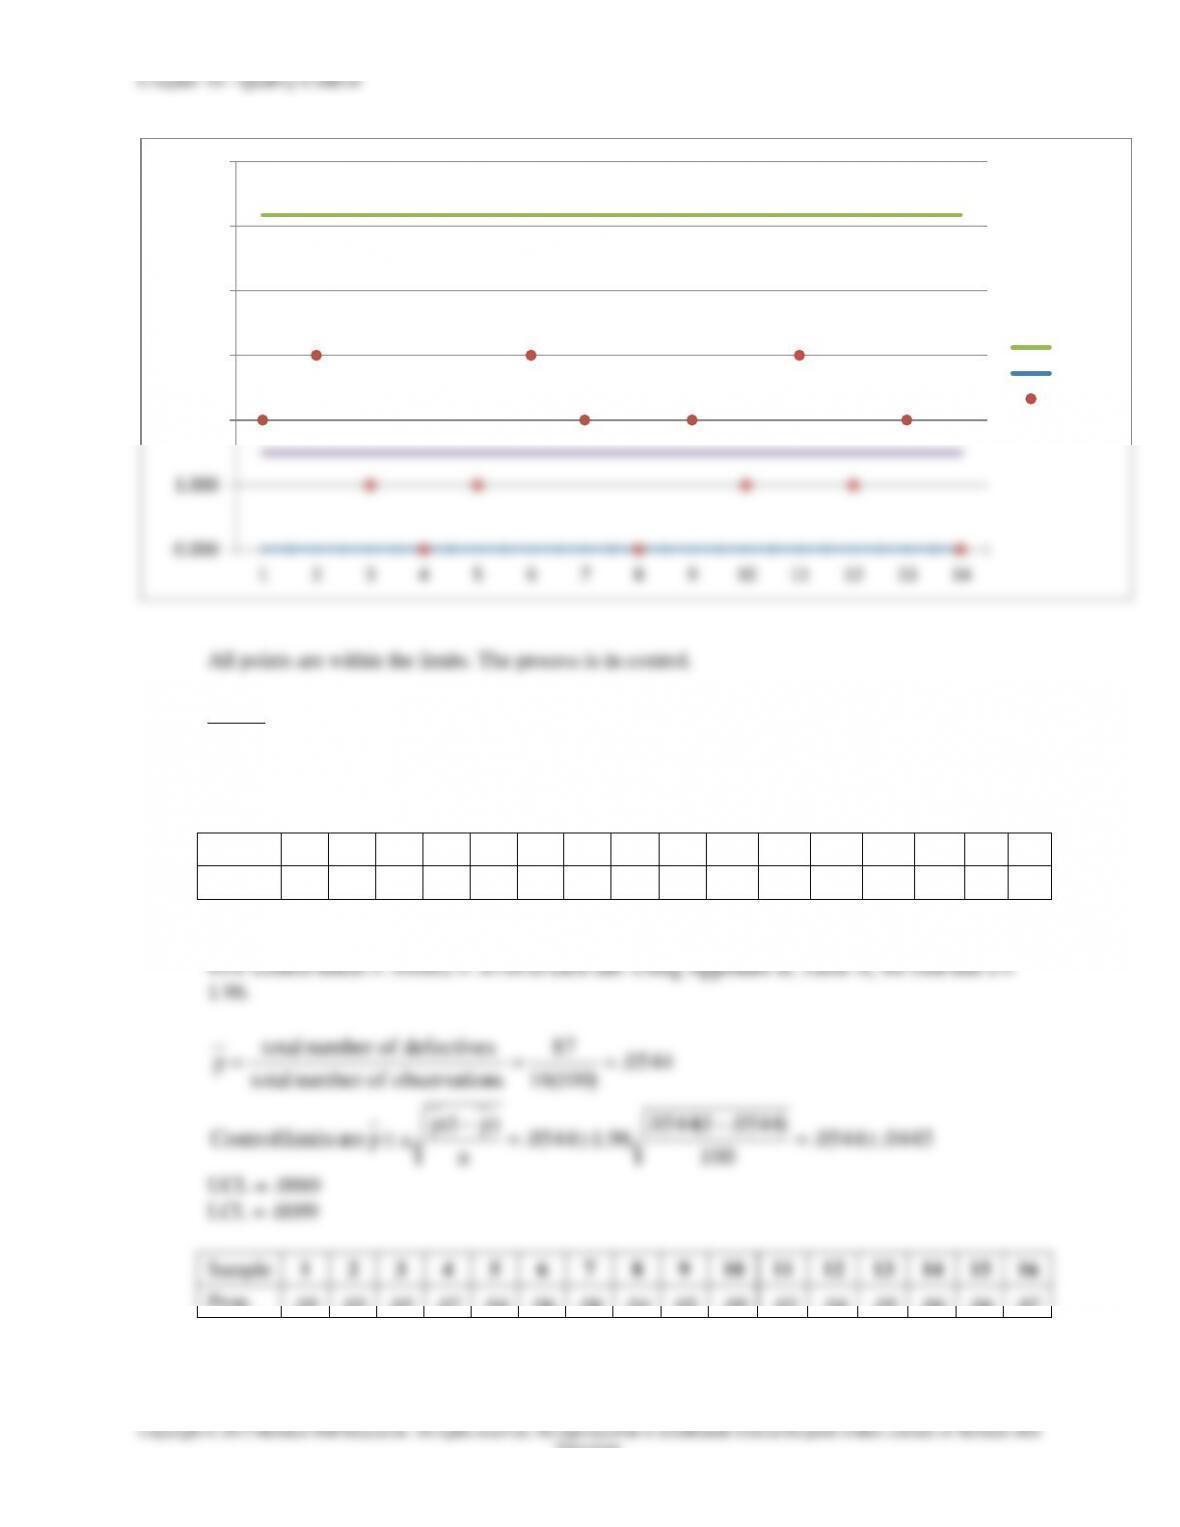
8. Given:
Given the following data on number of defects per spool of cable, determine three-sigma control
limits. Round all intermediate values to a maximum of three decimals. Round all c-Chart control
limits to three decimals.
UCL = 5.174
10–17
Education.
9. Given:
A telephone company took 16 samples of 100 calls as shown below. Determine 95% control
limits. Round all intermediate values to a maximum of four decimals. Round all p-Chart control
limits to four decimals.
Sample
1
2
3
4
5
6
7
8
9
10
11
12
13
14
15
16
Errors
5
3
5
7
4
6
8
4
5
9
3
4
5
6
6
7
Total number of defects = 87
Sample
1
2
3
4
5
6
7
8
9
10
11
12
13
14
15
16
Prop.
.05
.03
.05
.07
.04
.06
.08
.04
.05
.09
.03
.04
.05
.06
.06
.07
0.000
1.000
2.000
3.000
4.000
5.000
6.000
1 2 3 4 5 6 7 8 9 10 11 12 13 14
c-Chart
UCL
LCL
Defects
Chapter 10 – Quality Control
Education.
10. Given:
A tool wears at the rate of .004 centimeters per piece, i.e., the metal shaft will increase by .004
centimeters per piece. The process sigma = .02 centimeters. Specifications are set at 15.0 to 15.2
centimeters. A three-sigma cushion is set. Determine the number of shafts that can be processed
before tool replacement becomes necessary. Round all values to a maximum of three decimals.
The key is that the mean starts low and then drifts up by .004 centimeters per piece.
1) Observe that the process mean starts at three-sigma above the lower specification limit:
15.0 + 3(.02) = 15.06
.0989
.0544
.0099
.0000
.0500
.1000
.1500
p-Chart
UCL
LCL
Prop.
10–19
Education.
11. Given:
Specifications are 78 to 81 minutes for the computer upgrades from Problem 4. Estimate the % of
process output that can be expected to fall within 78 to 81 minutes. The data from Problem 4 are
repeated below.
Sample
1
2
3
4
5
6
79.2
80.5
79.6
78.9
80.5
79.7
78.8
78.7
79.6
79.4
79.6
80.6
80.0
81.0
80.4
79.7
80.4
80.5
78.4
80.4
80.3
79.4
80.8
80.0
81.0
80.1
80.8
80.6
78.8
81.1
Looking at the data above, we see that there are 30 total points, and 1 point (3.33% of the total) is
outside the specifications limits.
12. Given:
We have the following sample means for a process below (n = 14 units per sample). The process
standard deviation is .146.
Sample
Mean
Sample
Mean
Sample
Mean
Sample
Mean
1
3.86
11
3.88
21
3.84
31
3.88
2
3.90
12
3.86
22
3.82
32
3.76
3
3.83
13
3.88
23
3.89
33
3.83
4
3.81
14
3.81
24
3.86
34
3.77
5
3.84
15
3.83
25
3.88
35
3.86
6
3.83
16
3.86
26
3.90
36
3.80
7
3.87
17
3.82
27
3.81
37
3.84
8
3.88
18
3.86
28
3.86
38
3.79
9
3.84
19
3.84
29
3.98
39
3.85
10
3.80
20
3.87
30
3.96
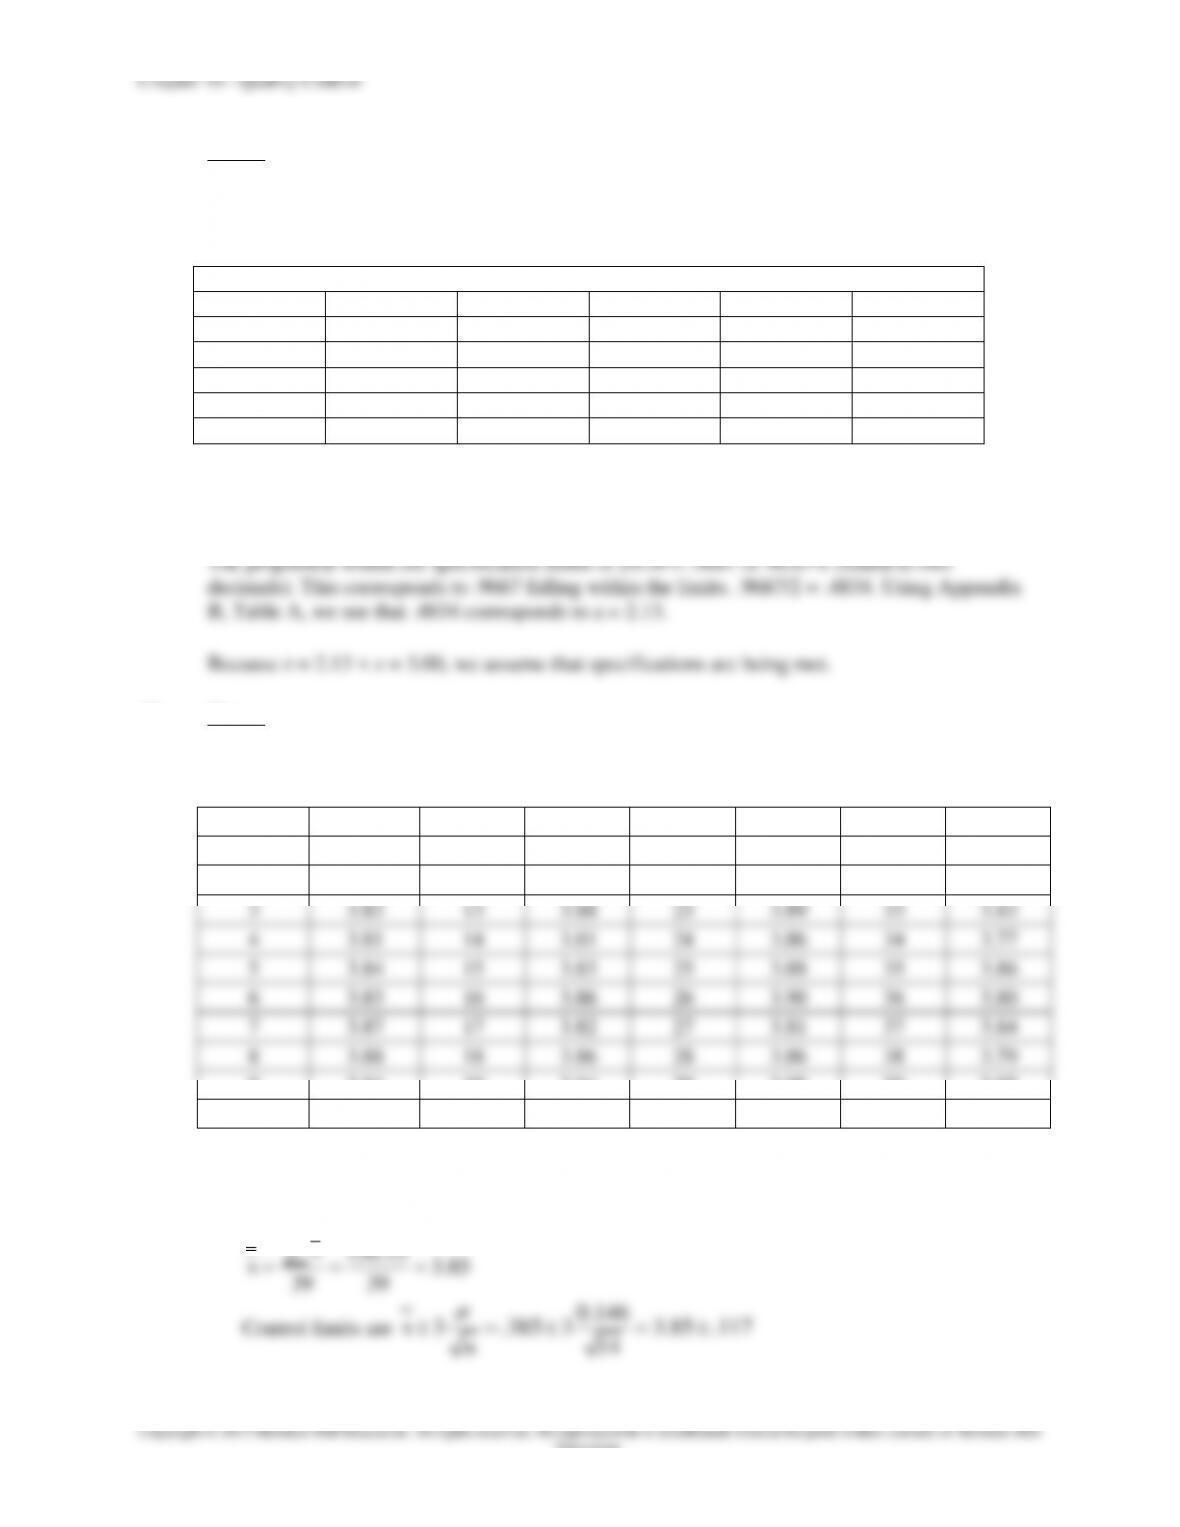
a. Round intermediate values to a maximum of three decimals. Round Mean control limits to
three decimals.
85.3
39
15.150
39 x
x
Control limits are
0.146
3 .385 3 3.85 .117
14
xn
Chapter 10 – Quality Control
10–20
Education.
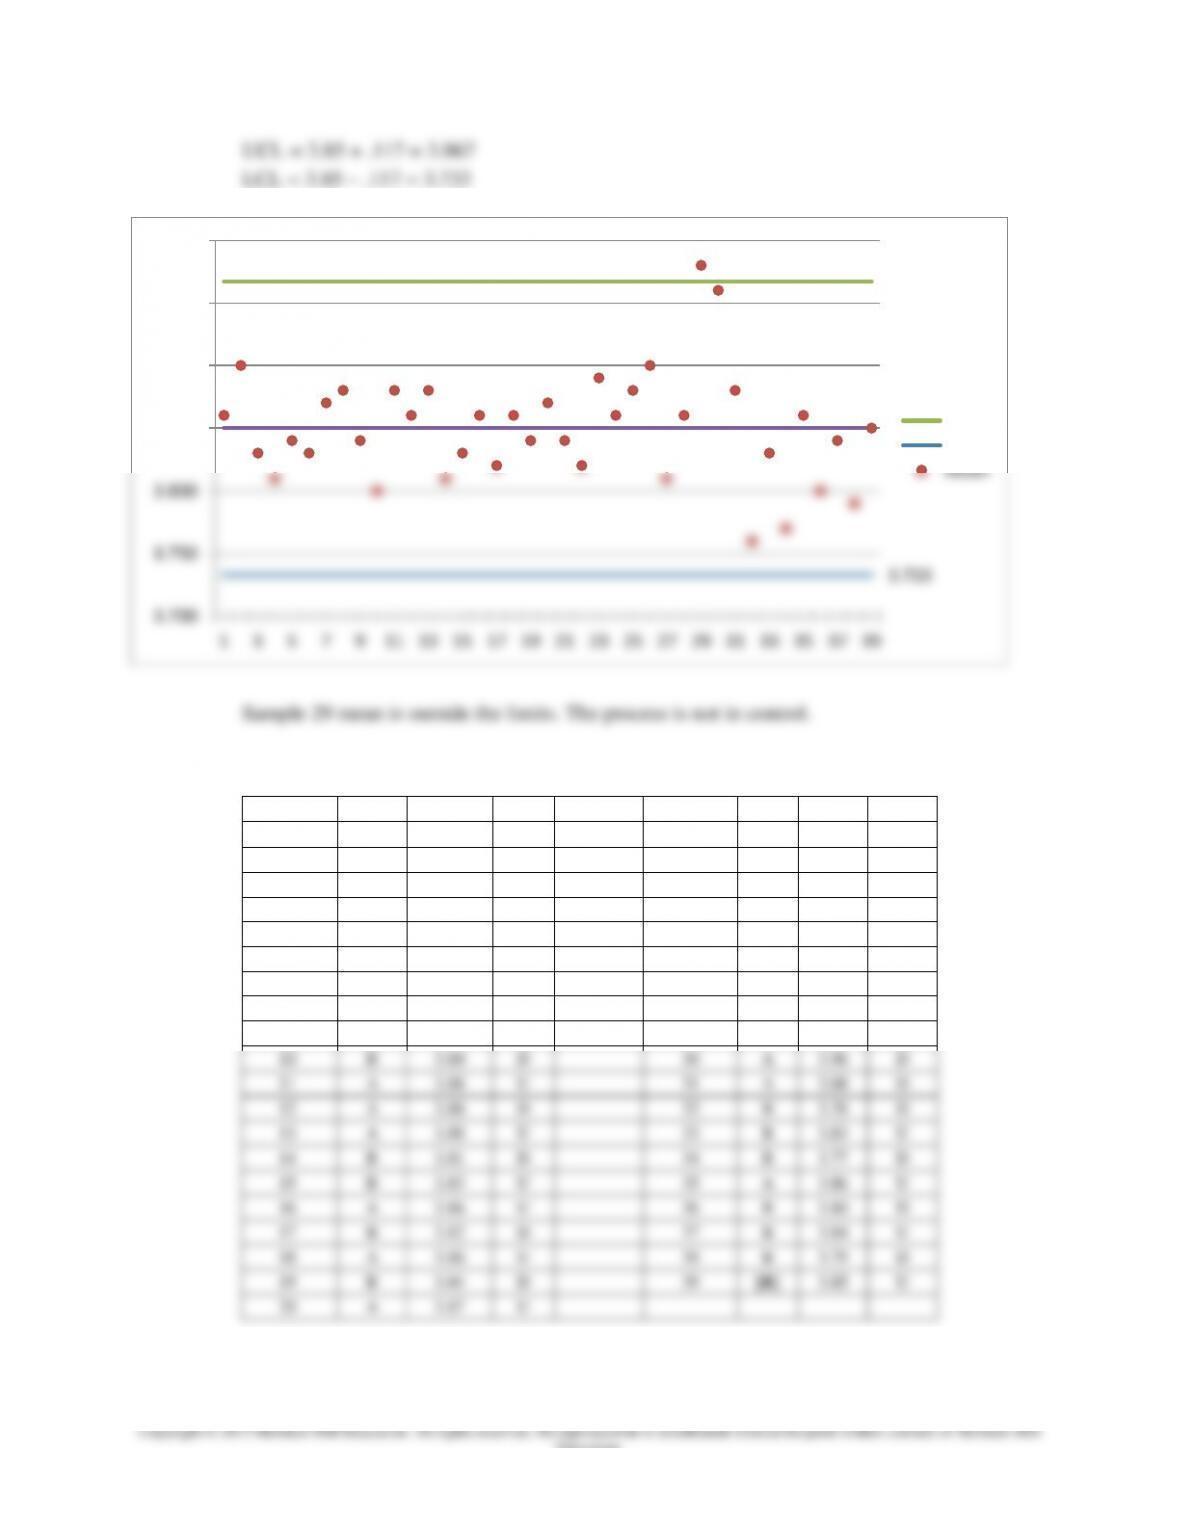
b. Analyze the data using a median run test and an up/down run test.
Median is 3.85. The original data are transformed below to A/B and U/D.
Sample
A/B
Mean
U/D
Sample
A/B
Mean
U/D
1
A
3.86
21
B
3.84
D
2
A
3.90
U
22
B
3.82
D
3
B
3.83
D
23
A
3.89
U
4
B
3.81
D
24
A
3.86
D
5
B
3.84
U
25
A
3.88
U
6
B
3.83
D
26
A
3.90
U
7
A
3.87
U
27
B
3.81
D
8
A
3.88
U
28
A
3.86
U
9
B
3.84
D
29
A
3.98
U
10
B
3.80
D
30
A
3.96
D
11
A
3.88
U
31
A
3.88
D
12
A
3.86
D
32
B
3.76
D
13
A
3.88
U
33
B
3.83
U
14
B
3.81
D
34
B
3.77
D
15
B
3.83
U
35
A
3.86
U
16
A
3.86
U
36
B
3.80
D
17
B
3.82
D
37
B
3.84
U
18
A
3.86
U
38
B
3.79
D
19
B
3.84
D
39
[B]
3.85
U
20
A
3.87
U