Chapter 13 Financial Statement Analysis
9-1
The remaining figures can only be found by using the debt to assets ratio of 40% times total
assets to determine total liabilities (0.40 x $675,000 = $270,000.) From this the remaining
figures fall into place.
Problem 9-21
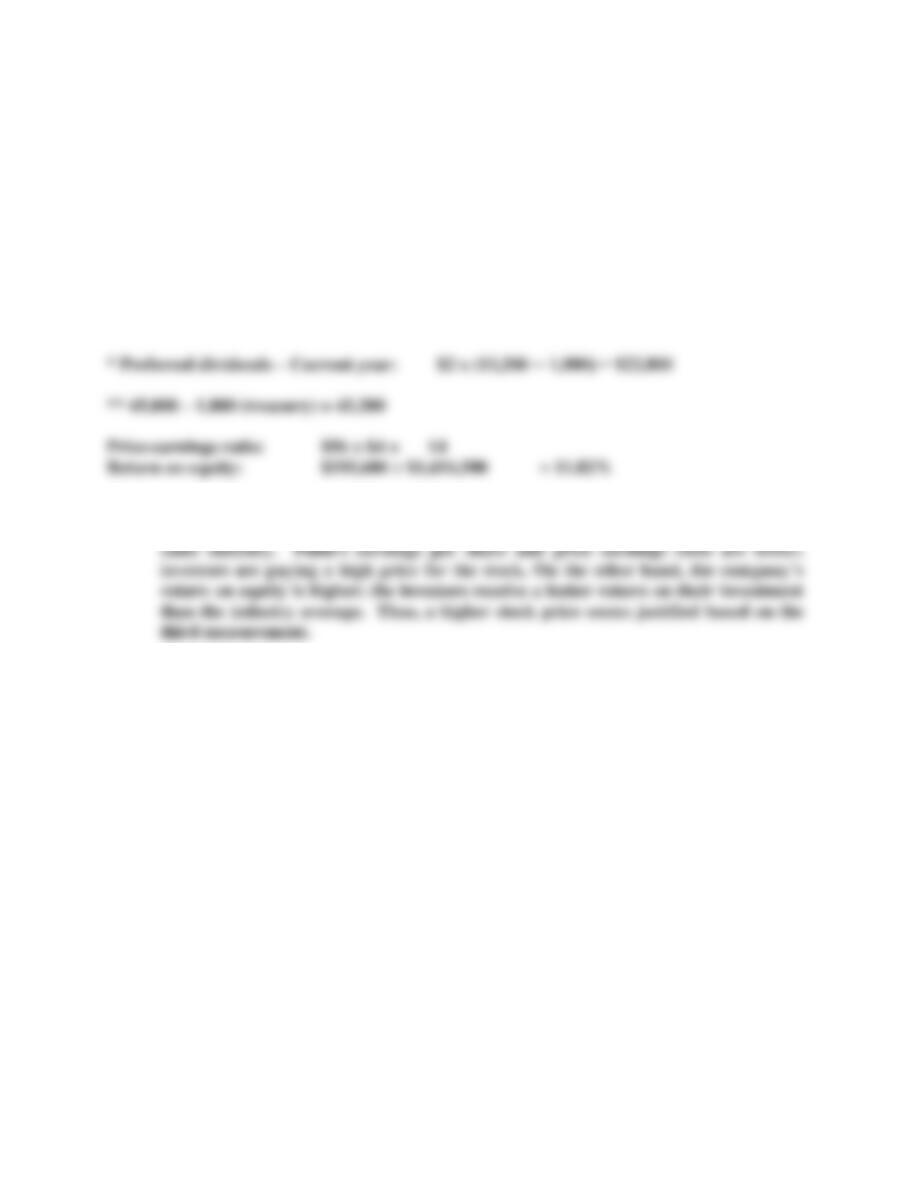
a. Earnings per share:
$195,600 – $22,800*
———————————— = $4 per share
43,200**
b. From this information only, investors should be cautious about buying Putin’s stock.
These three ratios provide mixed results in comparison with other companies in the
2
9-2
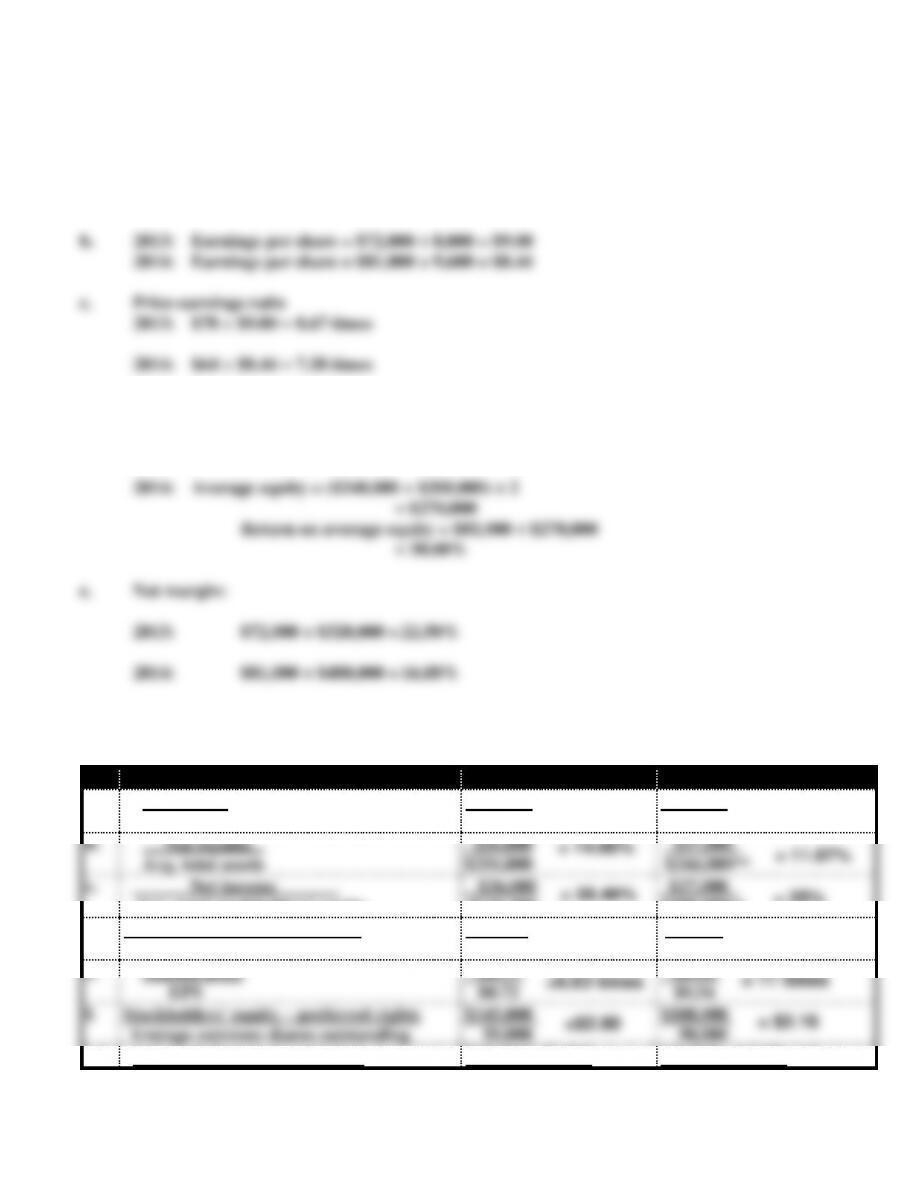
Problem 9-22
a. Times interest earned
2013: $98,000 ÷ $8,000 = 12.25 times
2014: $120,000 ÷ $9,000 = 13.33 times
d. 2013: Average equity = ($200,000+$240,000)÷2 =$220,000
Return on average equity = $72,000 ÷ $220,000
= 32.73%
Problem 9-23
2015
2014
a.
Net income
Net sales
$36,000
$210,000
$27,000
$175,000
b.
Net income
Avg. total assets
$36,000
$256,000
$27,000
$244,000**
c.
Net income
Avg. total stockholders’ equity
$36,000
$126,500
$27,000
$108,000**
d.
Net income
Avg. common shares outstanding
$36,000
50,000
$27,000
50,000
e.
Market price
EPS
$4.77
$0.72
$5.94
$0.54
f.
Stockholders’ equity – preferred rights
Average common shares outstanding
$145,000
50,000
$108,000
50,000
g.*
Income before taxes + Interest
$53,000*+$3,000
$45,000 + $3,000
= 17.14%
= 15.43%
= 28.46%
= 11.07%
= 14.06%
= 25%
= $0.72
= $0.54
=6.63 times
= 11 times
=$2.90
= $2.16
= 18.67
times
= 16
times
3
9-3
Interest
$3,000
$ 3,000
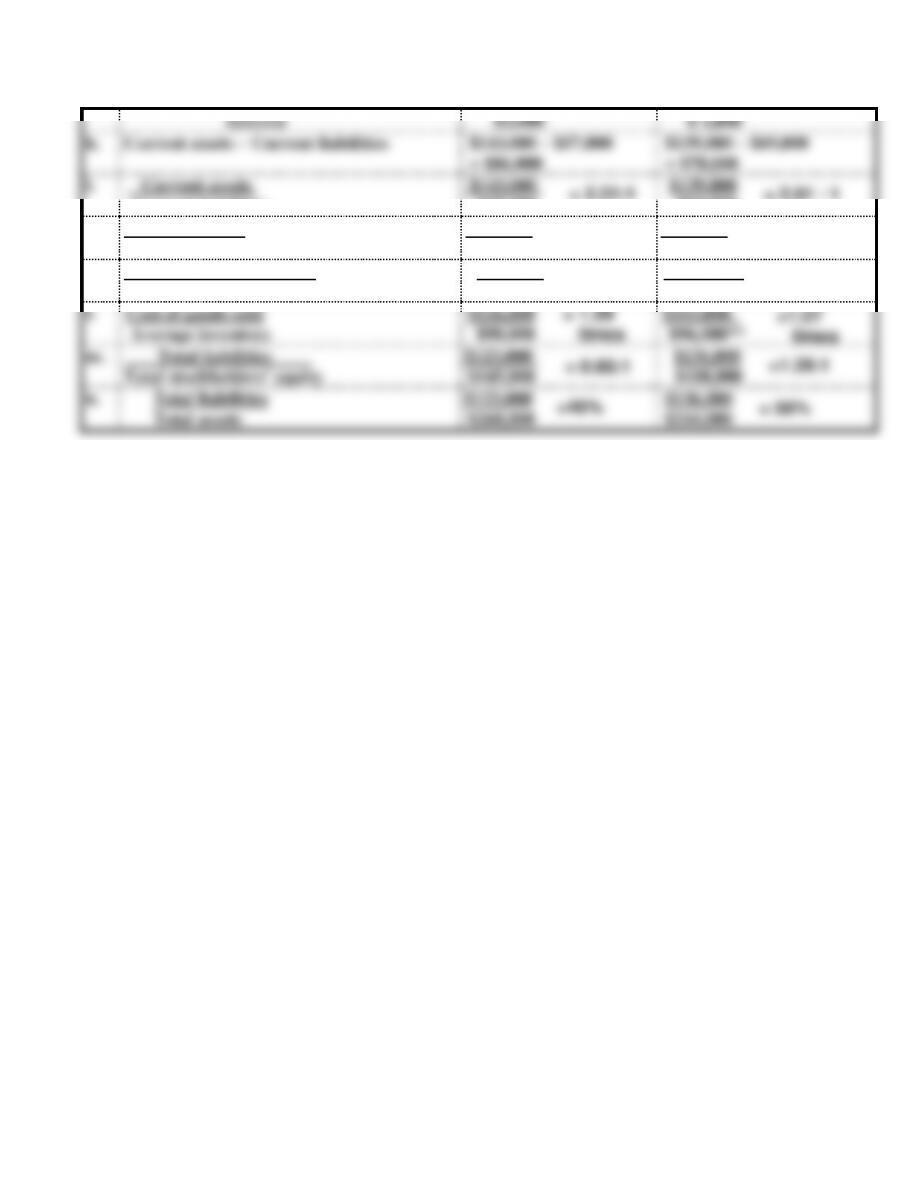
h.
Current assets – Current liabilities
$143,000 – $57,000
= $86,000
$139,000 – $69,000
= $70,000
i.
Current assets
Current liabilities
$143,000
$57,000
$139,000
$69,000
j.
Quick assets
Current liabilities
$40,000
$57,000
$41,000
$69,000
k.
Net sales
Average accounts receivable
$210,000
$33,500
$175,000
$32,000**
l.
Cost of goods sold
Average inventory
$126,000
$98,000
$103,000
$96,000**
m.
Total liabilities
Total stockholders’ equity
$123,000
$145,000
$136,000
$108,000
n.
Total liabilities
Total assets
$123,000
$268,000
$136,000
$244,000
* Note that the computation omits extraordinary items. This practice is logical because, by
definition, extraordinary items cannot be expected to recur and, therefore, will not be
available to satisfy future interest payments.
**Averages cannot be computed from the data provided in the problem.
= 2.51:1
= 2.01 : 1
= 0.70:1
=0.59 : 1
= 6.27
times
=5.47
times
= 1.29
times
=1.07
times
= 0.85:1
=1.26:1
=46%
= 56%
4
9-4
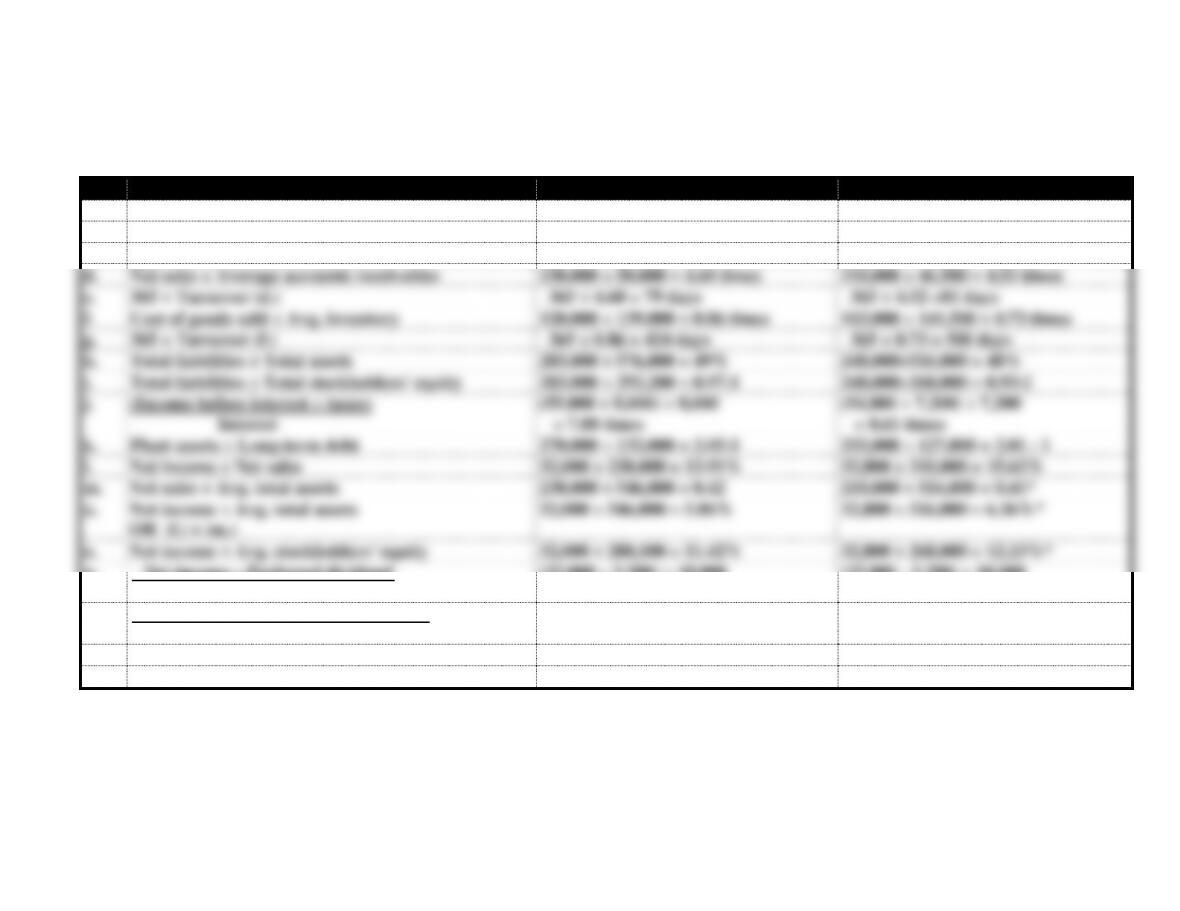
Problem 9-24
Because of space limitation, $ signs are omitted in these computations.
2015
2014
a.
Current assets – Current liabilities
250,000 – 151,800 = 98,200
217,000 – 121,000 = 96,000
b.
Current assets ÷ Current liabilities
250,000 ÷ 151,800 = 1.65 : 1
217,000 ÷ 121,000 = 1.79 : 1
c.
Quick assets ÷ Current liabilities
90,000 ÷ 151,800 = 0.59 : 1
64,000 ÷ 121,000 = 0.53 : 1
d.
Net sales ÷ Average accounts receivables
230,000 ÷ 50,000 = 4.60 times
210,000 ÷ 46,500 = 4.52 times
e.
365 ÷ Turnover (d.)
365 ÷ 4.60 = 79 days
365 ÷ 4.52 =81 days
f.
Cost of goods sold ÷ Avg. inventory
120,000 ÷ 139,000 = 0.86 times
103,000 ÷ 141,500 = 0.73 times
g.
365 ÷ Turnover (f.)
365 ÷ 0.86 = 424 days
365 ÷ 0.73 = 500 days
h.
Total liabilities ÷ Total assets
283,800 ÷ 576,000 = 49%
248,000÷516,000 = 48%
i.
Total liabilities ÷ Total stockholders’ equity
283,800 ÷ 292,200 = 0.97:1
248,000÷268,000 = 0.93:1
j.
(Income before interest + taxes)
Interest
(55,000 + 8,000) ÷ 8,000
= 7.88 times
(54,800 + 7,200) ÷ 7,200
= 8.61 times
k.
Plant assets ÷ Long-term debt
270,000 ÷ 132,000 = 2.05:1
255,000 ÷ 127,000 = 2.01 : 1
l.
Net income ÷ Net sales
32,000 ÷ 230,000 = 13.91%
32,800 ÷ 210,000 = 15.62%
m.
Net sales ÷ Avg. total assets
230,000 ÷ 546,000 = 0.42
210,000 ÷ 516,000 = 0.41*
n.
Net income ÷ Avg. total assets
OR (l.) x (m.)
32,000 ÷ 546,000 = 5.86%
32,800 ÷ 516,000 = 6.36%*
o.
Net income ÷ Avg. stockholders’ equity
32,000 ÷ 280,100 = 11.42%
32,800 ÷ 268,000 = 12.23%*
p.
Net income – Preferred dividend
Avg. common shares outstanding
(32,000 – 3,200) ÷ 10,000
= $2.88 per share
(32,800 – 3,200) ÷ 10,000
= $2.96 per Share
q.
Stockholders’ equity – Preferred rights
Avg. common shares outstanding
(292,200 – 80,000) ÷ 10,000
= $21.22 per Share
(268,000 – 80,000) ÷ 10,000
= $18.80 per Share
r.
Market price ÷ EPS
12.50 ÷ 2.88 = 4.34
11.75 ÷ 2.96 = 3.97
s.
Dividends per share ÷ Market price
0.46 ÷ 12.50 = 3.68 %
0.46 ÷11.75 = 3.91%
*Averages cannot be computed from the data provided in the problem.
5
9-5
ATC 9-1
a. Compute the following ratios for 2012 for the companies’ fiscal years:
1. Current ratio
2. Average days to sell inventory (Use average inventory.)
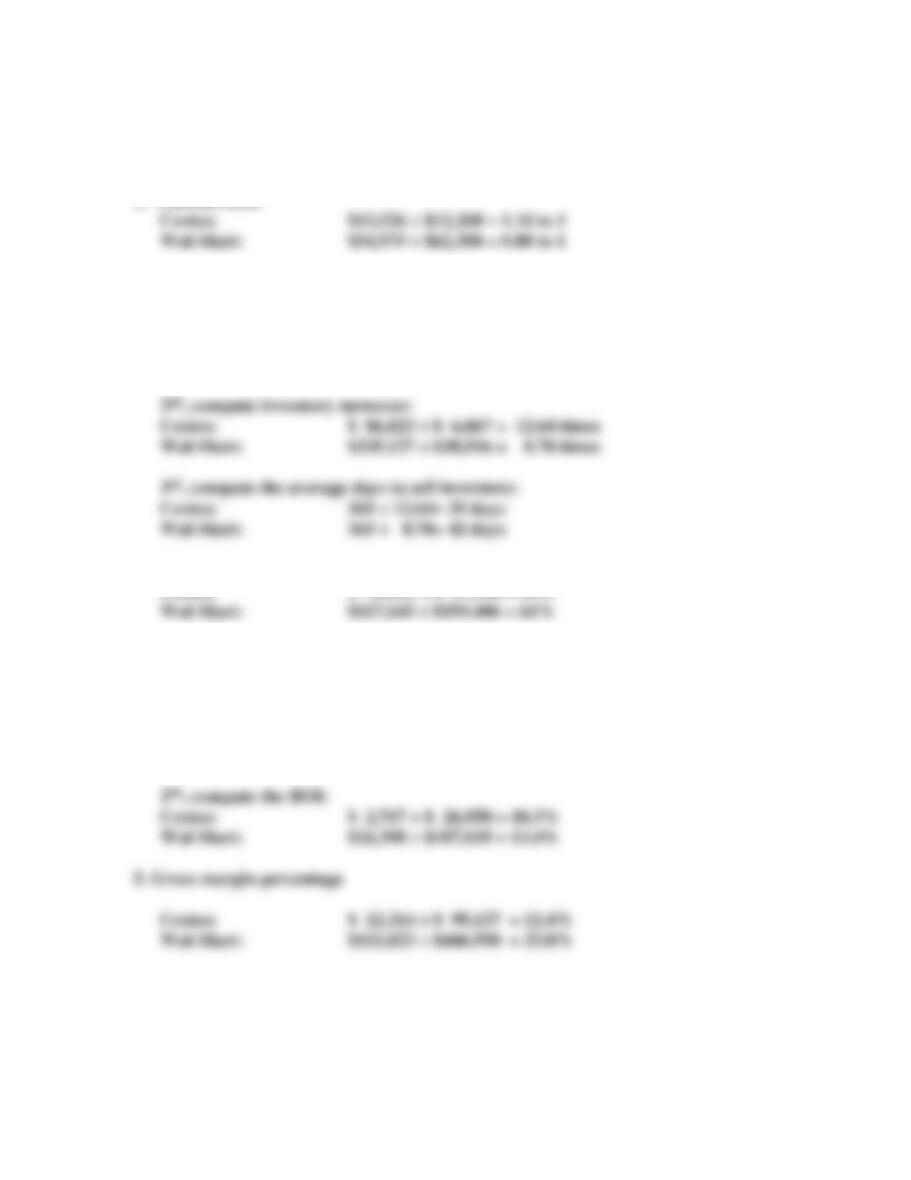
1st, compute average inventory:
Costco: ($ 7,096+ $ 6,638) ÷ 2 = $ 6,867
Wal-Mart: ($40,714+ $36,318) ÷ 2 = $38,516
3. Debt to assets ratio
Costco: $ 14,622 ÷ $ 27,140 = 54%
4. Return on investment (Use average assets and use “earnings from continuing
operations – before taxes” rather than “net earnings.”)
1st, compute average assets: (Also used for ratio 6.)
Costco: ($ 27,140 + $ 26,761) ÷ 2 = $ 26,951
Wal-Mart: ($193,406 + $180,663) ÷ 2 = $187,035
6
9-6
ATC 9-1 (continued)
6. Asset turnover (Use average assets.)
7. Return on sales (Use “earnings from continuing operations–before taxes” rather than
“net earnings.”)
8. Plant assets to long-term debt ratio
Costco: $ 12,961 ÷ $ 2,362 = 5.5 to 1
Wal-Mart: $112,324 ÷ $55,345 = 2.0 to 1
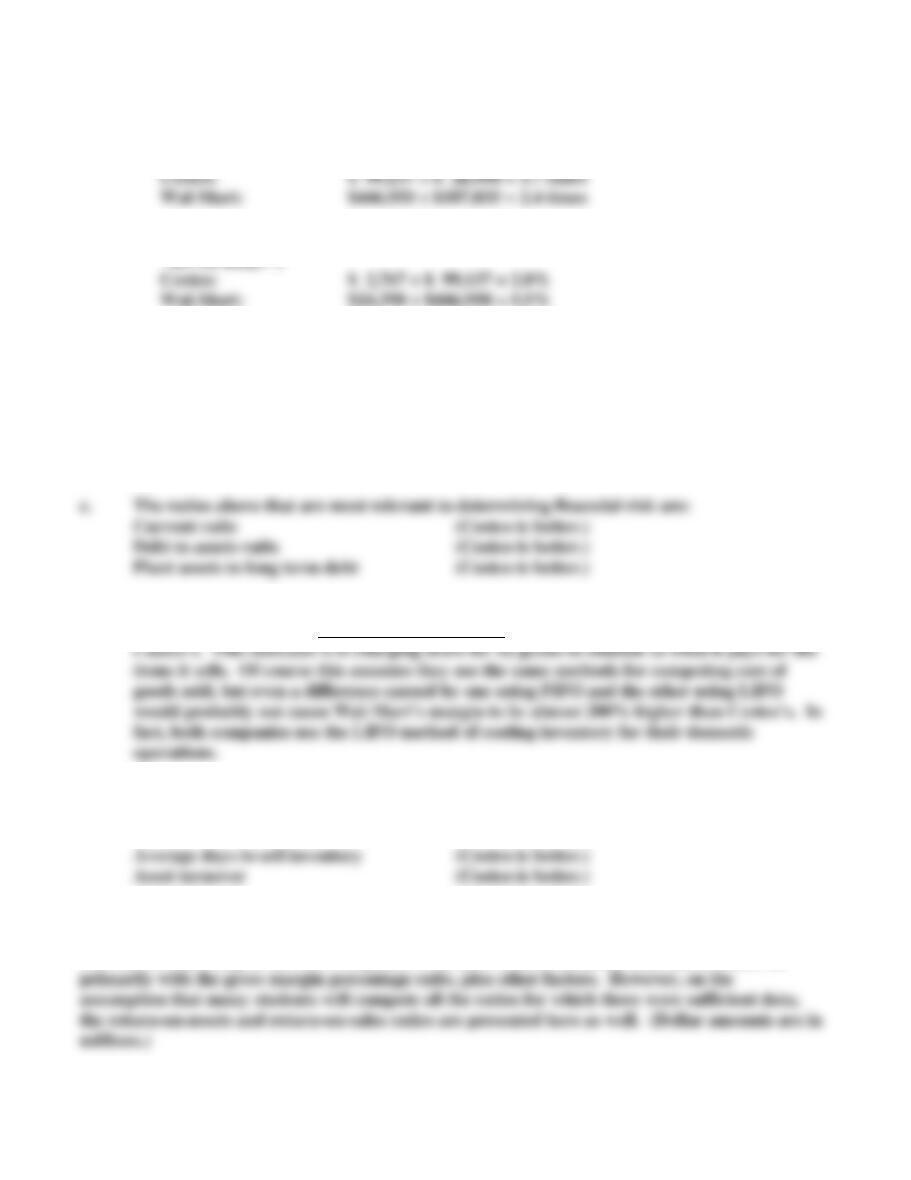
b. The ratios above that are most relevant to determining profitability are:
Return on investment (Wal-Mart is better.)
Return on sales (Wal-Mart is better.)
d. The ratio above that are most relevant to determining which company is charging the
most for its goods is the gross margin percentage. Wal-Mart’s is significantly higher than
e. The ratios above that are most relevant to determining how efficiently assets are being
used are:
ATC 9-2
The correct matching of the four companies with their related financial data can be achieved
7
9-7
A
B
C
D
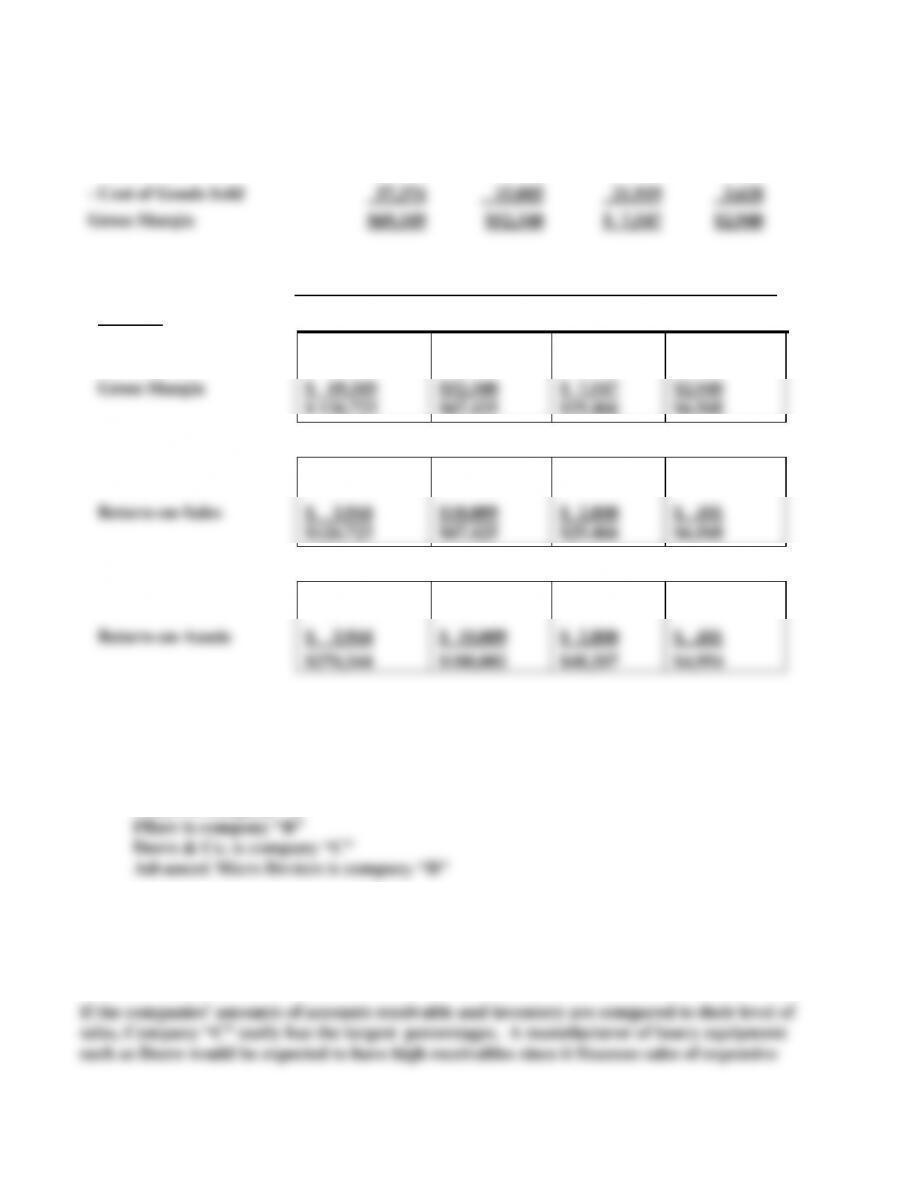
Sales
$126,723
$67,425
$29,466
$6,568
– Cost of Goods Sold
57,374
15,085
21,919
3,628
Gross Margin
$69,349
$52,340
$ 7,547
$2,940
Company
RATIO:
A
B
C
D
54.7% =
77.6% =
25.6% =
44.8% =
Gross Margin
$ 69,349
$52,340
$ 7,547
$2,940
$ 126,723
$67,425
$29,466
$6,568
3.1% =
14.8% =
9.5% =
7.5% =
Return-on-Sales
$ 3,944
$10,009
$ 2,800
$ 491
$126,723
$67,425
$29,466
$6,568
1.5% =
5.3% =
5.8% =
9.9% =
Return-on-Assets
$ 3,944
$ 10,009
$ 2,800
$ 491
$270,344
$188,002
$48,207
$4,954
ATC 9-2 (continued)
The four companies relate to the financial information as follows:
AT&T is company “A”
Rationale for matching companies with financial information:
Only company “A” reports -0- inventory. Of the four choices, a telecommunications company is
the most likely to carry little or no inventory. Therefore, AT&T is company “A.”
8
9-8
equipment, as well as lots of inventory compared to sales since heavy equipment does not sell as
quickly as drugs or microchips.
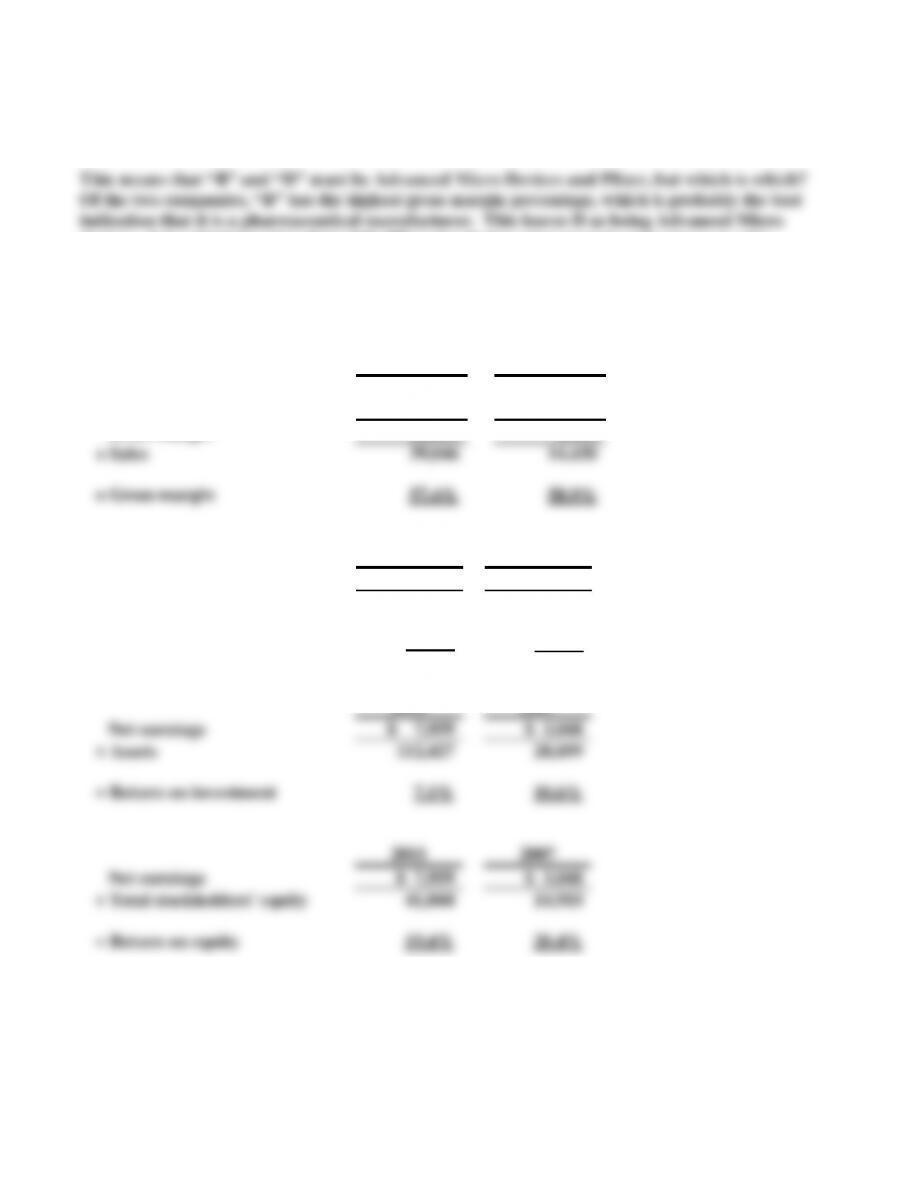
devices. It is a bit interesting that while Pfizer has higher gross margin and return on sales
percentages, Advanced Micro Devices has the better return on assets percentage.
ATC 9-3
a.
2011
2007
Sales
$39,046
$14,430
– Cost of goods sold
16,634
5,936
Gross margin
22,412
8,494
÷ Sales
39,046
14,430
= Gross margin
57.4%
58.9%
2011
2007
Net earnings
$ 7,959
$ 3,048
÷ Sales
39,046
14,430
= Net margin
20.4%
21.1%
2011
2007
Net earnings
$ 7,959
$ 3,048
÷ Assets
112,427
28,699
= Return on investment
7.1%
10.6%
2011
2007
Net earnings
$ 7,959
$ 3,048
÷ Total stockholders’ equity
41,044
14,910
= Return on equity
19.4%
20.4%
9
9-9
ATC 9-3 (continued)
2011
2007
Current assets
$12,323
$5,539
÷ Current liabilities
19,644
6,685
= Current ratio
0.63
0.83
2011
2007
Compute total liabilities:
Total liabilities &
stockholders’ equity
$112,427
$28,699
– Total stockholders’ equity
41,044
14,910
= Total liabilities
$71,383
$13,789
Total liabilities
$ 71,383
$13,789
÷ Total assets
112,427
28,699
= Debt to assets ratio
0.63
0.48
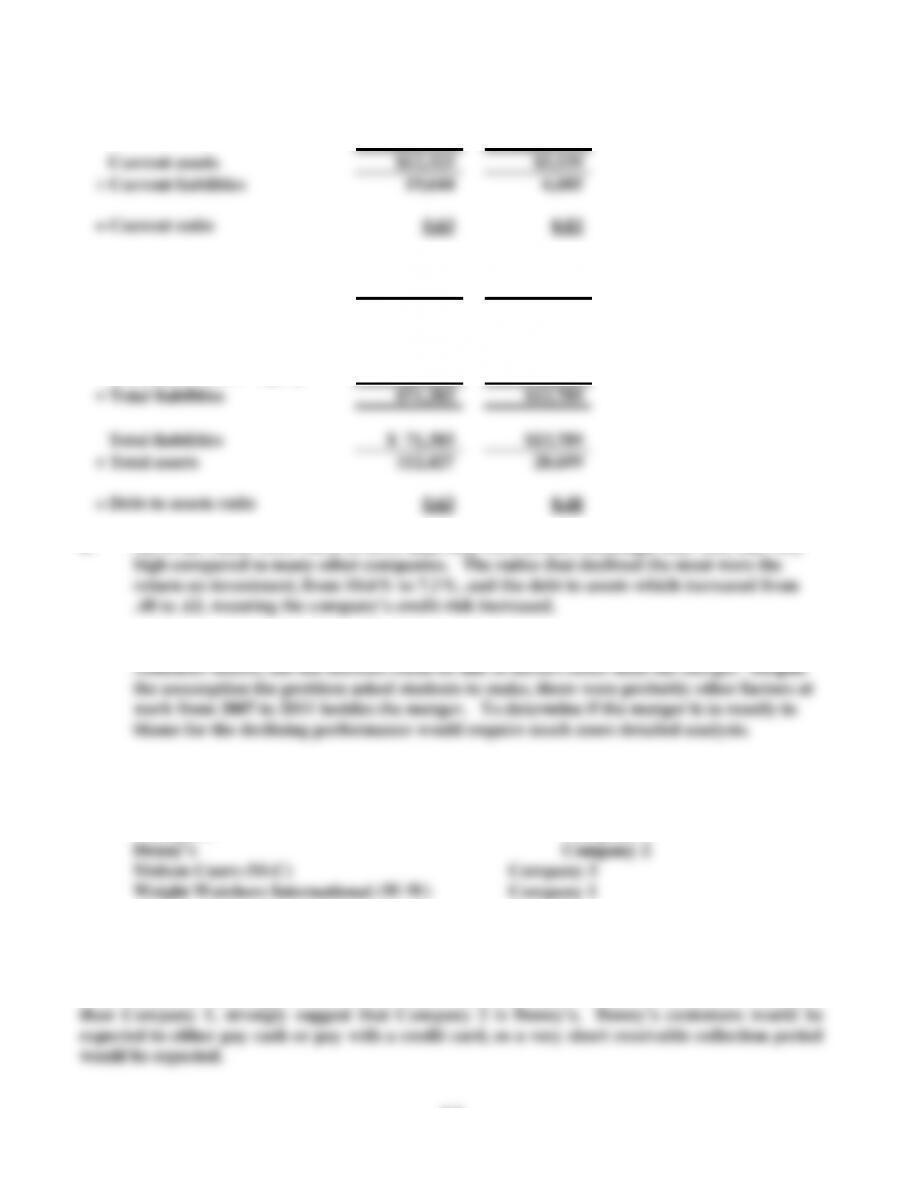
b. All of the ratios were worse in 2011 than they were in 2007, although they were still very
c. InBev’s performance has obviously declined during the three years since it merged with
ATC 9-4
The companies and the set of ratios to which each relates are as follows:
Caterpillar Company 4
Students can probably identify Denny’s as being either Company 1 or Company 2 based on the
relatively short time it takes these companies to sell their inventory. Obviously a restaurant would
not want its inventory sitting around very long. The fact that Company 2 takes the shortest time
to sell its inventory, coupled with the fact that it takes less time to collect its accounts receivables
10
9-10
1 and 3, including, “average days to sell inventory,” “sales per employee,” “current assets as a
percentage of total assets, and “asset turnover” ratios. Most students should be able to deduce that
a brewery would have more of its assets tied up in long-term assets and less in current assets than
a service company such as W-W. This should lead them to identify Company 3 as M-C, leaving
Company 1 as W-W.
that the delivery truck drivers are employees of the distributor, not the brewer.
ATC 9-5
a. Writing off the trucks would make the asset base smaller and thereby cause the return on
assets ratio to be higher.
growth in assets and income to be higher.
c. Ms. Talbot may not be a member of the Institute of Management Accountants and
therefore may not be bound by the organization’s ethical standards. However, her action
is unethical whether or not she is a member of the Institute. If she is bound by those ethical
d. Ms. Talbot and Mr. Winston have the pressure of showing their stockholders good
financial results of Kolla Waste Disposal Corporation. Because this year’s performance is
already very bad, Ms. Talbot is thinking about charging more of future expenses to the
9-11