9-1
Answers to Questions
1. Ratios and trends are useful tools for analyzing financial statements because they give
the analyst a basis for comparing companies of different sizes and characteristics.
2. “Liquidity” is the short-term ability to convert assets to cash or some form useful for
3. Horizontal analysis is a tool for comparing the behavior of items over several periods by
4. This ratio provides information about how rapidly a company is selling its inventory.
Inventory turnover is generally calculated as:
Costs of Goods Sold
5. The current ratio presents the number of dollars of current assets to each dollar of
6. Absolute amounts are often insufficient because companies are of different sizes, thus
7. ROI is a measure of income as a percentage of the total capital employed by the
8. a) Debt to equity ratio: Total Liabilities
—————————————-—–
Total Stockholders’ Equity
9-2
9. Because earnings per share is a combination of “net income” and “average shares
outstanding,” problems in either part affect the outcome. Net income contains many
10. ROI: Net Income
———————
Total Assets
This is the simplest manner of calculating ROI, but many companies and analysts
return on normal operations.
11. Information overload refers to a situation where users of information are overwhelmed
with facts to the point that the desired information is obscured.
12. Price-earnings ratio = Market Price per Share
––––––––––––––––––––––––
Earnings per Share
The PE ratio is a measure of the market price of a share of stock expressed as a
benefits received by stockholders.
13. Some environmental factors that should be considered are (1) the size of the company;
14. Accounting principles are the major determinants of the methods used to account for
assets, liabilities, expenses, and revenues. In analyzing financial statements, the user
9-3
Exercise 9-1
a.
Hall Corporation
Income Statements
2014
2013
% Change
Sales
$1,000,000
$ 800,000
+25.0
Cost of goods sold
630,000
500,000
+26.0
Gross margin
370,000
300,000
+23.3
Operating expenses
190,000
125,000
+52.0
Income before taxes
180,000
175,000
+2.9
Income taxes
50,000
40,000
+25.0
Net income
$ 130,000
$ 135,000
–3.7
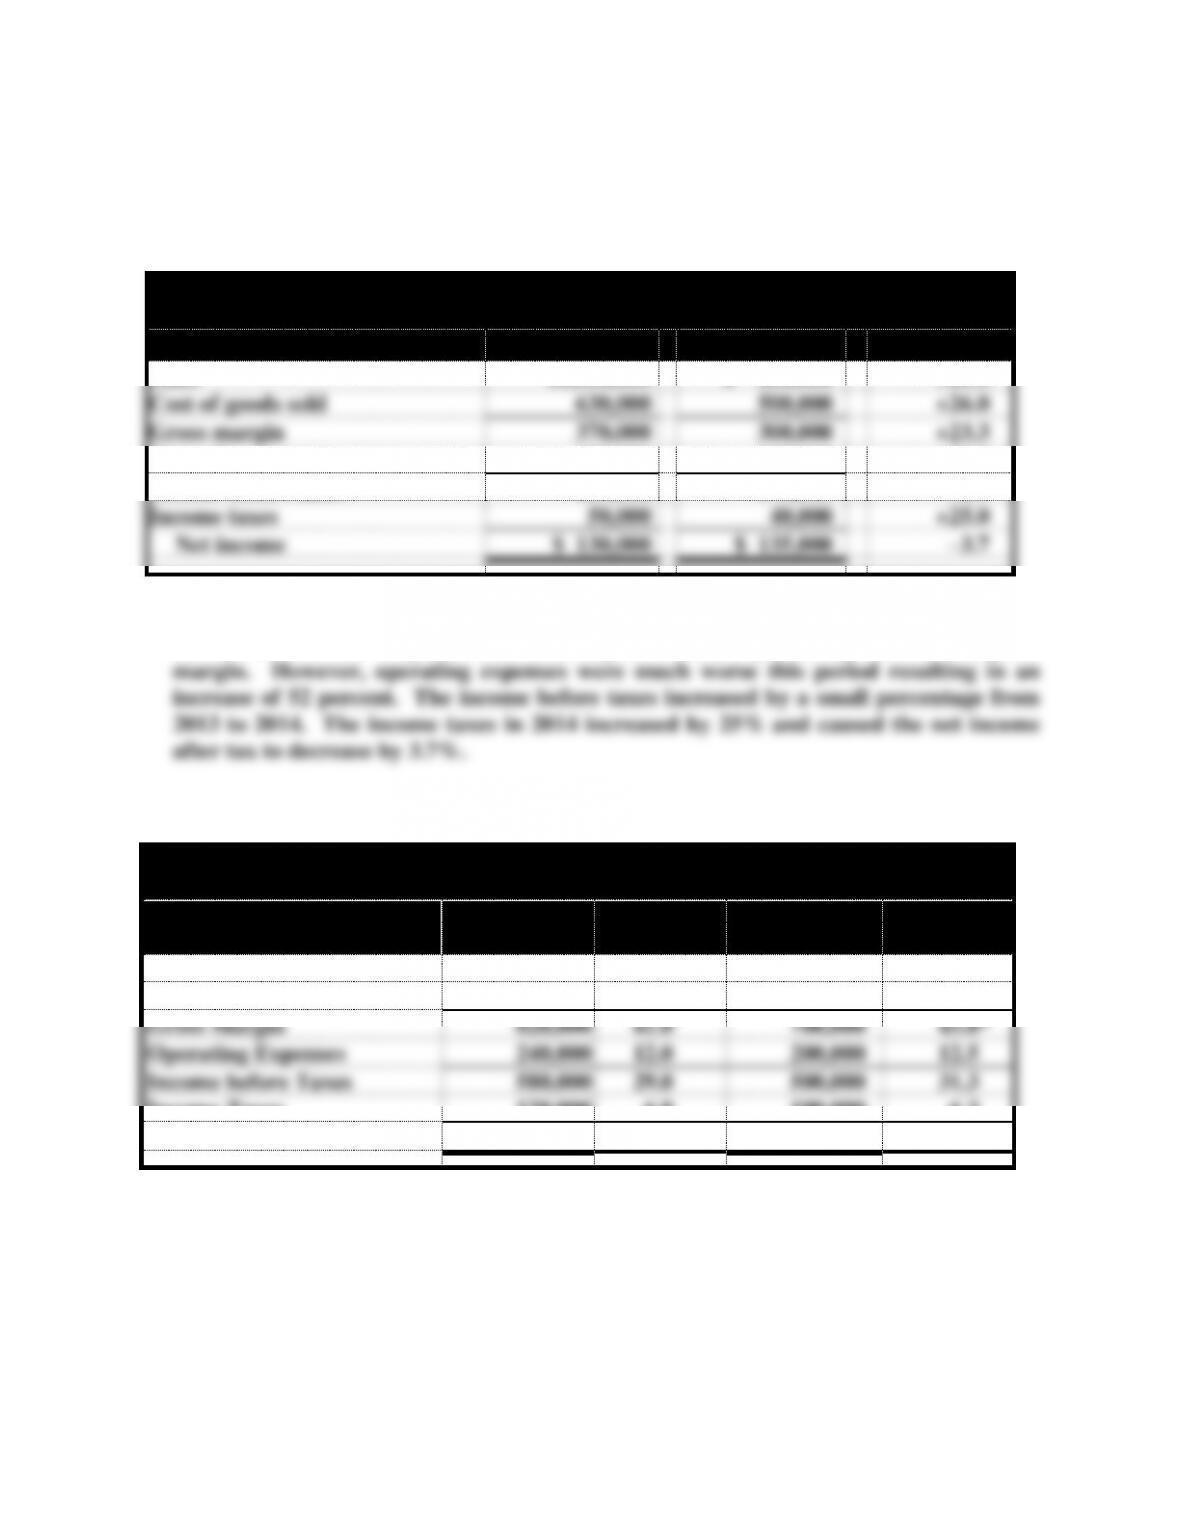
b. The sales of Hall increased by 25 percent for the year with a greater percentage
increase in the cost of goods sold, resulting in a smaller percentage increase in gross
Exercise 9-2
Jordan Company
Vertical Analysis of Income Statements
2015
% of
Sales
2014
% of
Sales
Sales
$2,000,000
100.0%
$1,600,000
100.0%
Cost of Goods Sold
1,180,000
59.0
900,000
56.3
Gross Margin
820,000
41.0
700,000
43.8*
Operating Expenses
240,000
12.0
200,000
12.5
Income before Taxes
580,000
29.0
500,000
31.3
Income Taxes
120,000
6.0
100,000
6.3
Net Income
$ 460,000
23.0
$ 400,000
25.0
*With rounding error
Exercise 9-3
a. Horizontal Analysis
9-4
Gaidar Company
Horizontal Analysis of Income Statements
2015
2014
% Change over 2014
Sales
$300,000
$250,000
+20.0
Cost of Goods Sold
192,000
150,000
+28.0
Selling Expenses
30,000
24,000
+25.0
Administrative Expenses
15,000
20,000
– 25.0
Interest Expense
6,000
8,000
– 25.0
Total Expenses
243,000
202,000
+20.3
Income before Taxes
57,000
48,000
+18.8
Income Taxes
14,000
12,000
+16.7
Net Income
$ 43,000
$ 36,000
+ 19.4
b. Vertical Analysis
Gaidar Company
Vertical Analysis of Income Statements
2015
% of Sales
2014
% of Sales
Sales
$300,000
100.0
$250,000
100.0
Cost of Goods Sold
192,000
64.0
150,000
60.0
Selling Expenses
30,000
10.0
24,000
9.6
Administrative Expenses
15,000
5.0
20,000
8.0
Interest Expense
6,000
2.0
8,000
3.2
Total Expenses
243,000
81.0
202,000
80.8
Income before Taxes
57,000
19.0
48,000
19.2
Income Taxes
14,000
4.7
12,000
4.8
Net Income
$ 43,000
14.3
$ 36,000
14.4
Exercise 9-4
Exercise 9-5
When an account is written off, the net realizable value of accounts receivable remains
Exercise 9-6
a. Working capital before the transaction:
Current assets – Current liabilities
= $800,000 – $400,000 = $400,000
b. Current ratio before the transaction:
Current assets Current liabilities = $800,000 $400,000 = 2:1
Exercise 9-7
a. Working capital before the transaction:
$800,000 – $400,000 = $400,000
b. Current ratio before the transaction: $800,000 $400,000 = 2:1
Exercise 9-8
Working capital = Current assets – Current liabilities
= $300,000 – $200,000 = $100,000
Debt to assets ratio = Total liabilities ÷ Total assets
= $800,000 ÷ $1,250,000 = 64.0%
9-6
Exercise 9-9
a. Current assets = $432,000 – $294,000 = $138,000
$92,000 – $25,000 = $67,000.
b. Solved by simultaneous equations based on known information.
Liabilities: L Stockholders’ Equity: SE Common Stock: CS
L + SE = $432,000
c. Inventory: I Sales: S Cost of goods sold: COGS
Gross margin rate: GMR Gross margin: GM
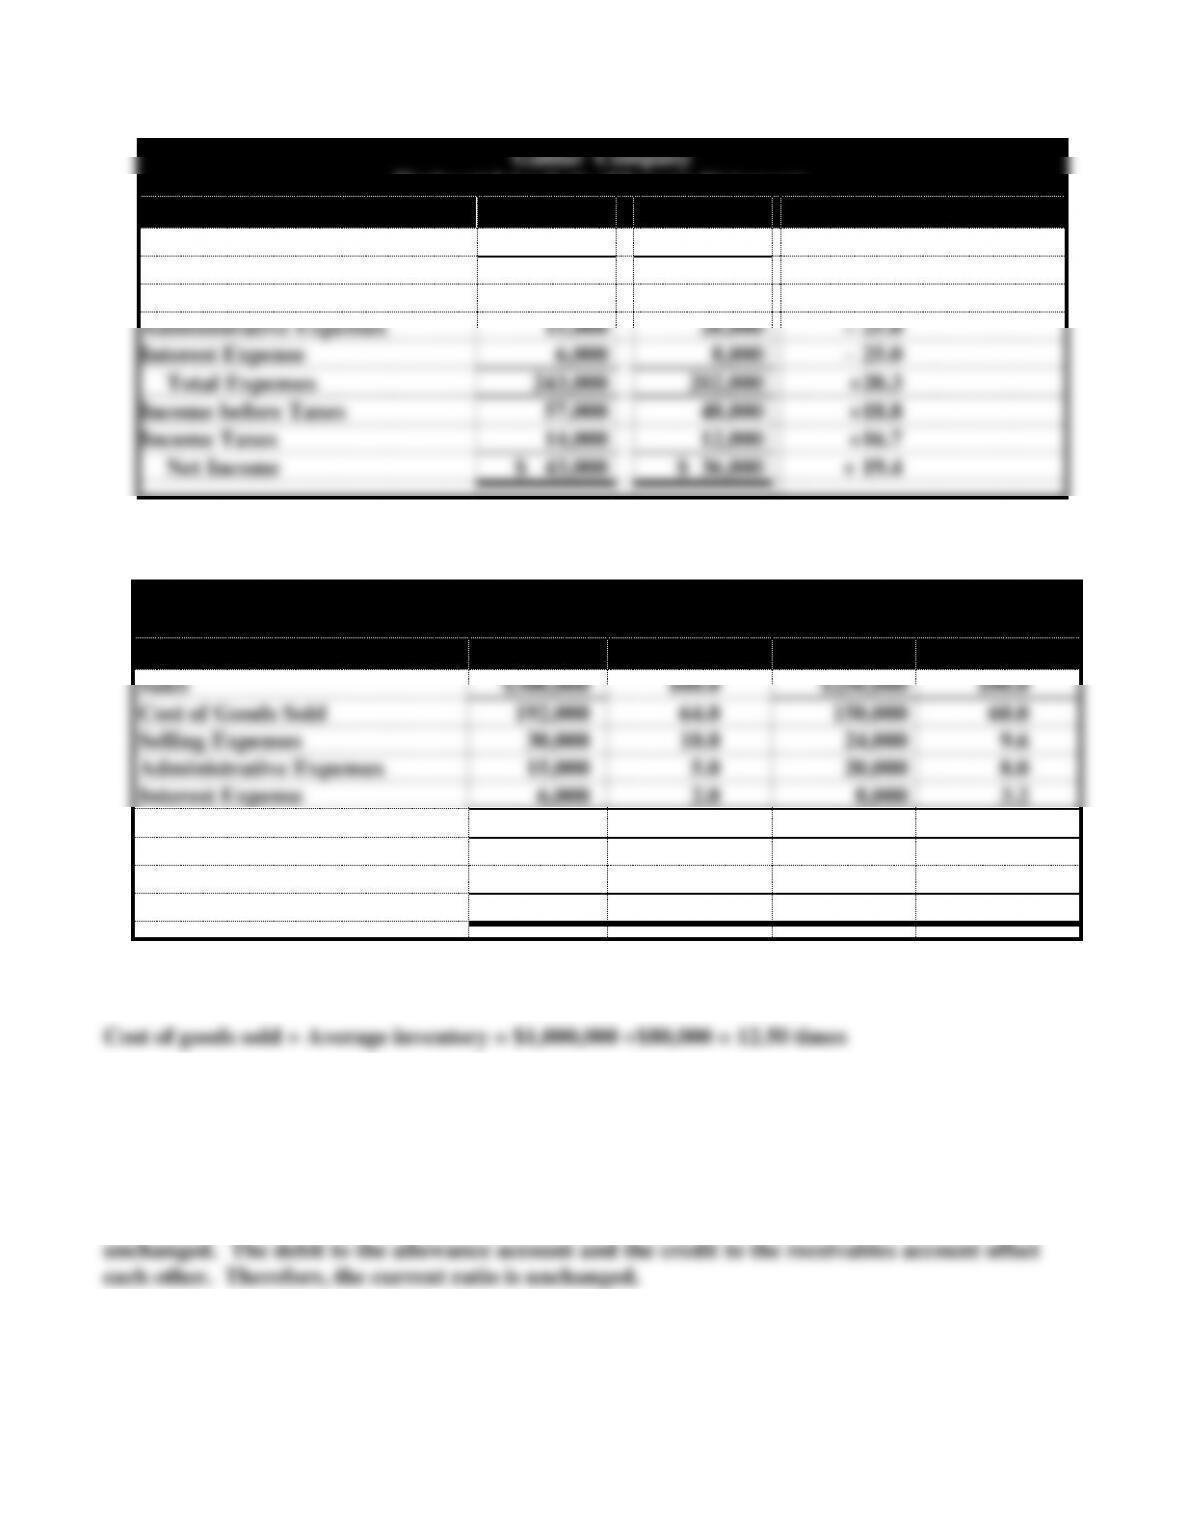
I = COGS ÷ 10.5 = $735,000 ÷ 10.5 = $70,000
Exercise 9-10
Income before interest and taxes:
$42,000 + $12,000 + $6,000 = $60,000.
Exercise 9-11
a. Net credit sales Average net receivables =
$2,000,000 $457,000 = 4.38 Times
9-7
Exercise 9-12
a. Earnings per share:
= ($3,890,000 – $90,000) ÷ 400,000 = $9.50
b. Book Value per Share of common stock:
= ($20,000,000 – $1,000,000) ÷ 400,000 = $47.50
c. Price-Earnings ratio:
Common stock price ÷ Earnings per share
= $52.00 ÷ $9.50 = 5.47 times earnings
Exercise 9-13
a. Current ratio: $77,000 ÷ $15,000 = 5.13:1
b. Earnings per share: $20,000 ÷ 880 = $22.73 per share
Exercise 9-14
1. c 7. d
Exercise 9-15
Current
Ratio
Working
Capital
Stockholders’
Equity
Book
Value
Retained
Earnings
a.
NC
NC
NC
NC
NC
b.
NC
NC
NC
NC
NC
c.
+
+
NC
NC
NC
d.
–
NC
NC
NC
NC
e.
–
–
–
–
–
f.
+
+
+*
+
+
9-8
g.
NC
NC
NC
–
–
h.
+
NC
NC
NC
NC
i.
+
+
–**
–
–
+: Increase NC: No change
–: Decrease X: Depends on situation
* The eventual effect will be income on the sale which will increase retained
earnings, thus stockholders’ equity.
** The proceeds will increase cash; the loss will reduce earnings. Total assets will
decrease.
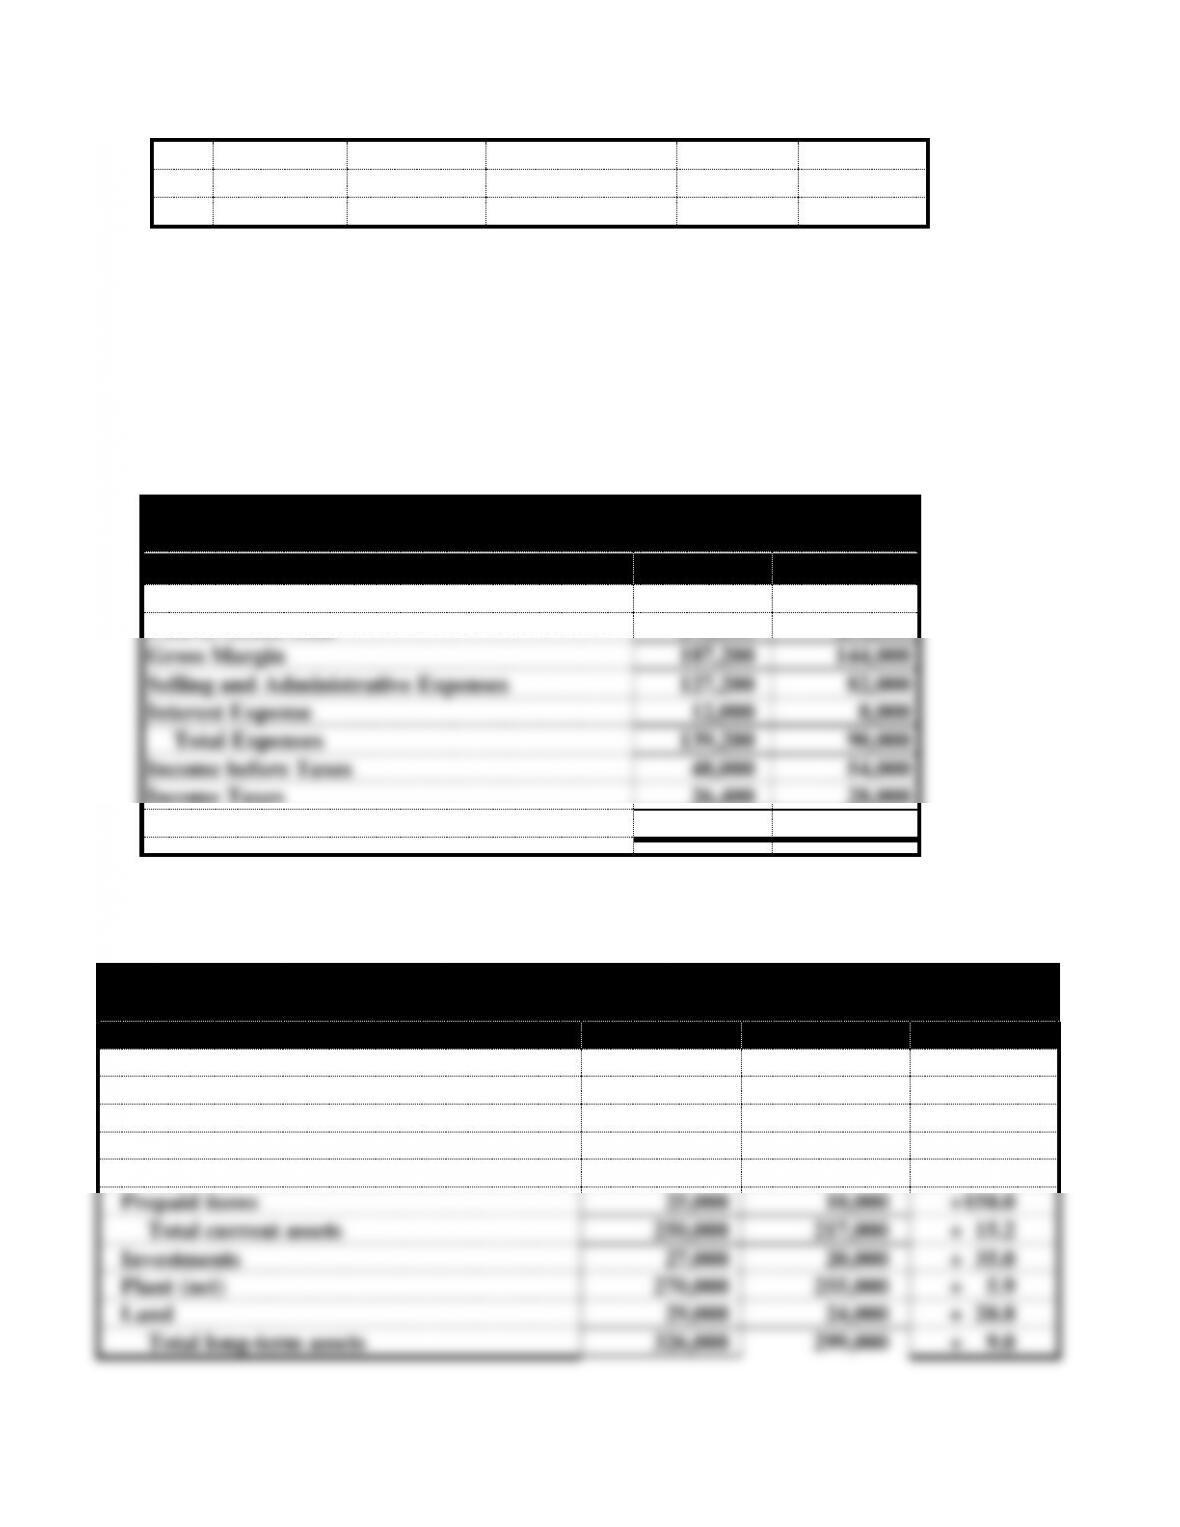
Problem 9-16
Safin Company
Income Statements
2015
2014
Sales
$480,000
$400,000
Cost of Goods Sold
292,800
256,000
Gross Margin
187,200
144,000
Selling and Administrative Expenses
127,200
82,000
Interest Expense
12,000
8,000
Total Expenses
139,200
90,000
Income before Taxes
48,000
54,000
Income Taxes
26,400
28,000
Net Income
$ 21,600
$ 26,000
Problem 9-17
Revnik Company
Horizontal Analysis of Balance Sheets
2015
2014
% Change
Assets
Cash
$ 16,000
$ 12,000
+ 33.3%
Marketable securities
20,000
6,000
+233.3
Accounts receivable (net)
54,000
46,000
+ 17.4
Inventories
135,000
143,000
– 5.6
Prepaid items
25,000
10,000
+150.0
Total current assets
250,000
217,000
+ 15.2
Investments
27,000
20,000
+ 35.0
Plant (net)
270,000
255,000
+ 5.9
Land
29,000
24,000
+ 20.8
Total long-term assets
326,000
299,000
+ 9.0
Total assets
$576,000
$516,000
+ 11.6
Liabilities
Notes payable
$ 17,000
$ 6,000
+183.3
Accounts payable
113,800
100,000
+ 13.8
Salaries payable
21,000
15,000
+ 40.0
Total current liabilities
151,800
121,000
+ 25.5
Bonds payable
100,000
100,000
0.0
Other
32,000
27,000
+ 18.5
Total noncurrent liabilities
132,000
127,000
+ 3.9
Total liabilities
283,800
248,000
+ 14.4
Stockholders’ Equity
Preferred stock
80,000
80,000
0.0
Common stock
80,000
80,000
0.0
Retained earnings
132,200
108,000
+ 22.4
Total stockholders’ equity
292,200
268,000
+ 9.0
Total liabilities & stockholders’ equity
$576,000
$516,000
+ 11.6
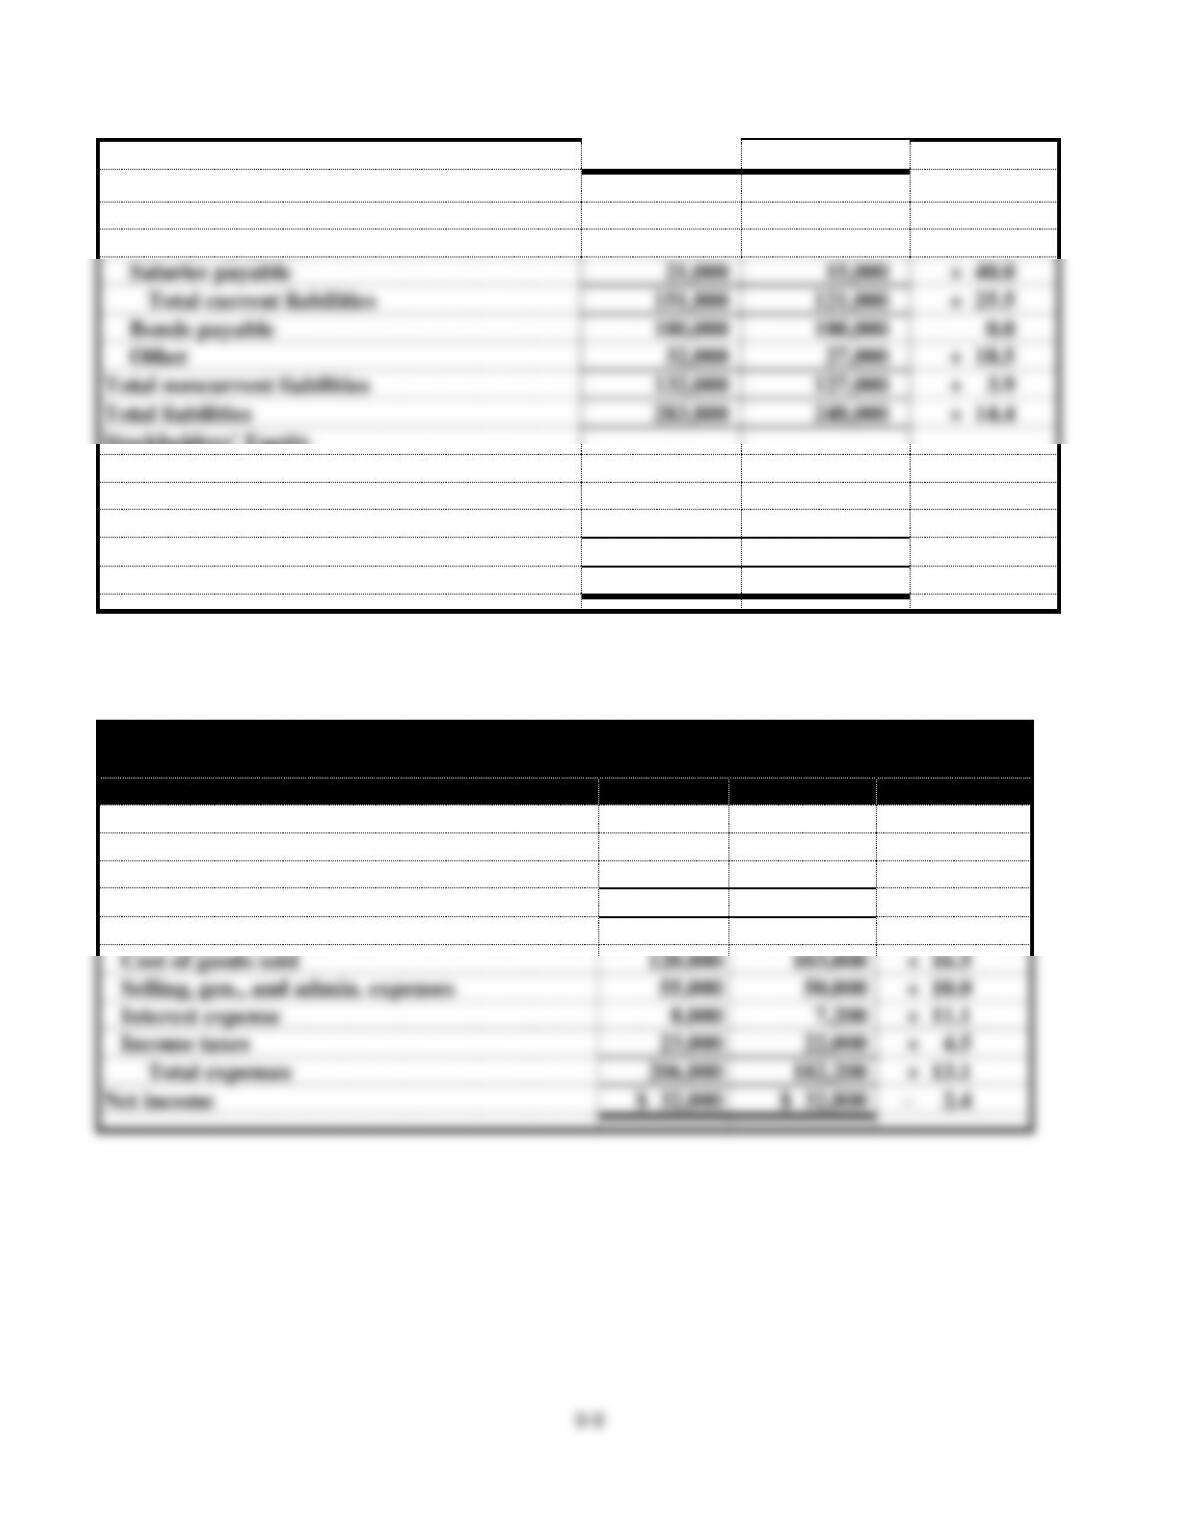
Problem 9-17 (continued)
Revnik Company
Horizontal Analysis of Income Statements
2015
2014
% Change
Revenues
Sales (net)
$230,000
$210,000
+ 9.5%
Other
8,000
5,000
+ 60.0
Total revenues
238,000
215,000
+ 10.7
Expenses
Cost of goods sold
120,000
103,000
+ 16.5
Selling, gen., and admin. expenses
55,000
50,000
+ 10.0
Interest expense
8,000
7,200
+ 11.1
Income taxes
23,000
22,000
+ 4.5
Total expenses
206,000
182,200
+ 13.1
Net income
$ 32,000
$ 32,800
– 2.4
9-10
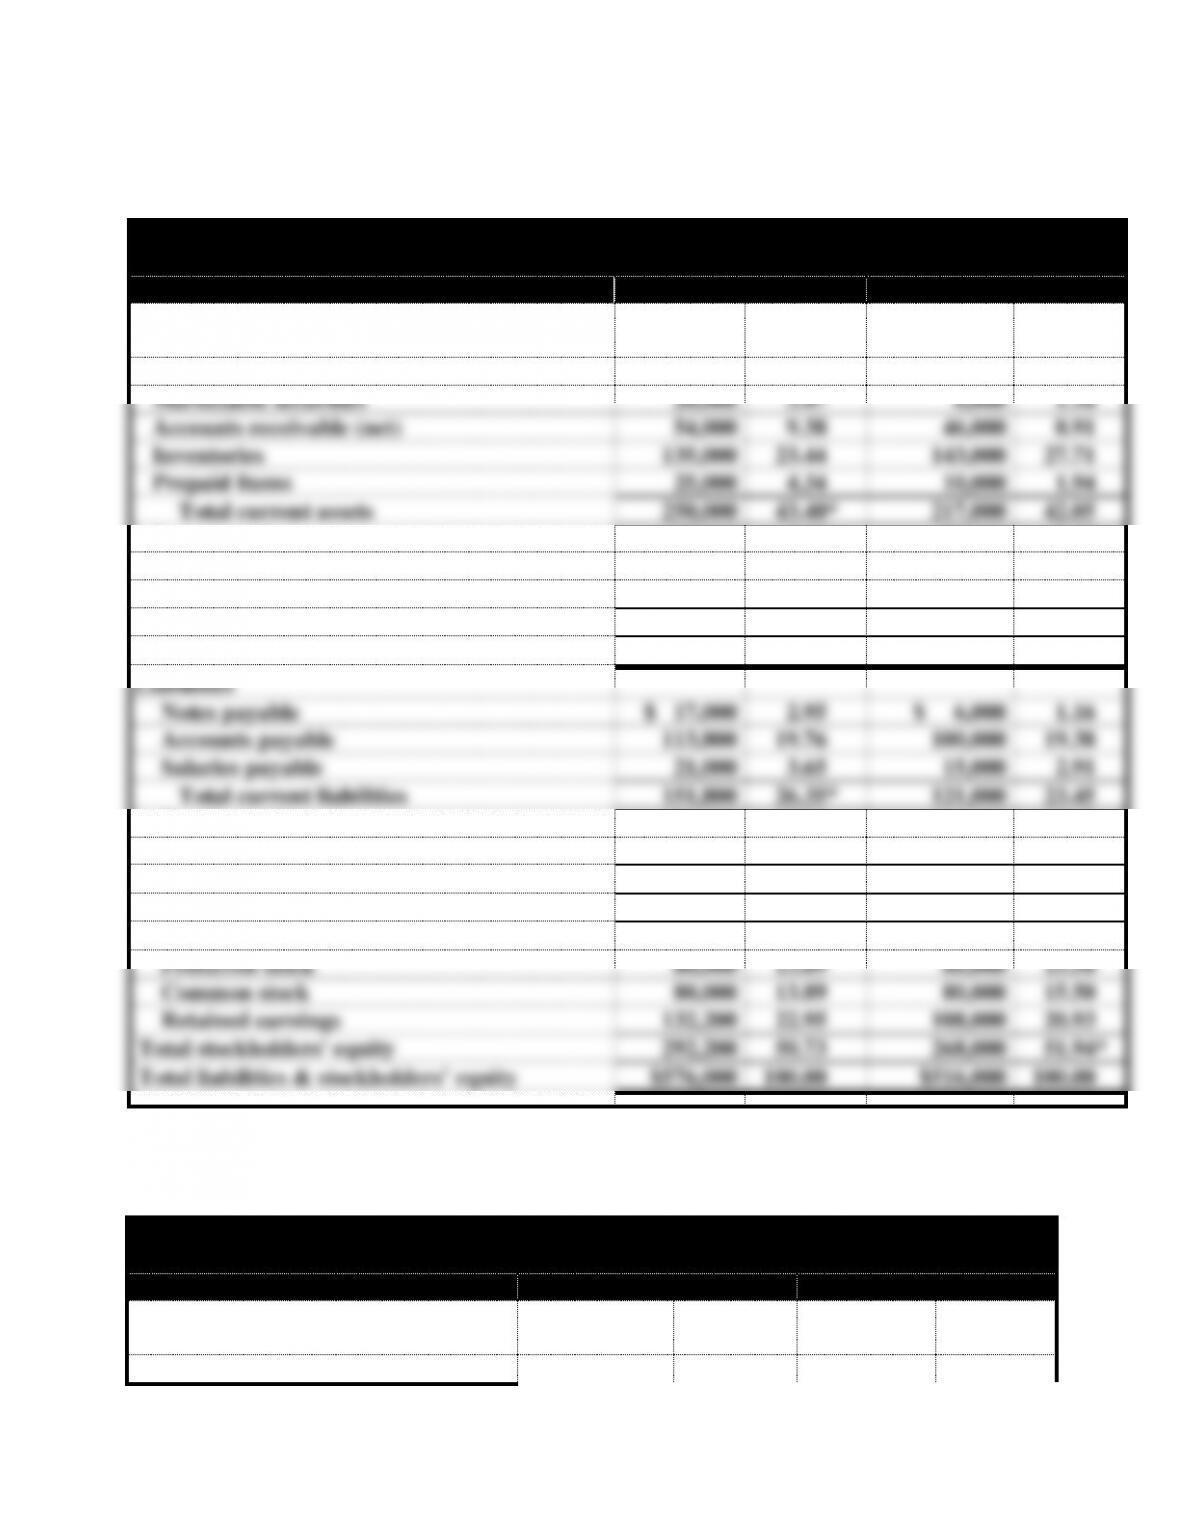
Problem 9-18
Revnik Company
Vertical Analysis of Balance Sheets
2015
2014
Assets
Amount
% of Total
Amount
% of
Total
Cash
$ 16,000
2.78%
$ 12,000
2.33%
Marketable securities
20,000
3.47
6,000
1.16
Accounts receivable (net)
54,000
9.38
46,000
8.91
Inventories
135,000
23.44
143,000
27.71
Prepaid Items
25,000
4.34
10,000
1.94
Total current assets
250,000
43.40*
217,000
42.05
Investments
27,000
4.69
20,000
3.88
Plant (net)
270,000
46.88
255,000
49.42
Land
29,000
5.03
24,000
4.65
Total Long-term assets
326,000
56.60
299,000
57.95
Total Assets
$576,000
100.00
$516,000
100.00
Liabilities
Notes payable
$ 17,000
2.95
$ 6,000
1.16
Accounts payable
113,800
19.76
100,000
19.38
Salaries payable
21,000
3.65
15,000
2.91
Total current liabilities
151,800
26.35*
121,000
23.45
Bonds payable
100,000
17.36
100,000
19.38
Other
32,000
5.56
27,000
5.23
Total noncurrent liabilities
132,000
22.92
127,000
24.61
Total liabilities
283,800
49.27
248,000
48.06
Stockholders’ Equity
Preferred stock
80,000
13.89
80,000
15.50
Common stock
80,000
13.89
80,000
15.50
Retained earnings
132,200
22.95
108,000
20.93
Total stockholders’ equity
292,200
50.73
268,000
51.94*
Total liabilities & stockholders’ equity
$576,000
100.00
$516,000
100.00
*The figure is not equal to the sum of percentages above because of rounding errors.
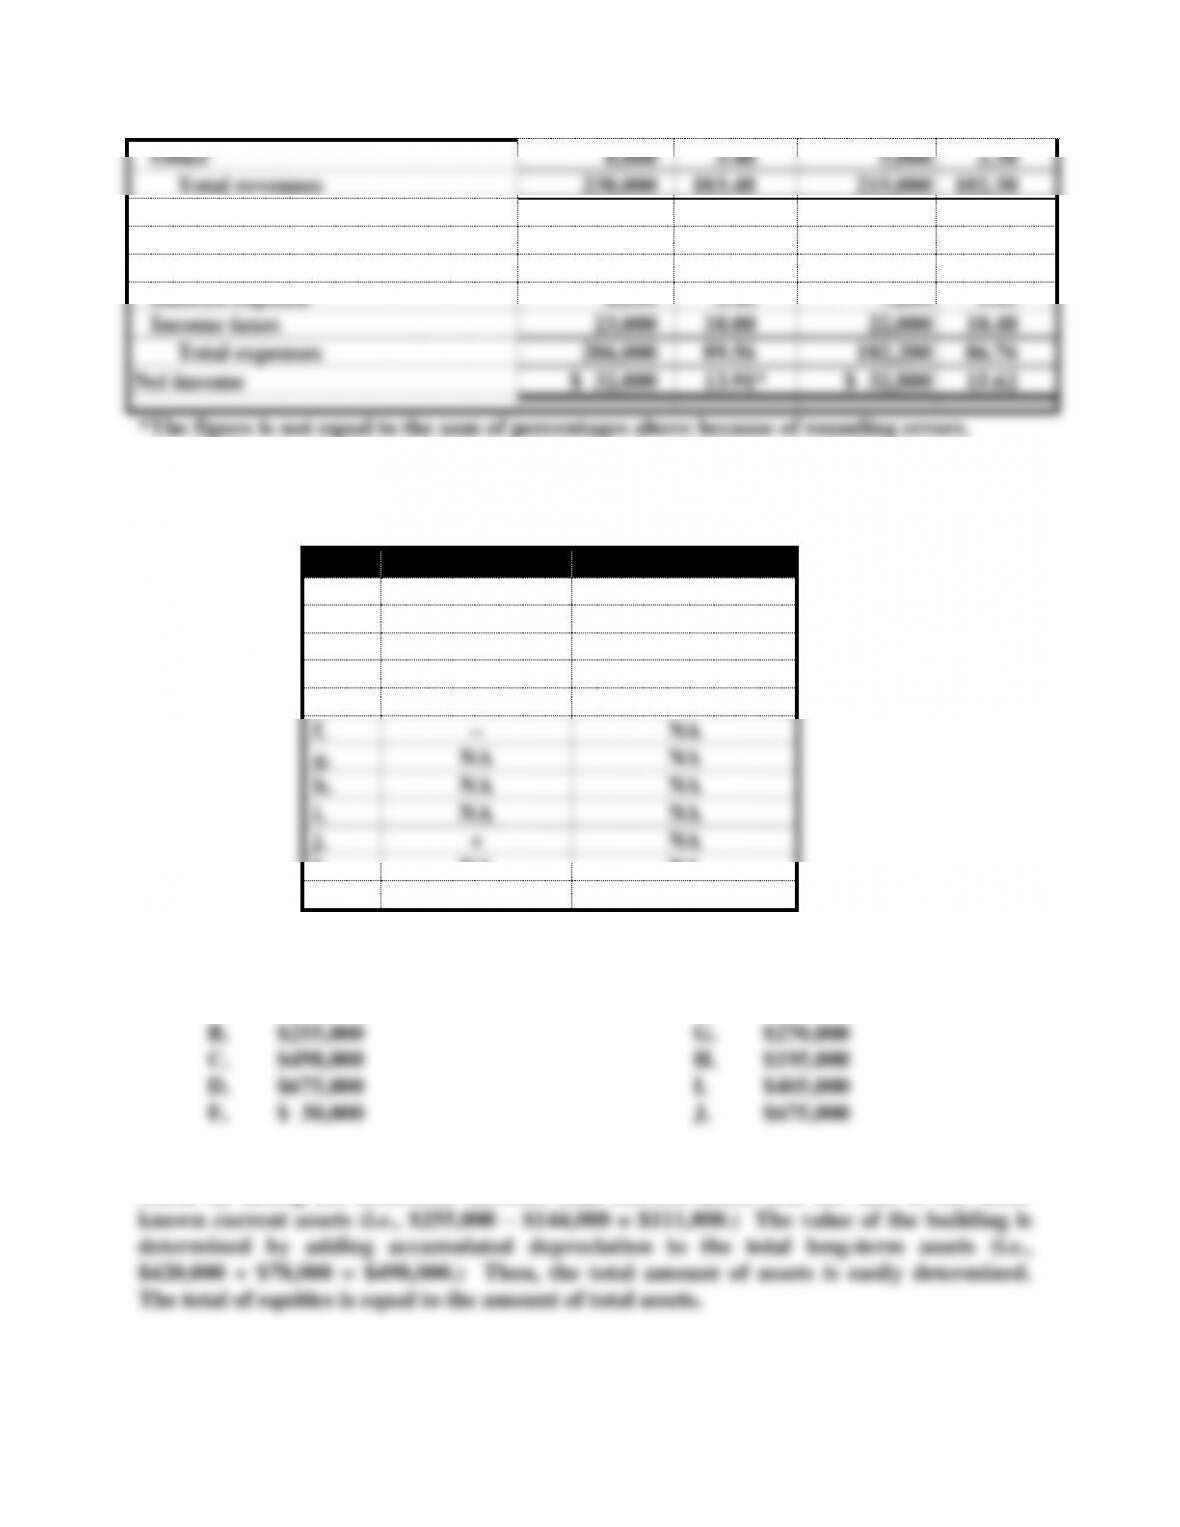
Problem 9-18 (continued)
Revnik Company
Vertical Analysis of Income Statements
2015
2014
Revenues
Amount
% of Total
Amount
% of Total
Sales (net)
$230,000
100.00%
$210,000
100.00%
9-11
Other
8,000
3.48
5,000
2.38
Total revenues
238,000
103.48
215,000
102.38
Expenses
Cost of goods sold
120,000
52.17
103,000
49.05
Selling, gen., and admin. exp.
55,000
23.91
50,000
23.81
Interest expense
8,000
3.48
7,200
3.43
Income taxes
23,000
10.00
22,000
10.48
Total expenses
206,000
89.56
182,200
86.76
Net income
$ 32,000
13.91*
$ 32,800
15.62
*The figure is not equal to the sum of percentages above because of rounding errors.
Problem 9-19
Current Ratio
Working Capital
a.
–
–
b.
NA
NA
c.
+
+
d.
+
+
e.
–
–
f.
–
NA
g.
NA
NA
h.
NA
NA
i.
NA
NA
j.
+
NA
k.
NA
NA
l.
NA
NA
Problem 9-20
A. $111,000 F. $195,000
If working capital is $180,000, current assets must be $255,000. From this, inventory is
found by taking the difference between total current assets and the sum of the other