9-9
Demonstration Problem 9-1 Solution
b. continued
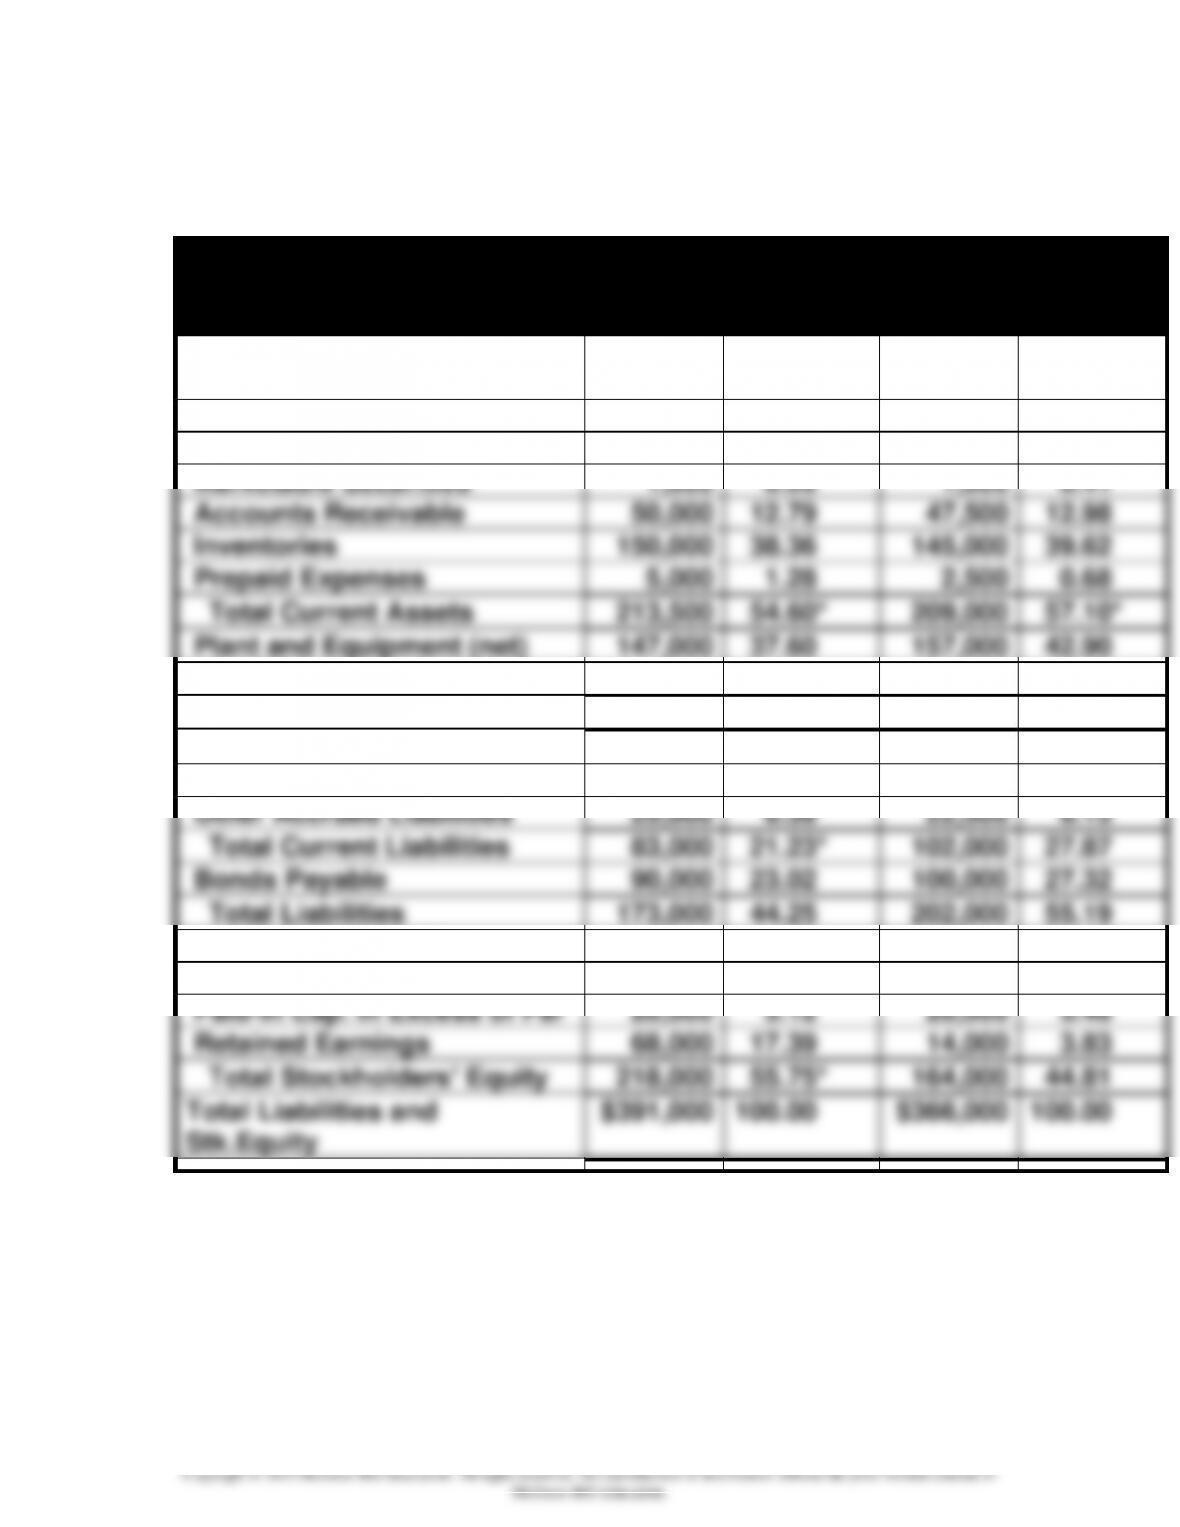
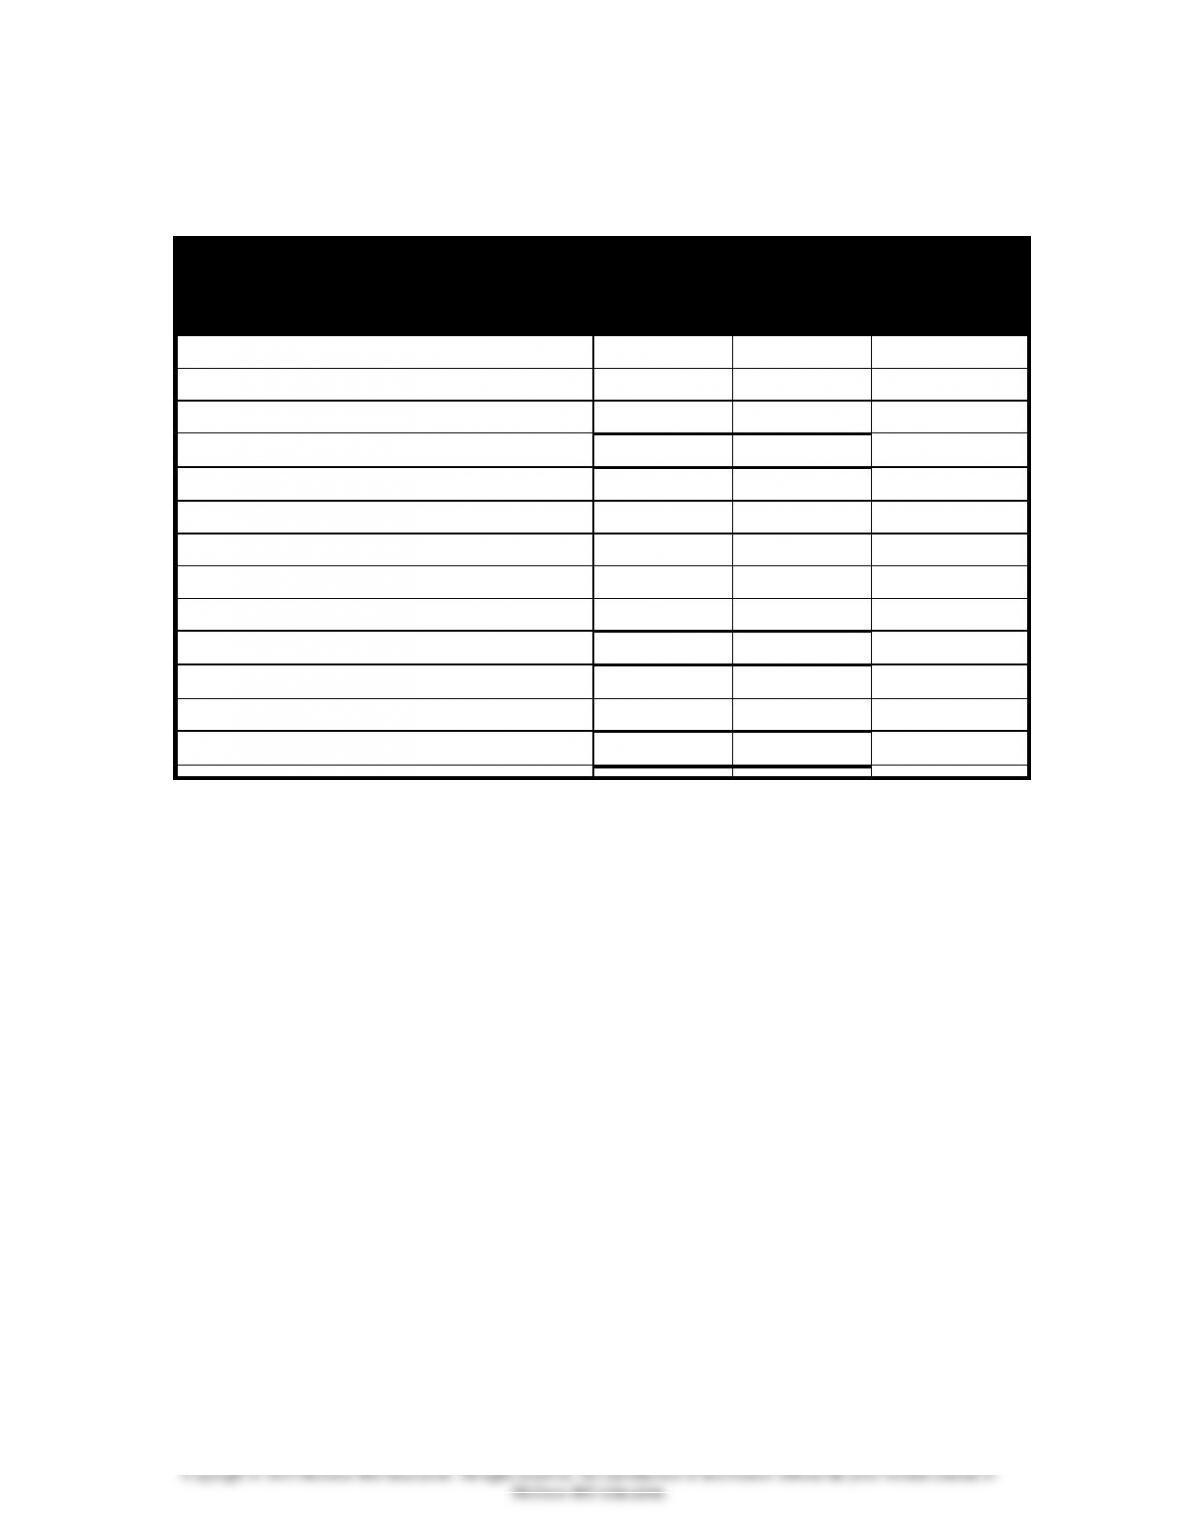
Rosson Company
Vertical Analysis of Balance Sheets
2015
2014
Amount
% of Total
Amount
% of
Total
Assets
Cash
$ 7,500
1.92%
$ 12,500
3.42%
Marketable Securities
1,000
0.26
1,500
0.41
Accounts Receivable
50,000
12.79
47,500
12.98
Inventories
150,000
38.36
145,000
39.62
Prepaid Expenses
5,000
1.28
2,500
0.68
Total Current Assets
213,500
54.60*
209,000
57.10*
Plant and Equipment (net)
147,000
37.60
157,000
42.90
Intangibles
30,500
7.80
0
0.00
Total Assets
$391,000
100.00
$366,000
100.00
Liabilities
Accounts Payable
$ 58,000
14.83
$ 79,500
21.72
Other Accrued Liabilities
25,000
6.39
22,500
6.15
Total Current Liabilities
83,000
21.23*
102,000
27.87
Bonds Payable
90,000
23.02
100,000
27.32
Total Liabilities
173,000
44.25
202,000
55.19
Stockholders’ Equity
Common Stock ($5 par)
130,000
33.25
130,000
35.52
Paid-in Cap. in Excess of Par
20,000
5.12
20,000
5.46
Retained Earnings
68,000
17.39
14,000
3.83
Total Stockholders’ Equity
218,000
55.75*
164,000
44.81
Total Liabilities and
Stk.Equity
$391,000
100.00
$366,000
100.00
*Percentages don’t add up exactly because of rounding.
9-10
Demonstration Problem 9-1 Solution
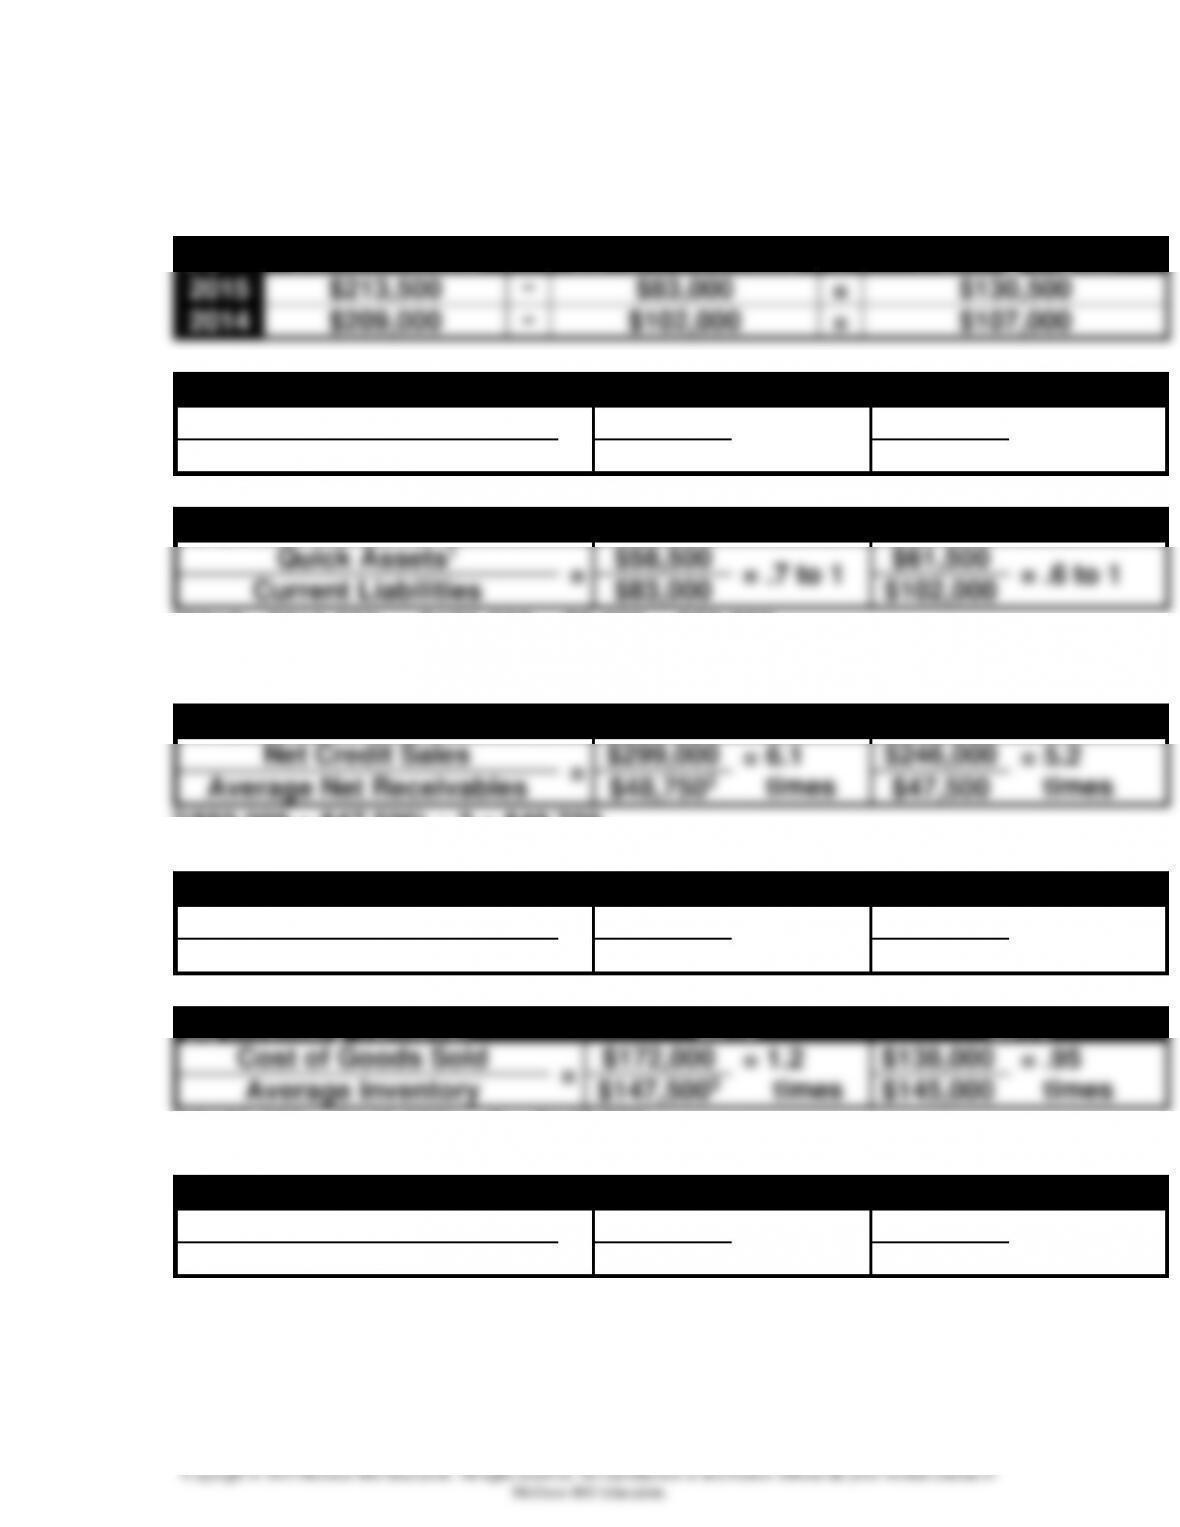
c. Liquidity Ratios
(1)
Current Assets
–
Current Liabilities
=
Working Capital
2015
$213,500
–
$83,000
=
$130,500
2014
$209,000
–
$102,000
=
$107,000
(2) Current Ratio
2015
2014
Current Assets
=
$213,500
= 2.6 to 1
$209,000
= 2.05 to 1
Current Liabilities
$83,000
$102,000
(3) Quick (Acid-test) Ratio
2015
2014
Quick Assets1
=
$58,500
= .7 to 1
$61,500
= .6 to 1
Current Liabilities
$83,000
$102,000
12015: $213,500 – $150,000 – $5,000 = $58,500
2014: $209,000 – $145,000 – $2,500 = $61,500
(4) Accts. Receivable Turnover
2015
2014
Net Credit Sales
=
$299,000
= 6.1
times
$246,000
= 5.2
times
Average Net Receivables
$48,7502
$47,500
2($50,000 + $47,500) ÷ 2 = $48,750
(5)Avg. Days to Collect Receivables
2015
2014
Days in Year
=
365
= 59.8
days
365
= 70.2
days
Accts. Receivable Turnover
6.1 times
5.2 times
(6) Inventory Turnover
2015
2014
Cost of Goods Sold
=
$172,000
= 1.2
times
$138,000
= .95
times
Average Inventory
$147,5003
$145,000
3($150,000 + $145,000) ÷ 2 = $147,500
(7) Avg. Days to Sell Inventory
2015
2014
Days in Year
=
365
= 304.2
days
365
= 384 days
Inventory Turnover
1.2 times
.95 times
9-11
Demonstration Problem 9-1 Solution
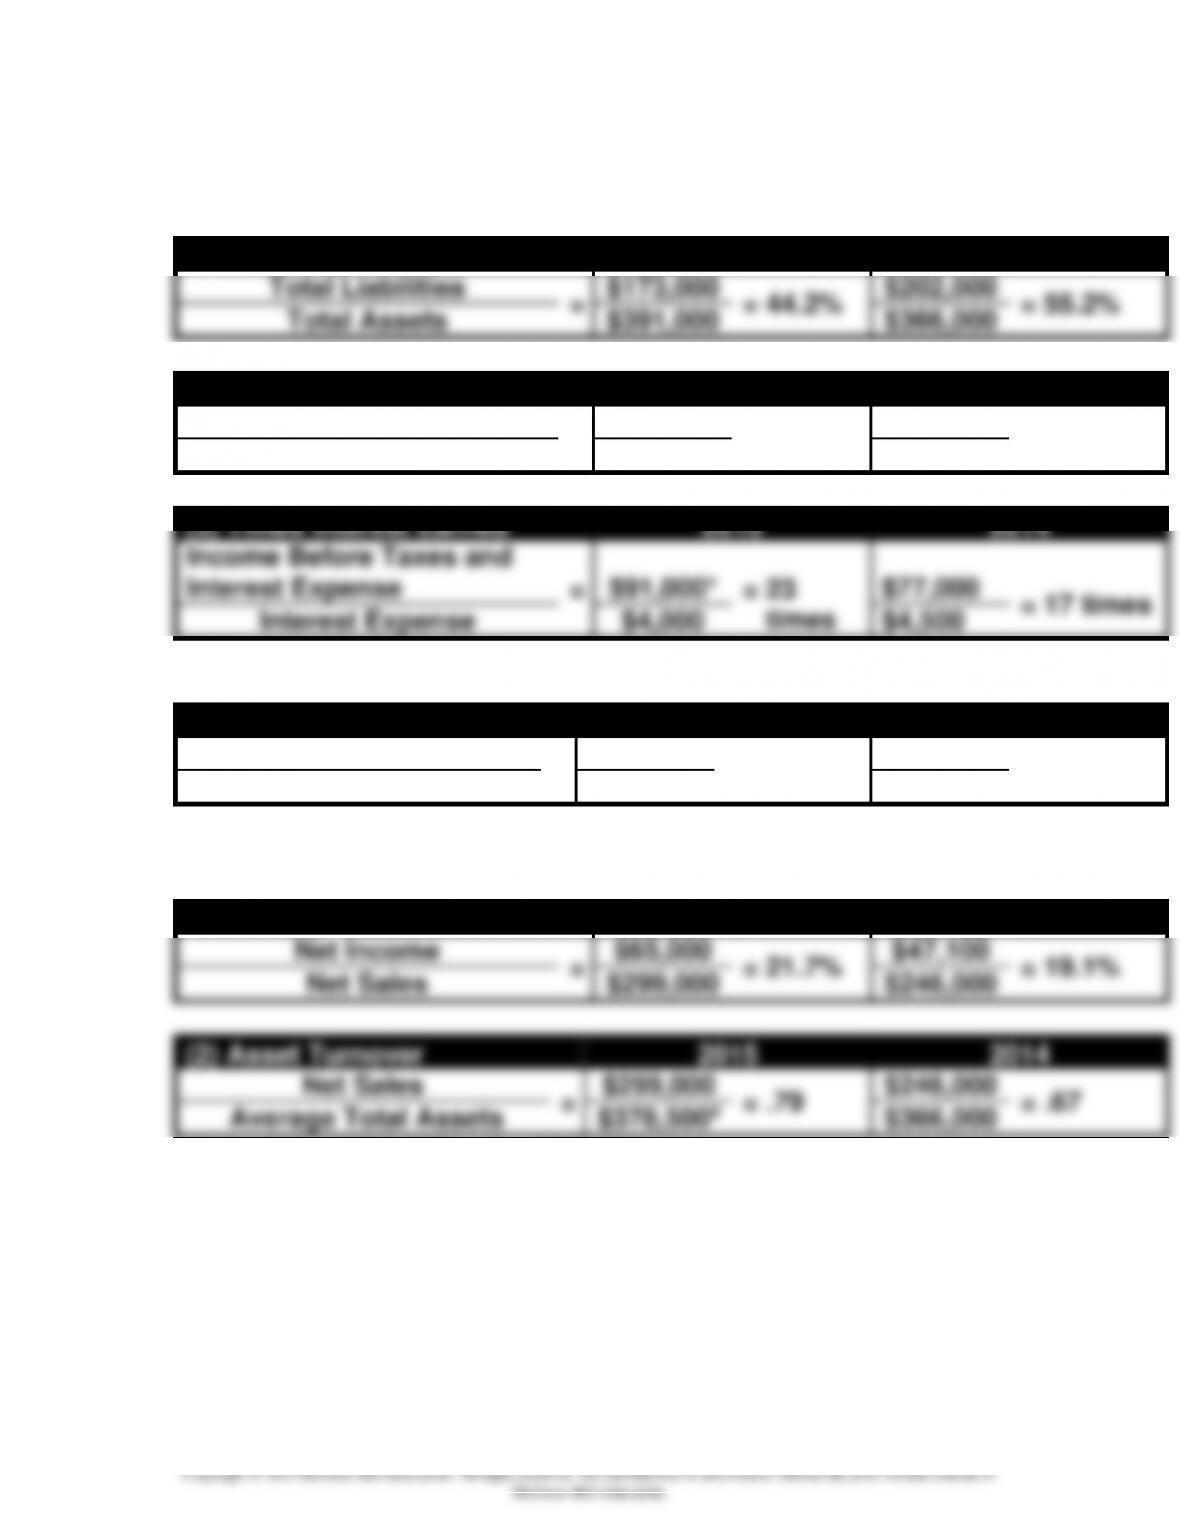
d. Solvency Ratios
(1) Debt to Assets
2015
2014
Total Liabilities
=
$173,000
= 44.2%
$202,000
= 55.2%
Total Assets
$391,000
$366,000
(2) Debt to Equity Ratio
2015
2014
Total Liabilities
=
$173,000
= 79.4%
$202,000
= 123.2%
Total Stockholders’ Equity
$218,000
$164,000
(3) Times Interest Earned
2015
2014
Income Before Taxes and
Interest Expense
=
$91,000*
= 23
times
$77,000
= 17 times
Interest Expense
$4,000
$4,500
*Before extraordinary gain
(4) Plant Assets to LT Liab.
2015
2014
Net Plant Assets
=
$147,000
= 1.63 to 1
$157,000
= 1.57 to 1
Long-term Liabilities
$90,000
$100,000
e. Profitability Ratios
(1) Net Margin
2015
2014
Net Income
=
$65,000
= 21.7%
$47,100
= 19.1%
Net Sales
$299,000
$246,000
(2) Asset Turnover
2015
2014
Net Sales
=
$299,000
= .79
$246,000
= .67
Average Total Assets
$378,5004
$366,000
4($391,000 + $366,000) ÷ 2 = $378,500
9-12
Demonstration Problem 9-1 Solution
e. Profitability Ratios, continued
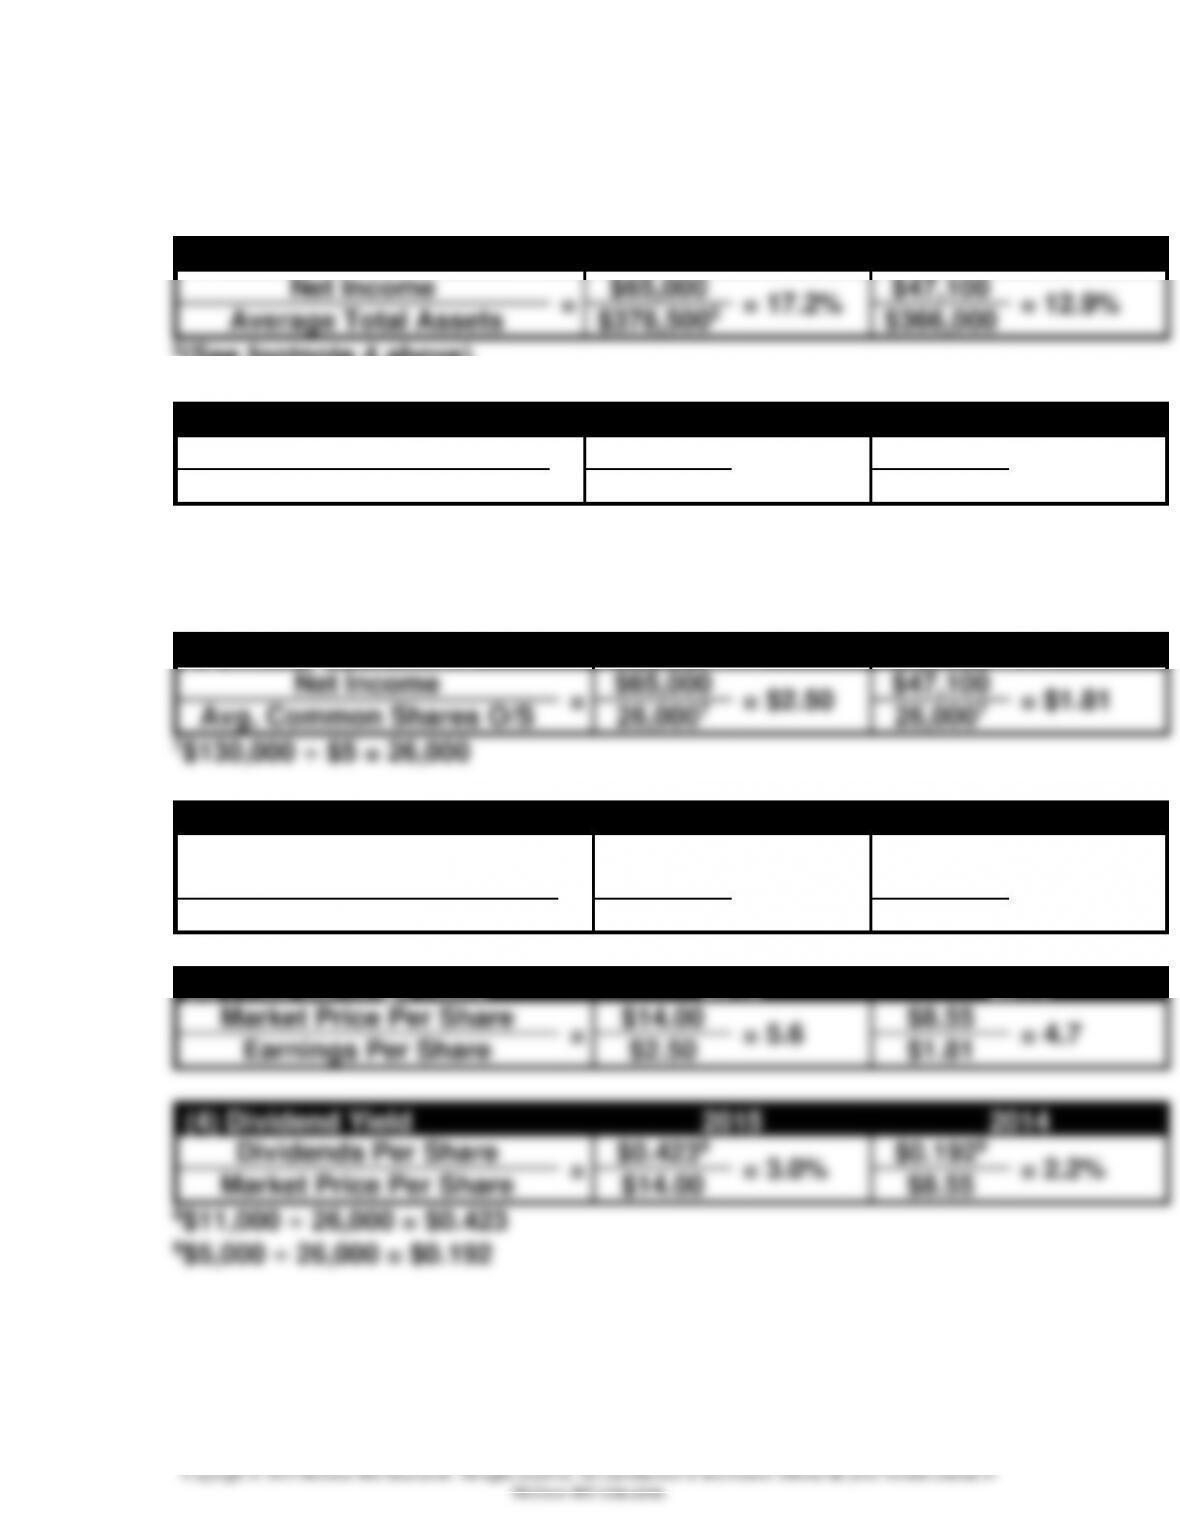
(3) Return on Investment
2015
2014
Net Income
=
$65,000
= 17.2%
$47,100
= 12.9%
Average Total Assets
$378,5005
$366,000
(4) Return on Equity
2015
2014
Net Income
=
$65,000
= 34.0%
$47,100
= 28.7%
Avg. Stockholders’ Equity
$191,0006
$164,000
6($218,000 + $164,000) ÷ 2 = $191,000
f. Stock Market Ratios
(1) Earnings Per Share
2015
2014
Net Income
=
$65,000
= $2.50
$47,100
= $1.81
Avg. Common Shares O/S
26,0007
26,0007
(2) Book Value Per Share
2015
2014
Stockholders’ Equity –
Preferred Rights
=
$218,000
= $8.38
$164,000
= $6.31
Avg. Common Shares O/S
26,000
26,000
(3) Price-earnings Ratio
2015
2014
Market Price Per Share
=
$14.00
= 5.6
$8.55
= 4.7
Earnings Per Share
$2.50
$1.81
(4) Dividend Yield
2015
2014
Dividends Per Share
=
$0.4238
= 3.0%
$0.1929
= 2.2%
Market Price Per Share
$14.00
$8.55
8$11,000 ÷ 26,000 = $0.423
9$5,000 ÷ 26,000 = $0.192
9-13
Demonstration Problem 9-1 Work Papers
a.
Rosson Company
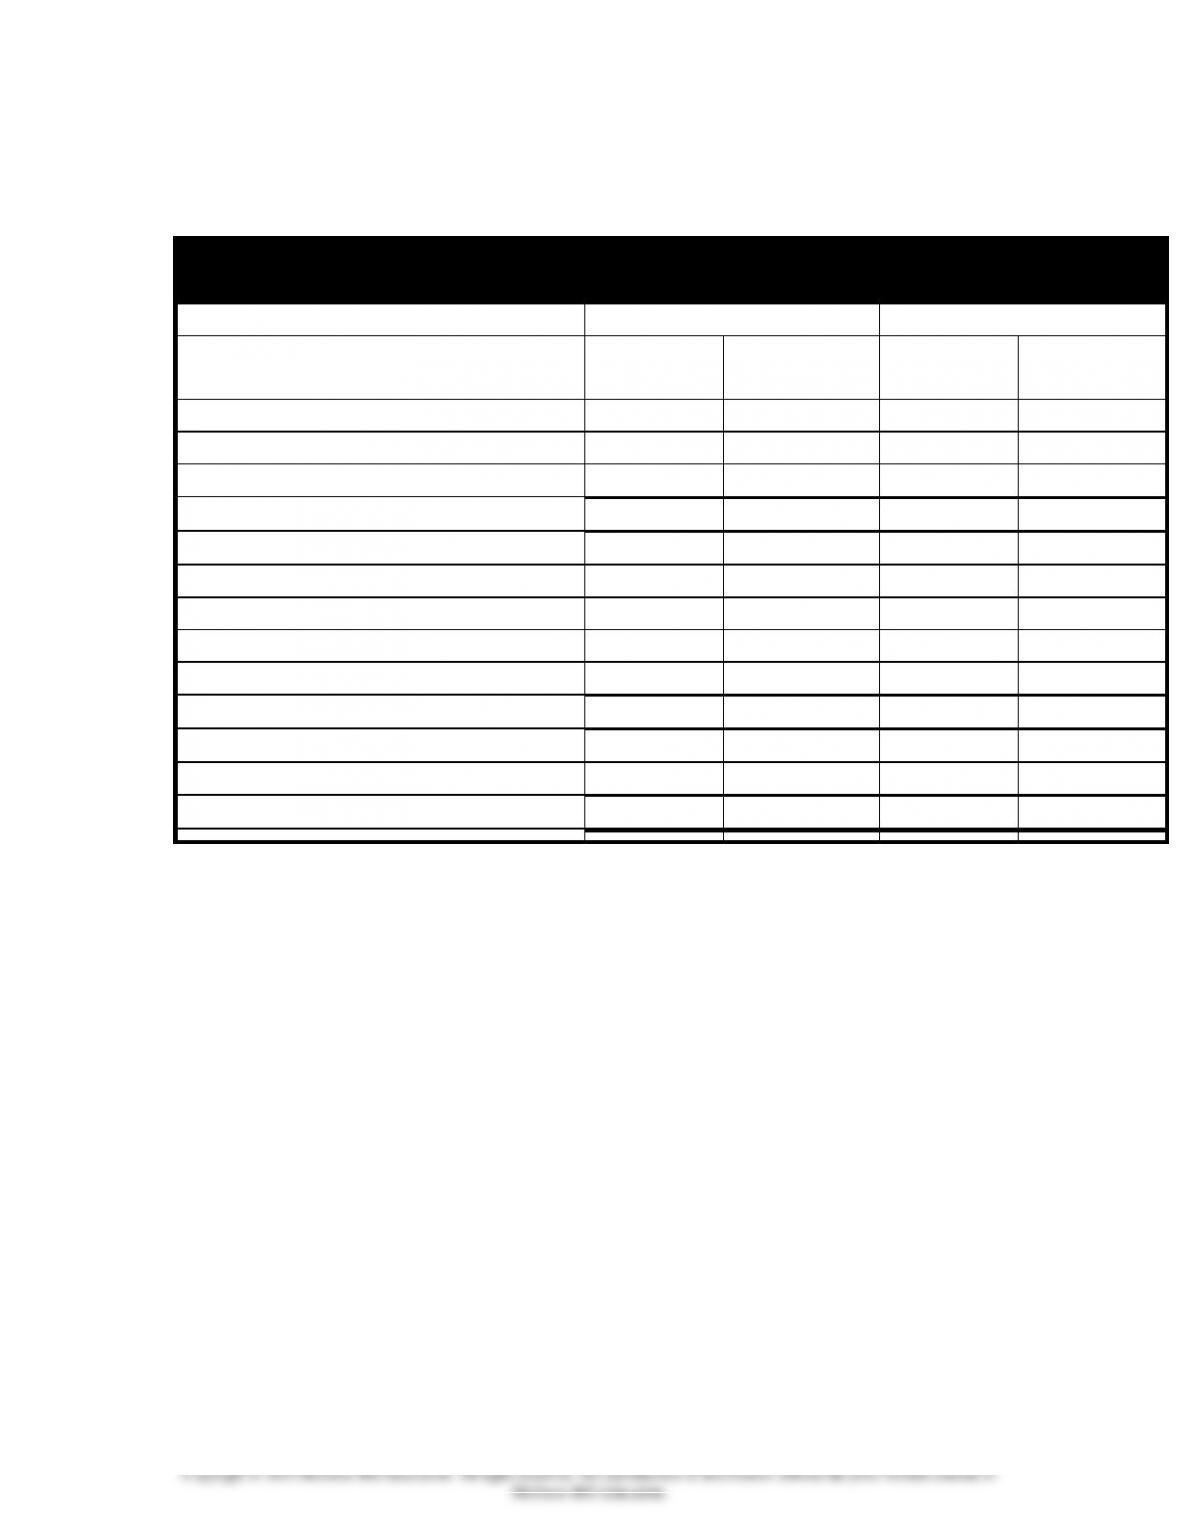
Horizontal Analysis of Income Statements
2015
2014
% Change
Revenues:
Net Sales
$299,000
$246,000
Other Revenues
8,000
9,000
Total Revenues
307,000
255,000
Expenses:
Cost of Goods Sold
172,000
138,000
S,G&A Expenses
44,000
40,000
Interest Expense
4,000
4,500
Income Tax Expense
31,000
25,400
Total Expenses
251,000
207,900
Income Before X/O Items
56,000
47,100
Extraordinary Gain (net of tax)
9,000
0
Net Income
$ 65,000
$ 47,100
9-14
Demonstration Problem 9-1 Work Papers
a. continued
Rosson Company
Horizontal Analysis of Balance Sheets
2015
2014
% Change
Assets
Cash
$ 7,500
$ 12,500
Marketable Securities
1,000
1,500
Accounts Receivable
50,000
47,500
Inventories
150,000
145,000
Prepaid Expenses
5,000
2,500
Total Current Assets
213,500
209,000
Plant and Equipment (net)
147,000
157,000
Intangibles
30,500
0
Total Assets
$391,000
$366,000
Liabilities
Accounts Payable
$ 58,000
$ 79,500
Other Accrued Liabilities
25,000
22,500
Total Current Liabilities
83,000
102,000
Bonds Payable
90,000
100,000
Total Liabilities
173,000
202,000
Stockholders’ Equity
Common Stock ($5 par)
130,000
130,000
Paid-in Cap. in Excess of Par
20,000
20,000
Retained Earnings
68,000
14,000
Total Stockholders’ Equity
218,000
164,000
Total Liabilities and Stk.
Equity
$391,000
$366,000
9-15
Demonstration Problem 9-1 Work Papers
b.
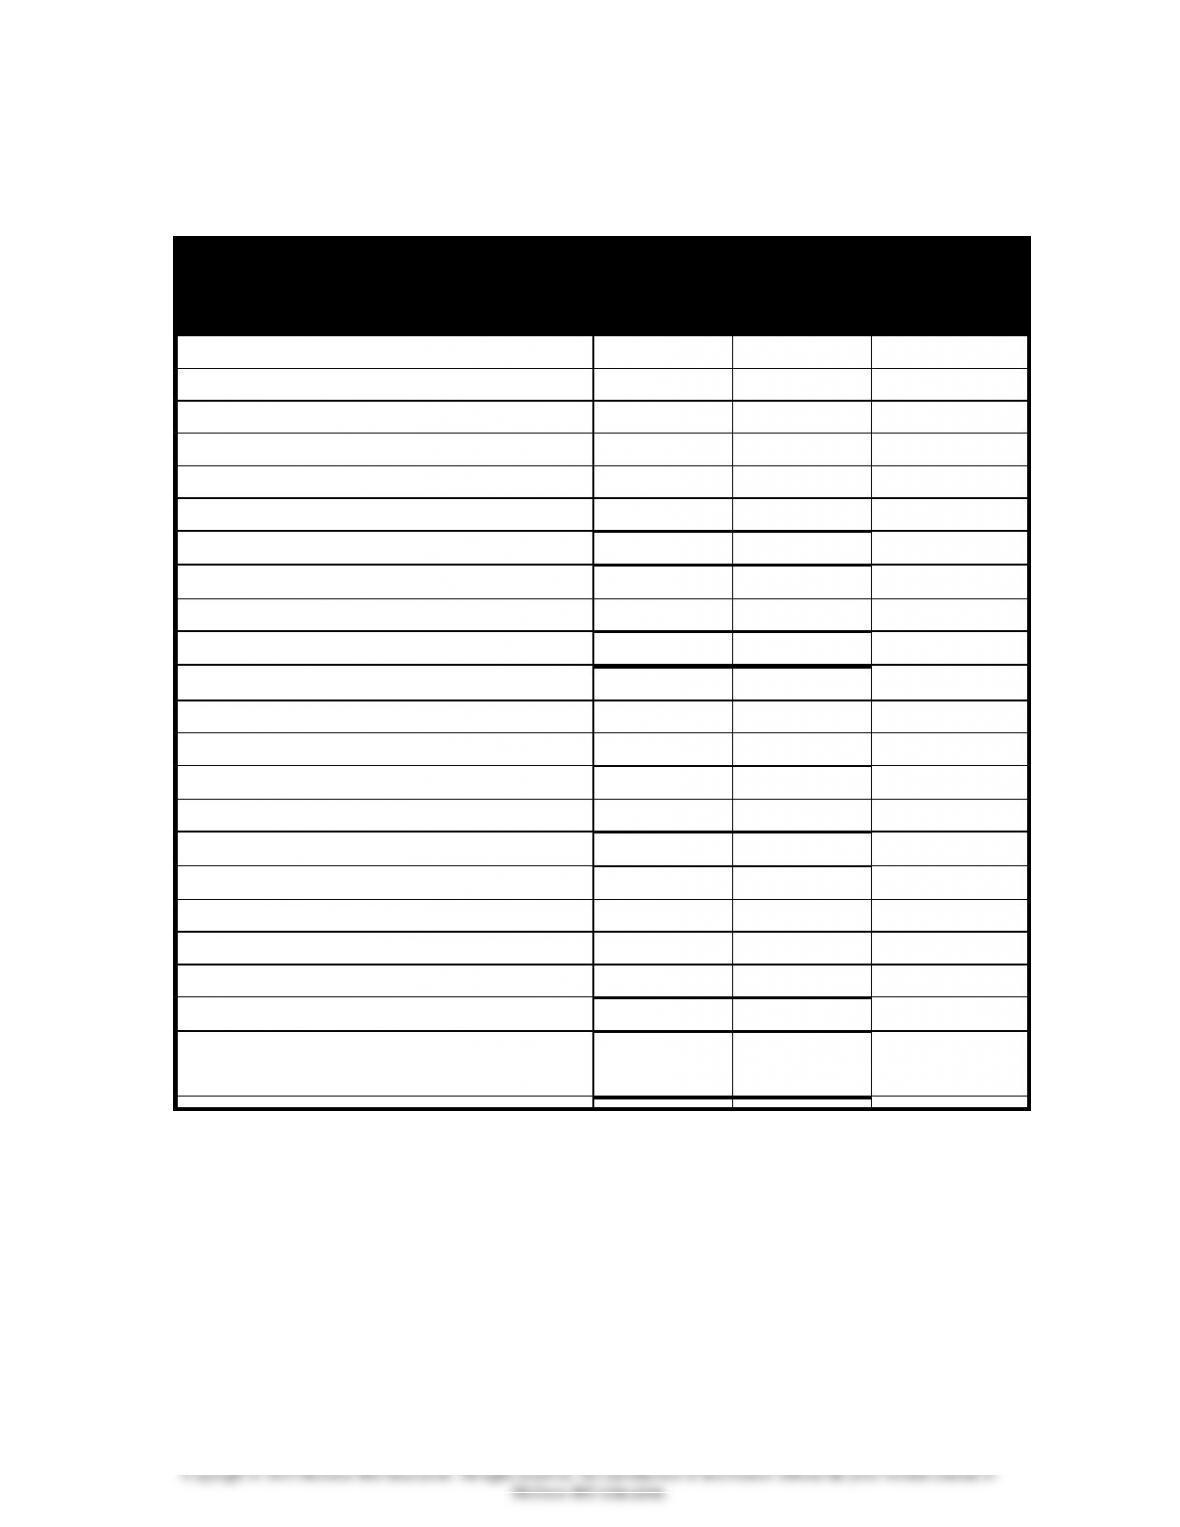
Rosson Company
Vertical Analysis of Income Statements
2015
2014
Amount
% of Total
Amount
% of
Total
Revenues:
Net Sales
$299,000
$246,000
Other Revenues
8,000
9,000
Total Revenues
307,000
255,000
Expenses:
Cost of Goods Sold
172,000
138,000
S,G&A Expenses
44,000
40,000
Interest Expense
4,000
4,500
Income Tax Expense
31,000
25,400
Total Expenses
251,000
*
207,900
*
Income Before X/O Items
56,000
47,100
Extraordinary Gain (net of tax)
9,000
0
Net Income
$ 65,000
$ 47,100
*Percentages don’t add up exactly because of rounding.
9-16
Demonstration Problem 9-1 Work Papers
b. continued
Rosson Company
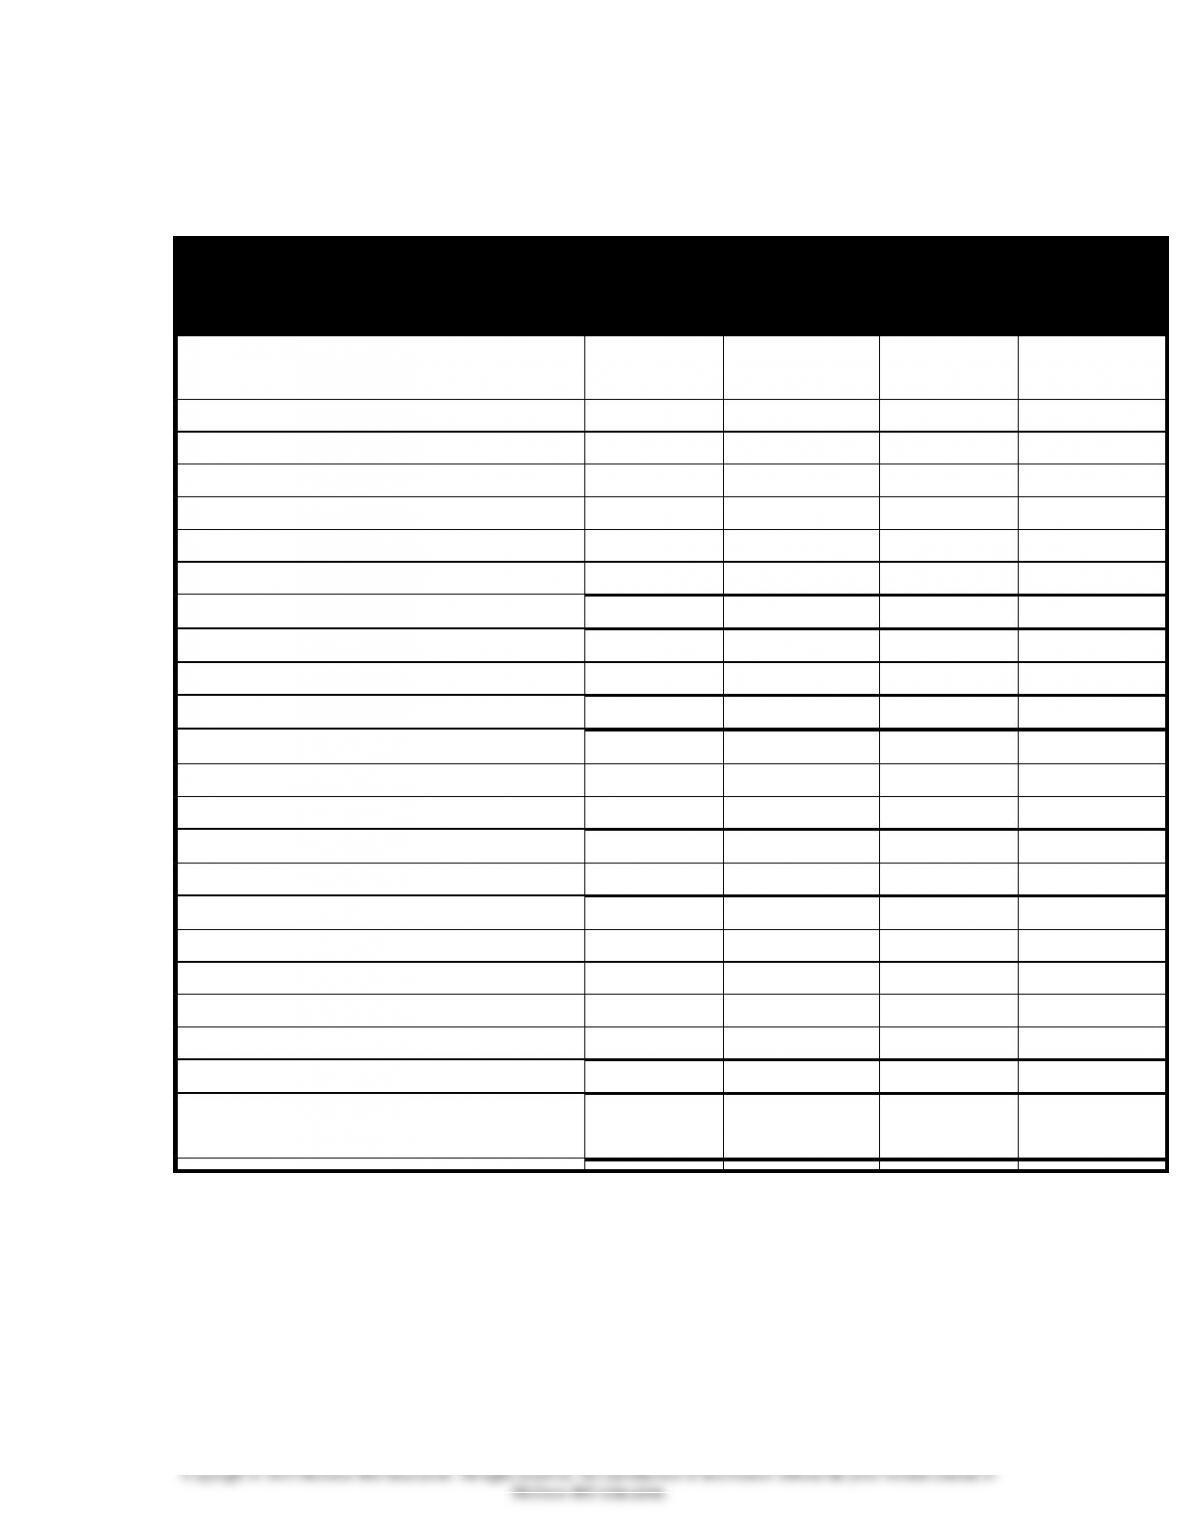
Vertical Analysis of Balance Sheets
2015
2014
Amount
% of Total
Amount
% of
Total
Assets
Cash
$ 7,500
$ 12,500
Marketable Securities
1,000
1,500
Accounts Receivable
50,000
47,500
Inventories
150,000
145,000
Prepaid Expenses
5,000
2,500
Total Current Assets
213,500
*
209,000
*
Plant and Equipment (net)
147,000
157,000
Intangibles
30,500
0
Total Assets
$391,000
$366,000
Liabilities
Accounts Payable
$ 58,000
$ 79,500
Other Accrued Liabilities
25,000
22,500
Total Current Liabilities
83,000
*
102,000
Bonds Payable
90,000
100,000
Total Liabilities
173,000
202,000
Stockholders’ Equity
Common Stock ($5 par)
130,000
130,000
Paid-in Cap. in Excess of Par
20,000
20,000
Retained Earnings
68,000
14,000
Total Stockholders’ Equity
218,000
*
164,000
Total Liabilities and
Stk.Equity
$391,000
$366,000
*Percentages don’t add up exactly because of rounding.
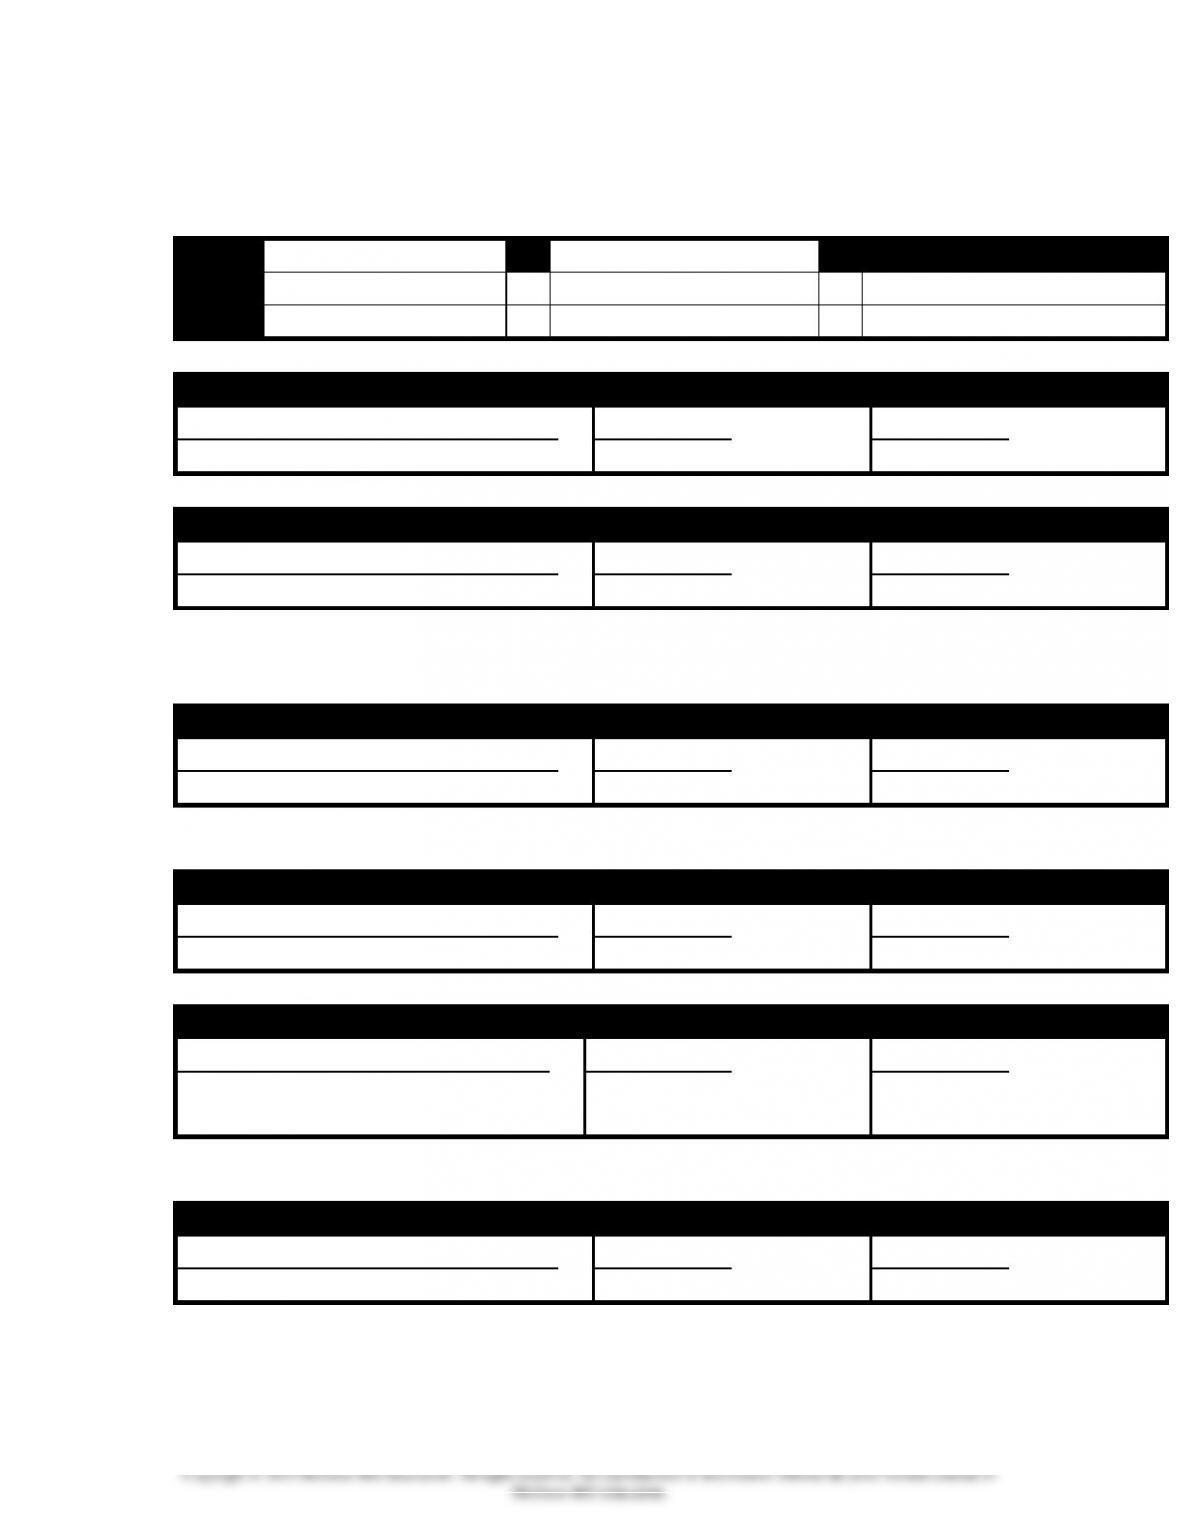
9-17
Demonstration Problem 9-1 Work Papers
c. Liquidity Ratios
(1)
–
=
Working Capital
2015
–
=
$130,500
2014
–
=
$107,000
(2) Current Ratio
2015
2014
=
= ___to 1
= ___ to 1
(3) Quick (Acid-test) Ratio
2015
2014
1
=
= ___to 1
= ___ to 1
12015:
2014:
(4) Accts. Receivable Turnover
2015
2014
=
= ___
times
= ___
times
2
2
(5)Avg. Days to Collect Receivables
2015
2014
=
= ____
days
= ____
days
(6) Inventory Turnover
2015
2014
=
= ____
times
= ____
times
3
3
(7) Avg. Days to Sell Inventory
2015
2014
=
= ____
days
= ___ days
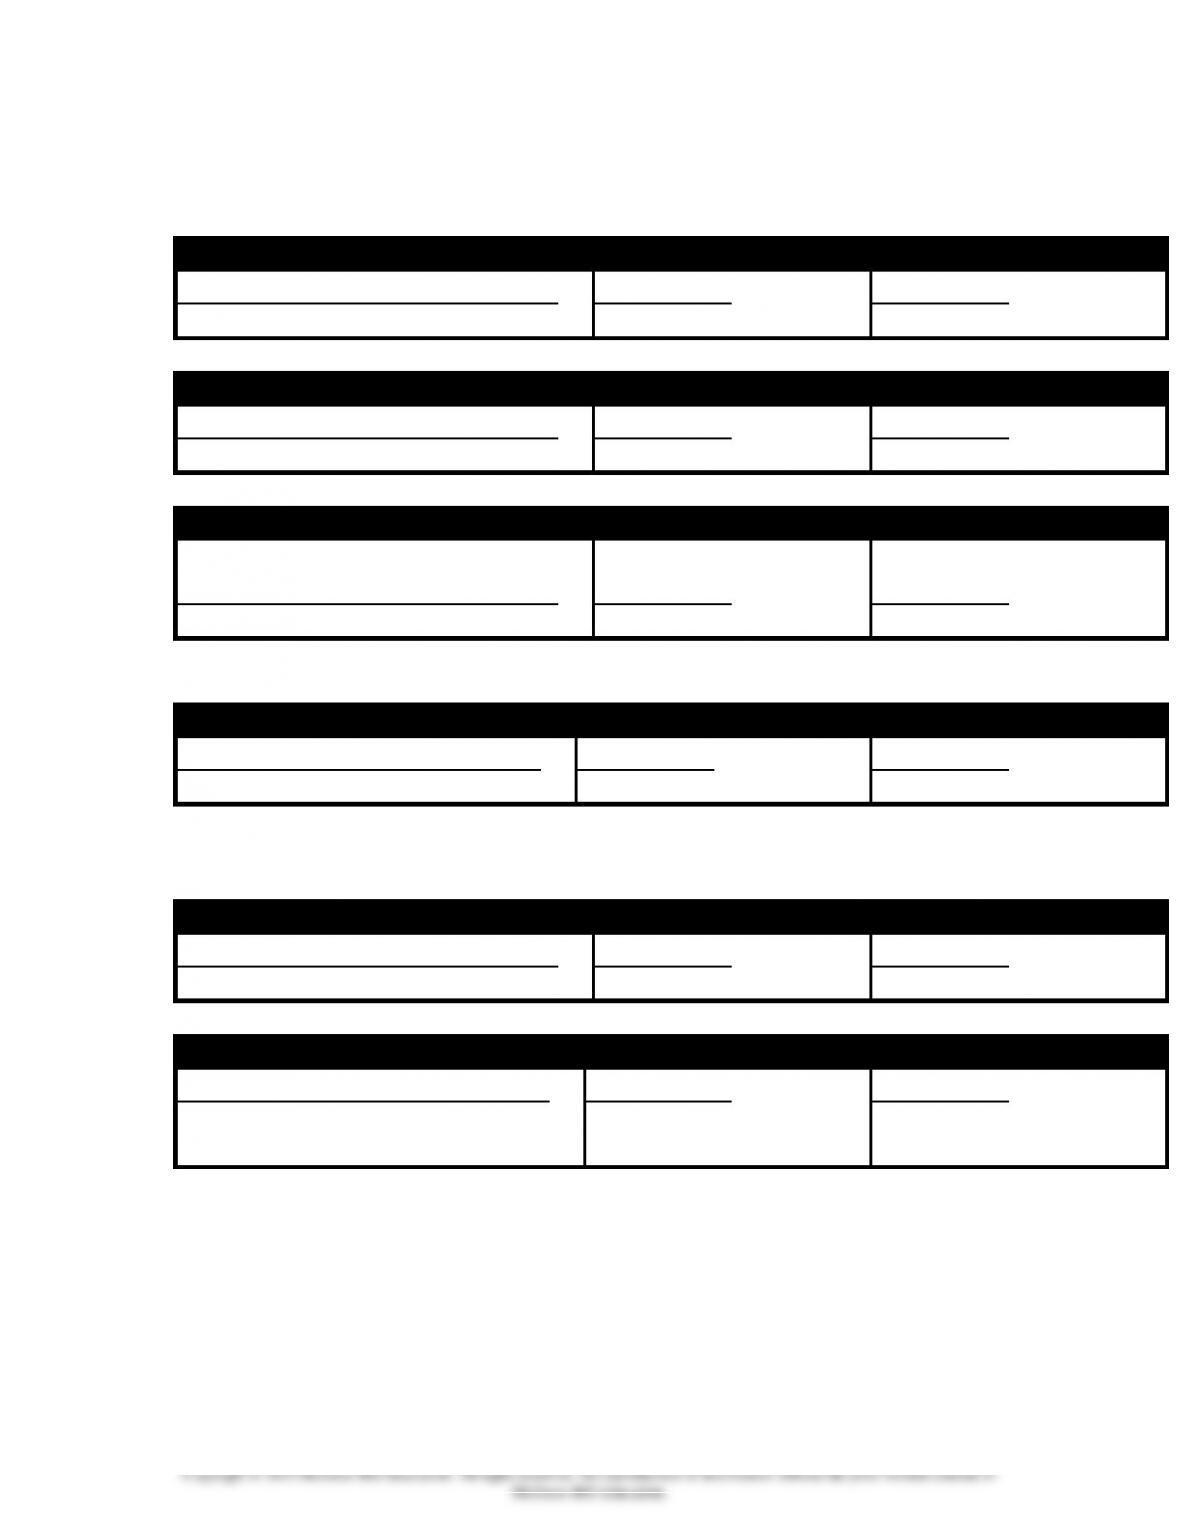
9-18
Demonstration Problem 9-1 Work Papers
d. Solvency Ratios
(1) Debt to Assets
2015
2014
=
= %
= %
(2) Debt to Equity Ratio
2015
2014
=
= 79.4%
= 123.2%
(3) Times Interest Earned
2015
2014
=
*
= ____
times
= ____
times
*Before extraordinary gain
(4) Plant Assets to LT Liab.
2015
2014
=
= ___ to 1
= ___ to 1
e. Profitability Ratios
(1) Net Margin
2015
2014
=
= %
= %
(2) Asset Turnover
2015
2014
=
=
=
4
4
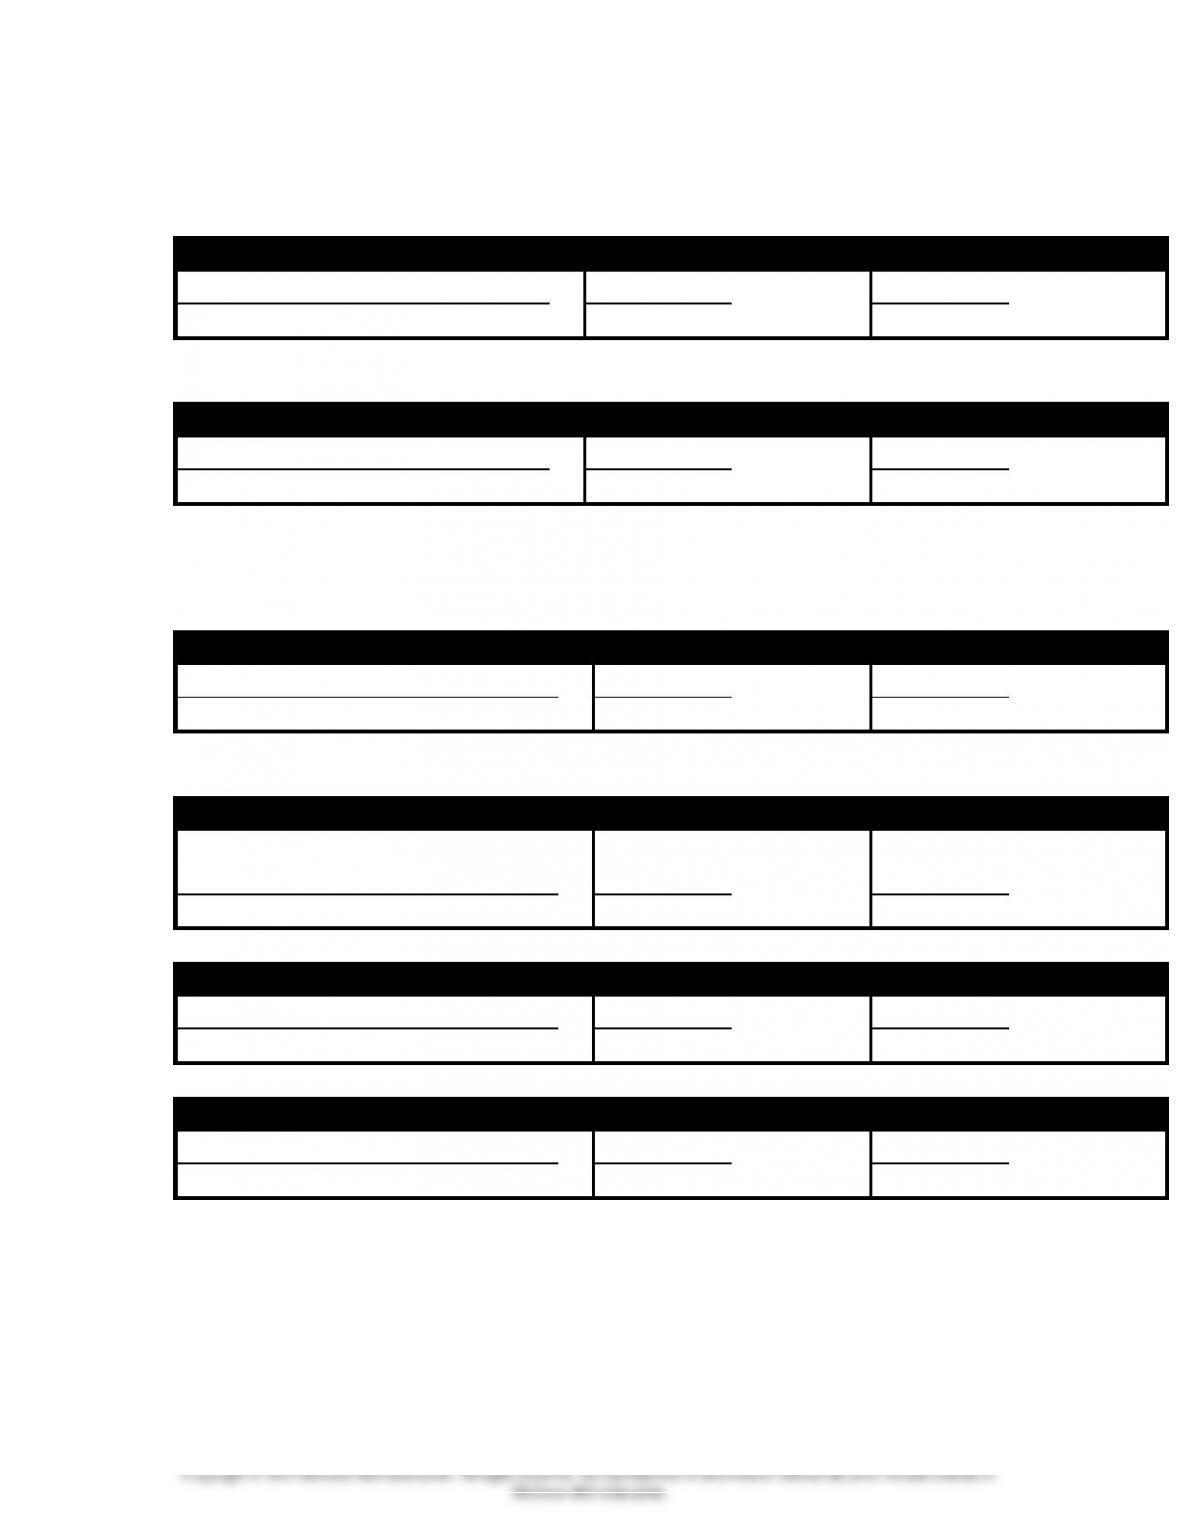
9-19
Demonstration Problem 9-1 Work Papers
e. Profitability Ratios, continued
(3) Return on Investment
2015
2014
=
= ____%
= ____%
5
5(See footnote 4 above)
(4) Return on Equity
2015
2014
=
= ____%
= _____%
6
6
f. Stock Market Ratios
(1) Earnings Per Share
2015
2014
=
= $
= $
7
7
7
(2) Book Value Per Share
2015
2014
=
= $
= $
(3) Price-earnings Ratio
2015
2014
=
=
=
(4) Dividend Yield
2015
2014
=
8
= %
9
= %
8
9