
Chapter 09 – Financial Statement Analysis
9-1
Teaching Notes for Chapter 9
We have provided a comprehensive demonstration problem for Chapter 9. The
requirements of the demonstration problem coincide with the flow of material covered in
the chapter. We suggest you complete the requirements in order. Because the
demonstration problem is comprehensive, we recommend that you prepare a handout of
the solution to the problem. You can introduce the different categories of ratios, compute
a few ratios as examples, and provide time for the students to calculate a few ratios for
reinforcement. If you run out of time, assign computing the remaining ratios as
homework. Having the solution to the problem should provide the support students need
to work independently in the classroom and at home. Begin by distributing
Demonstration Problem 9-1 to your class.
Detailed Outline of a Lesson Plan for Chapter 9
I. Perform horizontal analysis of the income statement and balance sheet data.
Use 2014 as the base year. Explain that horizontal analysis refers to studying
consecutive time periods. Analysts consider whether a company’s performance is
better than in the prior year. Show students how to calculate the percentage
change using the following formula: (current account balance − previous account
balance) ÷ previous account balance. Calculate a couple of percentages to
demonstrate the technique and then have the students calculate a few
independently. Discuss the meaning of the results. Is this year’s performance
better or worse than last year? Assign the remaining computations as homework.
II. Perform vertical analysis of the income statement and balance sheet data.
Use sales revenue as the base figure for the income statement and total assets as
the base figure for the balance sheet. Note that vertical analysis refers to studying
data within one accounting period. Follow the same approach you used when
explaining horizontal analysis. Introduce the topic, demonstrate the computation,
discuss the results, have students make some independent computations, and
assign homework.
III. Calculate the following liquidity ratios: (1) working capital, (2) current ratio,
(3) quick (acid-test) ratio, (4) accounts receivable turnover, (5) average days to
collect receivables, (6) inventory turnover, and (7) average days to sell inventory.
Discuss the meaning of each ratio and comment about the results for the
demonstration problem. Formulas for some of these ratios include average
amounts, such as the average inventory. Note that Demonstration Problem 9-1
includes enough information to calculate these averages for 2015 but not for
2014.
IV. Calculate the following solvency ratios: (1) debt to assets, (2) debt to equity, (3)
number of times interest is earned, and (4) plant assets to long-term liabilities.

Chapter 09 – Financial Statement Analysis
9-2
Discuss the meaning of each ratio and comment about the results for the
demonstration problem.
V. Calculate the following profitability (management effectiveness) ratios: (1)
net margin (return on sales), (2) asset turnover, (3) return on investment, and (4)
return on equity. Discuss the meaning of each ratio and comment about the
results for the demonstration problem.
VI. Calculate the following stock market ratios: (1) earnings per share, (2) book
value per share, (3) price-earnings ratio, (4) dividend yield. Discuss the meaning
of each ratio and comment about the results for the demonstration problem.
VII. Use Exercise 9-3 in class or as homework to reinforce horizontal and vertical
analysis techniques. Use Problems 9-23 in class and 9-24 as homework to
reinforce ratio computations.
Summary Outline of a Lesson Plan for Chapter 9
I. Using Demonstration Problem 9-1, perform horizontal analysis of the income
statement and balance sheet data. Use 2014 as the base year. Introduce the
topic, demonstrate the computation, discuss the results, have students make some
independent computations, and assign the remaining computations as homework.
II. Perform vertical analysis of the income statement and balance sheet data.
Use sales revenue as the base figure for the income statement and total assets as
the base figure for the balance sheet. Introduce the topic, demonstrate the
computation, discuss the results, have students make some independent
computations, and assign homework.
III. Calculate the liquidity ratios in the problem. Discuss the meaning of each ratio
and comment about the results.
IV. Calculate the solvency ratios in the problem. Discuss the meaning of each
ratio and comment about the results.
V. Calculate the profitability (management effectiveness) ratios in the problem.
Discuss the meaning of each ratio and comment about the results.
VI. Calculate the stock market ratios in the problem. Discuss the meaning of each
ratio and comment about the results.
VII. Use Exercise 9-3 in class or as homework to reinforce horizontal and vertical
analysis techniques. Use Problems 9-23 in class and 9-24 as homework to
reinforce ratio computations.
Chapter 09 – Financial Statement Analysis
9-3
Quiz Questions for Chapter 9
Use the following information from KLM Company’s income statements to answer the next three
questions:
2015
2014
Sales ……………………………………………
$121,000
$92,000
Cost of Goods Sold………………………..
75,000
51,000
Selling Expenses …………………………..
12,000
11,000
Administrative Expenses ………………..
12,000
14,000
Interest Expense
3,000
5,000
Total Expenses …………………………
102,000
81,000
Income Before Taxes ……………………..
19,000
11,000
Income Taxes ……………………………….
3,800
2,000
Net Income …………………………………..
$ 15,200
$ 9,000
1. Horizontal analysis indicates that, from 2014 to 2015, KLM’s sales grew by
a. (23.97)%.
b. (31.52)%.
c. 23.97%.
d. 31.52%.
2. Based on horizontal analysis, which of the following is true?
a. Sales grew more rapidly than cost of goods sold.
b. Cost of goods sold grew more rapidly than selling expenses.
c. Administrative expenses declined by 16.7%.
d. both b and c are true.
3. Based on vertical analysis of KLM’s income statements, which of the following is true?
a. KLM produced more net income per sales dollar in 2014 than in 2015.
b. KLM’s selling expenses were a smaller percentage of sales in 2014 than in 2015.
c. KLM’s total expenses were a greater percentage of sales in 2014 than in 2015.
d. all of the above are true.
Use the following information from XYZ Company’s balance sheet to answer the next six questions:
Assets
Cash …………………………………………………
$ 6,000
Marketable Securities …………………………
3,200
Accounts Receivable ………………………….
5,200
Inventory ………………………………………….
14,400
Property and Equipment ……………………..
68,000
Accumulated Depreciation ………………….
(5,000)
Total Assets …………………………………..
$91,800
Liabilities and Stockholders’ Equity
Accounts Payable ………………………………
$ 3,400
Notes Payable (current) ………………………
1,400
Mortgage Payable (long-term) …………….
1,800
Bonds Payable (long-term) ………………….
28,600
Common Stock, $50 Par ……………………..
24,000
Paid-in Capital in Excess of Par …………..
11,600
Retained Earnings ……………………………..
21,000
Total Liab. and Stockholders’ Equity ..
$91,800

Chapter 09 – Financial Statement Analysis
9-4
The average number of common stock shares outstanding during the year was 840 shares. Net earnings for
the year were $6,300.
4. XYZ’s current ratio is
a. 6.0 to 1.
b. 5.5 to 1.
c. 4.0 to 1.
d. 4.5 to 1.
5. XYZ’s quick (acid-test) ratio is
a. 4.0 to 1.
b. 4.5 to 1.
c. 3.5 to 1.
d. 3.0 to 1.
6. XYZ’s earnings per share is
a. $7.50 per share.
b. $7.00 per share.
c. $0.13 per share.
d. none of the above.
7. XYZ’s return on assets is
a. 7.86%.
b. 14.57%.
c. 23.4%.
d. 6.86%.
8. XYZ’s return on equity is
a. 2.56%.
b. 8.98%.
c. 11.13%.
d. none of the above.
9. XYZ’s debt to equity ratio is
a. 75.00%.
b. 62.19%.
c. 34.23%.
d. 22.22%.
10. ABC Company’s merchandise inventories and other selected amounts for 2015 follow:
Sales $3,000,000
Cost of Goods Sold 2,200,000
Merchandise Inventory:
Beginning of Year 500,000
End of Year 600,000
How many times did the merchandise inventory turnover during 2015?
a. 4.00
b. 4.40
c. 5.00
d. 5.45

9-5
11. The following data were abstracted from the financial records of the BXR Corporation for 2015:
Sales $3,600,000
Interest Expense 120,000
Income Taxes 600,000
Net Income 800,000
How many times was interest earned in 2015?
a. 12.67 times
b. 14.40 times
c. 15.33 times
d. 15.45 times
12. CC Company wrote off a $100 uncollectible account receivable against the $1,200 balance in its
allowance account. Compare the current ratio before the write-off (X) with the current ratio after the
write-off (Y).
a. X is greater than Y.
b. X equals Y.
c. X is less than Y.
d. The answer cannot be determined from the information given.
13. EST, Inc. neglected to record the amortization of its intangible asset, a patent. Compare the
company’s net earnings without this amortization (X) and what the company’s net earnings would
have been with such amortization (Y).
a. X is greater than Y.
b. X equals Y.
c. X is less than Y.
d. The answer cannot be determined from the information given.
Chapter 09 – Financial Statement Analysis
9-6
Solutions to Quiz Questions
Question
Answer
1
D
2
B
3
C
4
A
5
D
6
A
7
D
8
C
9
B
10
A
11
A
12
B
13
A

Chapter 09 – Financial Statement Analysis
9-7
Demonstration Problem for Chapter 9
Demonstration Problem 9-1 Analyzing Financial Statements
Information below comes from the financial statements of Rosson Company.
2015
2014
Revenues:
Net Sales ………………………………………
$299,000
$246,000
Other Revenues ……………………………..
8,000
9,000
Total Revenues ………………………….
307,000
255,000
Expenses:
Cost of Goods Sold ………………………..
172,000
138,000
S,G&A Expenses …………………………..
44,000
40,000
Interest Expense …………………………….
4,000
4,500
Income Tax Expense ……………………..
31,000
25,400
Total Expenses …………………………..
251,000
207,900
Income Before Extraordinary Items ……..
56,000
47,100
Extraordinary Gain (net of tax) ……………
9,000
0
Net Income …………………………..………….
$ 65,000
$ 47,100
Assets
Current Assets:
Cash …………………………………………….
$ 7,500
$ 12,500
Marketable Securities …………………….
1,000
1,500
Accounts Receivable………………………
50,000
47,500
Inventories ……………………………………
150,000
145,000
Prepaid Expenses …………………………..
5,000
2,500
Total Current Assets …………………..
213,500
209,000
Plant and Equipment (net) ………………….
147,000
157,000
Intangibles ……………………………………….
30,500
0
Total Assets ………………………………….
$391,000
$366,000
Liabilities and Stockholders’ Equity
Liabilities:
Current Liabilities:
Accounts Payable ……………………….
$ 58,000
$ 79,500
Other Accrued Liabilities …………….
25,000
22,500
Total Current Liabilities …………….
83,000
102,000
Bonds Payable ………………………………
90,000
100,000
Total Liabilities ………………………….
173,000
202,000
Stockholders’ Equity:
Common Stock ($5 par) ………………….
130,000
130,000
Paid-In Capital in Excess of Par ……… of Par
20,000
20,000
Retained Earnings ………………………….
68,000
14,000
Total Stockholders’ Equity ………….
218,000
164,000
Total Liabilities and Stockholders’
Equity…………………………………….
$391,000
$366,000
Common stock market price at year-end
$14.00
$8.55
Dividend payments amounted to $11,000 in 2015 and $5,000 in 2014.

Chapter 09 – Financial Statement Analysis
9-8
Required
Perform the following analyses. If you have insufficient data to use averages in ratio
computations, use year-end balances in the calculations.
a. Perform horizontal analysis of the income statement and balance sheet data. Use
2014 as the base year.
b. Perform vertical analysis of the income statement and balance sheet data for 2014 and
2015. Use sales revenue as the base figure for the income statement. Use total assets
as the base figure for the balance sheet.
c. Calculate the following liquidity ratios for 2015 and 2014: (1) working capital, (2)
current ratio, (3) quick (acid-test) ratio, (4) accounts receivable turnover, (5) average
days to collect receivables, (6) inventory turnover, and (7) average days to sell
inventory.
d. Calculate the following solvency ratios for 2015 and 2014: (1) debt to assets ratio,
(2) debt to equity ratio, (3) number of times interest is earned, and (4) plant assets to
long-term liabilities.
e. Calculate the following profitability ratios for 2015 and 2014: (1) net margin, (2)
asset turnover, (3) return on investment, and (4) return on equity.
f. Calculate the following stock market ratios for 2015 and 2014: (1) earnings per
share, (2) book value per share, (3) price-earnings ratio, and (4) dividend yield.
Chapter 09 – Financial Statement Analysis
9-9
Demonstration Problem 9-1 Solution
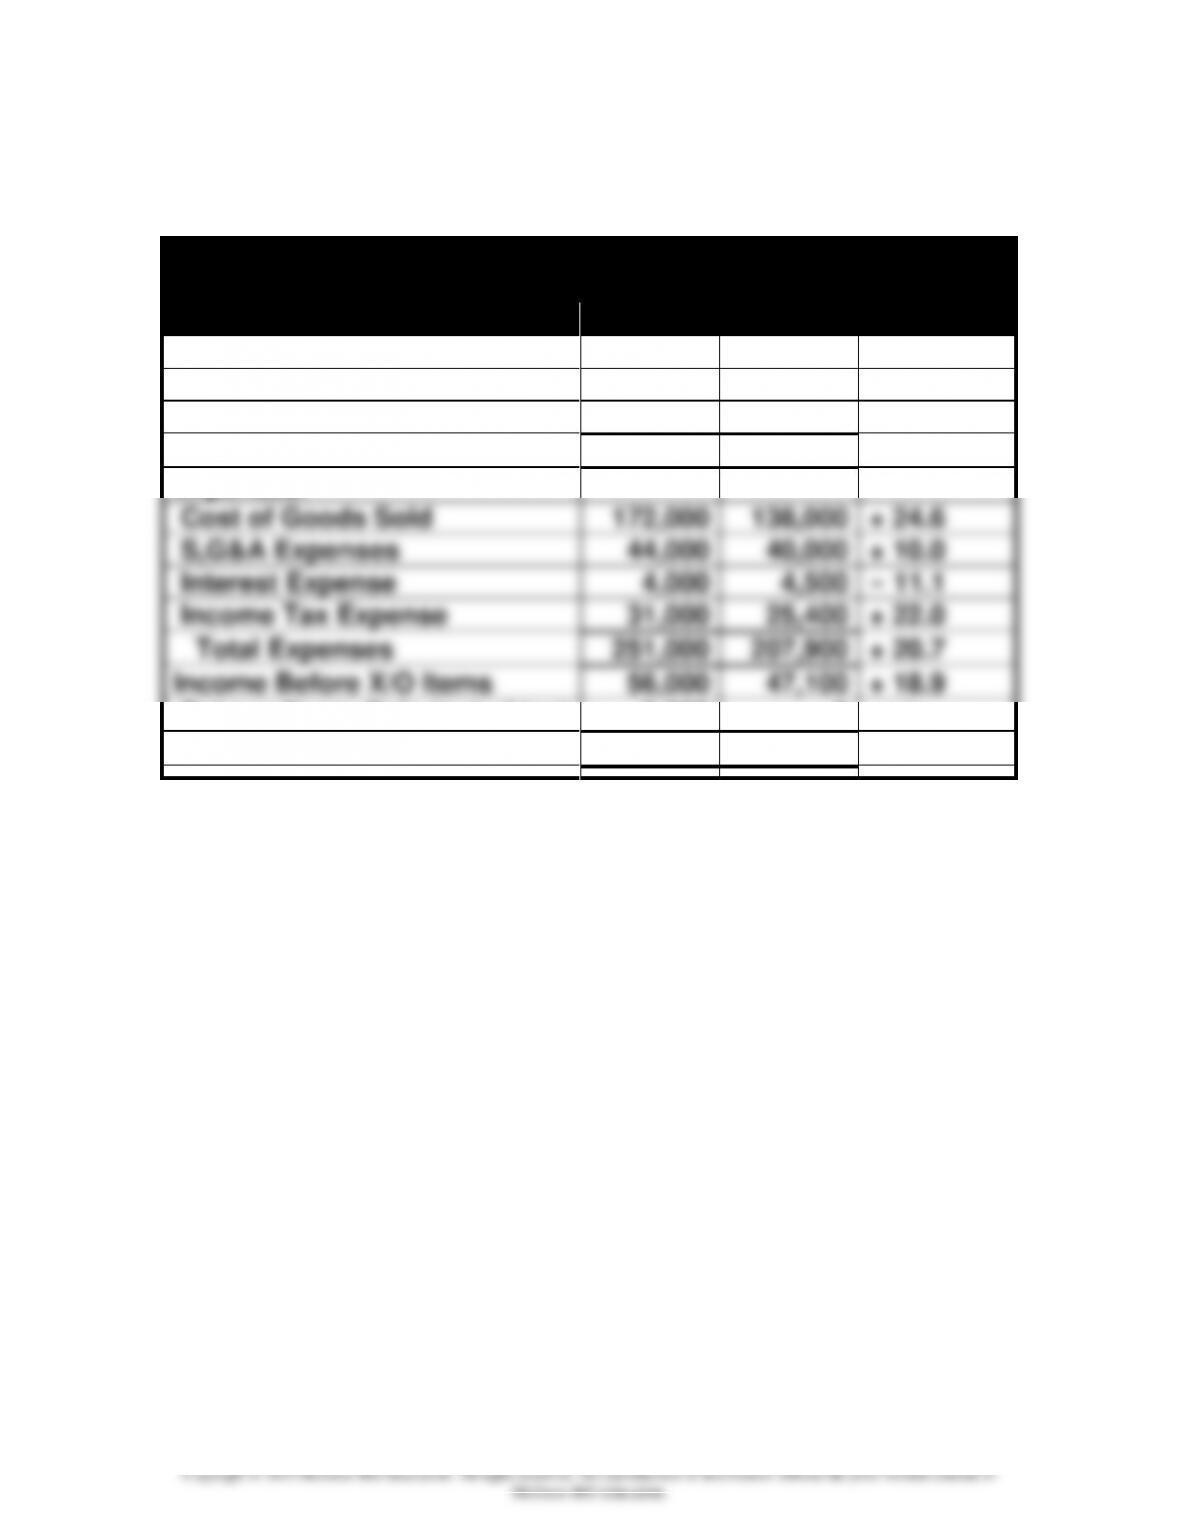
a.
Rosson Company
Horizontal Analysis of Income Statements
2015
2014
% Change
Revenues:
Net Sales
$299,000
$246,000
+ 21.5%
Other Revenues
8,000
9,000
–11.1
Total Revenues
307,000
255,000
+ 20.4
Expenses:
Cost of Goods Sold
172,000
138,000
+ 24.6
S,G&A Expenses
44,000
40,000
+ 10.0
Interest Expense
4,000
4,500
– 11.1
Income Tax Expense
31,000
25,400
+ 22.0
Total Expenses
251,000
207,900
+ 20.7
Income Before X/O Items
56,000
47,100
+ 18.9
Extraordinary Gain (net of tax)
9,000
0
n/a
Net Income
$ 65,000
$ 47,100
+ 38.0
Chapter 09 – Financial Statement Analysis
9-10
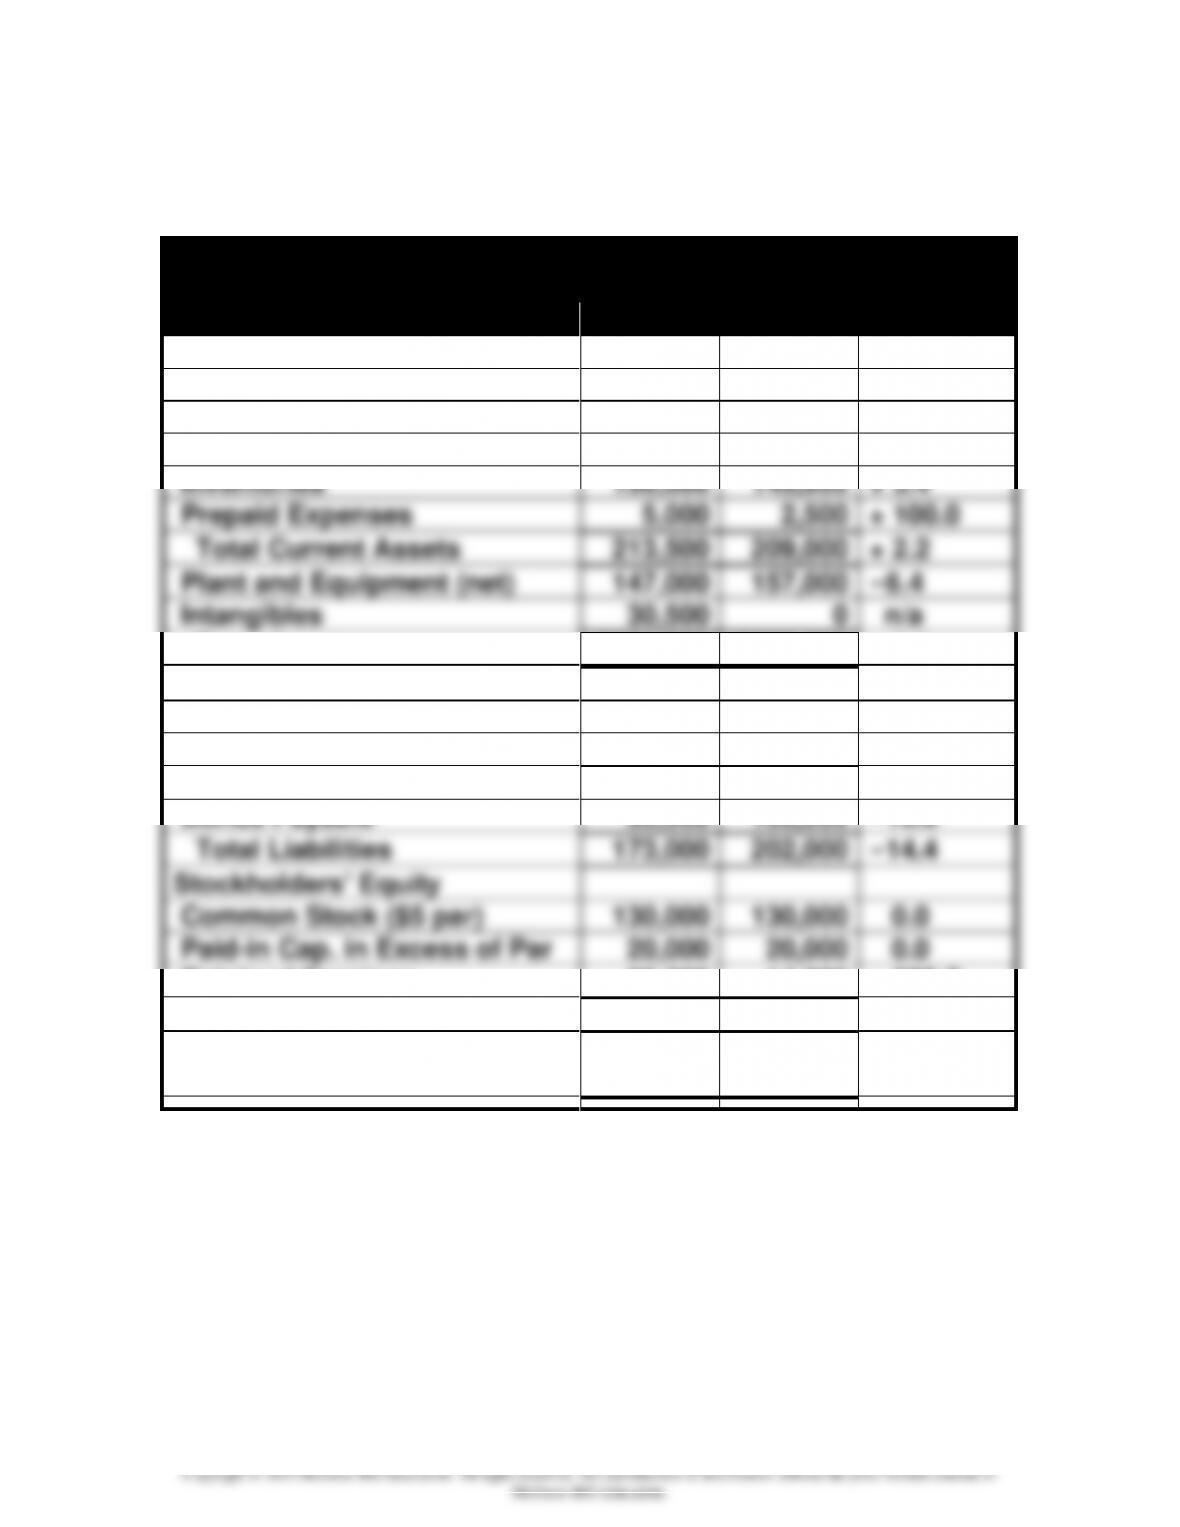
Demonstration Problem 9-1 Solution
a. continued
Rosson Company
Horizontal Analysis of Balance Sheets
2015
2014
% Change
Assets
Cash
$ 7,500
$ 12,500
–40.0%
Marketable Securities
1,000
1,500
–33.3
Accounts Receivable
50,000
47,500
+ 5.3
Inventories
150,000
145,000
+ 3.4
Prepaid Expenses
5,000
2,500
+ 100.0
Total Current Assets
213,500
209,000
+ 2.2
Plant and Equipment (net)
147,000
157,000
–6.4
Intangibles
30,500
0
n/a
Total Assets
$391,000
$366,000
+ 6.8
Liabilities
Accounts Payable
$ 58,000
$ 79,500
–27.0
Other Accrued Liabilities
25,000
22,500
+ 11.1
Total Current Liabilities
83,000
102,000
–18.6
Bonds Payable
90,000
100,000
–10.0
Total Liabilities
173,000
202,000
–14.4
Stockholders’ Equity
Common Stock ($5 par)
130,000
130,000
0.0
Paid-in Cap. in Excess of Par
20,000
20,000
0.0
Retained Earnings
68,000
14,000
+ 385.7
Total Stockholders’ Equity
218,000
164,000
+ 32.9
Total Liabilities and Stk.
Equity
$391,000
$366,000
+ 6.8
Chapter 09 – Financial Statement Analysis
9-11
Demonstration Problem 9-1 Solution
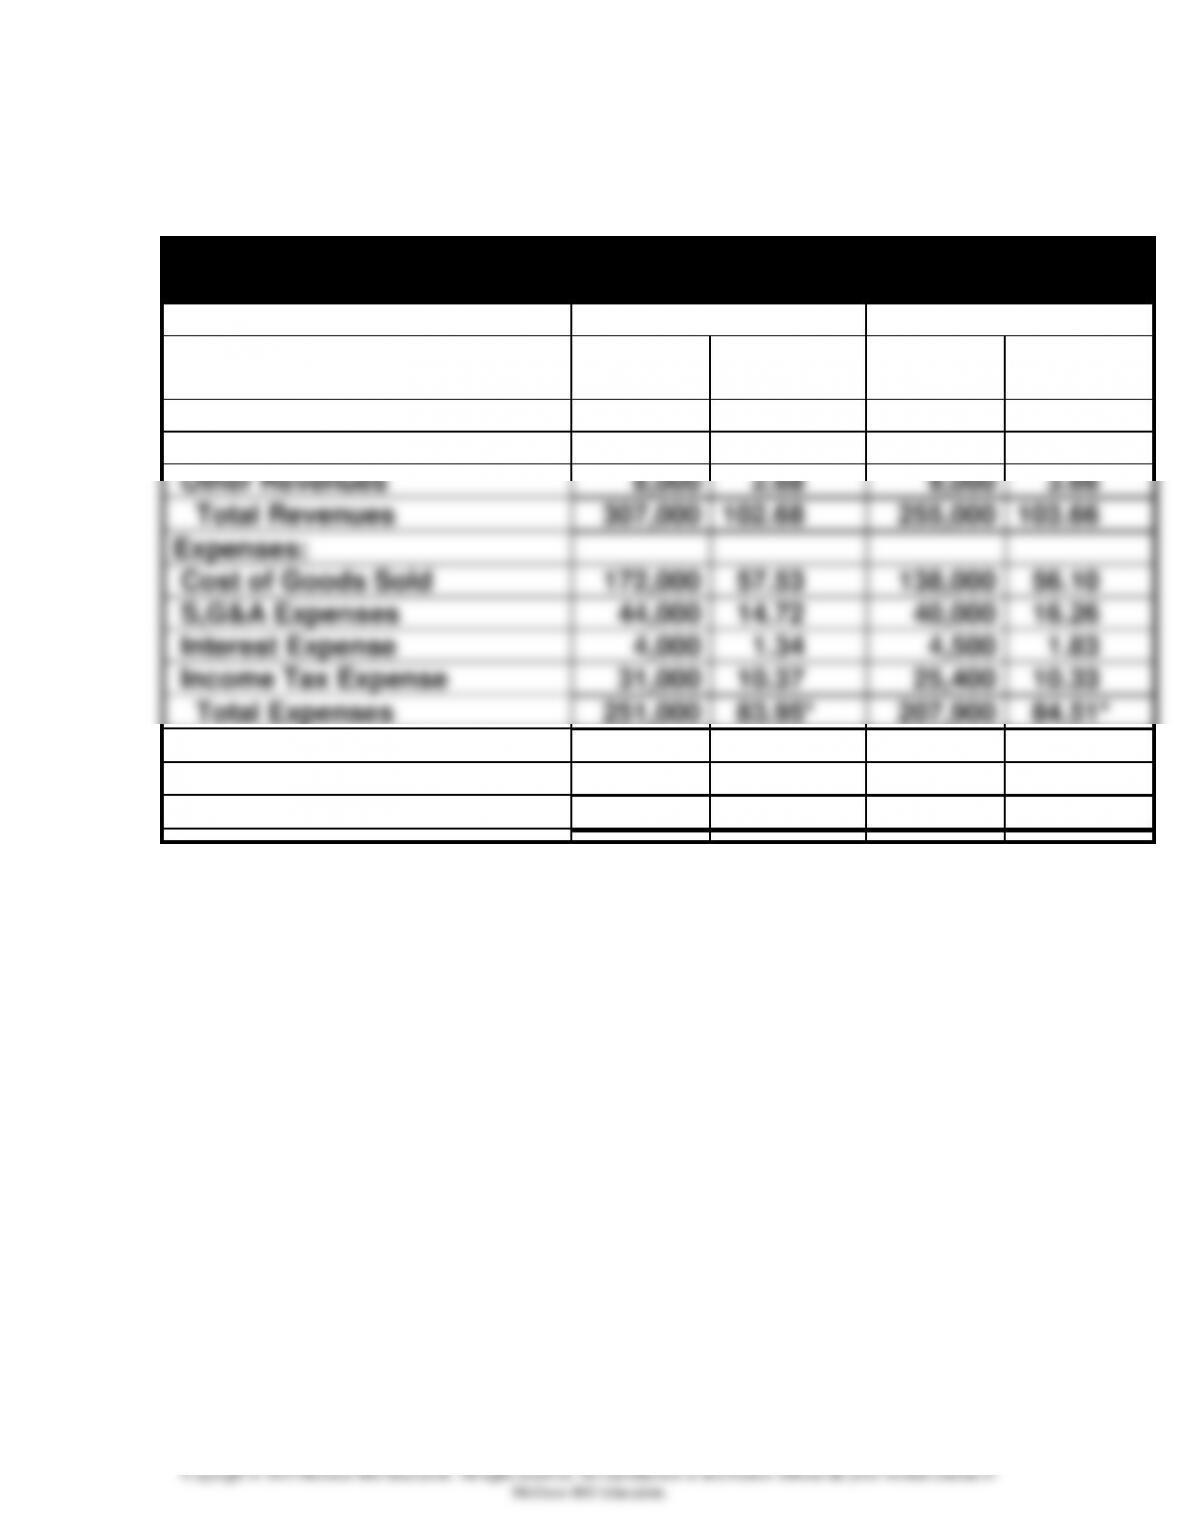
b.
Rosson Company
Vertical Analysis of Income Statements
2015
2014
Amount
% of Total
Amount
% of
Total
Revenues:
Net Sales
$299,000
100.00%
$246,000
100.00%
Other Revenues
8,000
2.68
9,000
3.66
Total Revenues
307,000
102.68
255,000
103.66
Expenses:
Cost of Goods Sold
172,000
57.53
138,000
56.10
S,G&A Expenses
44,000
14.72
40,000
16.26
Interest Expense
4,000
1.34
4,500
1.83
Income Tax Expense
31,000
10.37
25,400
10.33
Total Expenses
251,000
83.95*
207,900
84.51*
Income Before X/O Items
56,000
18.73
47,100
19.15
Extraordinary Gain (net of tax)
9,000
3.01
0
0.00
Net Income
$ 65,000
21.74
$ 47,100
19.15
*Percentages don’t add up exactly because of rounding.