6-1
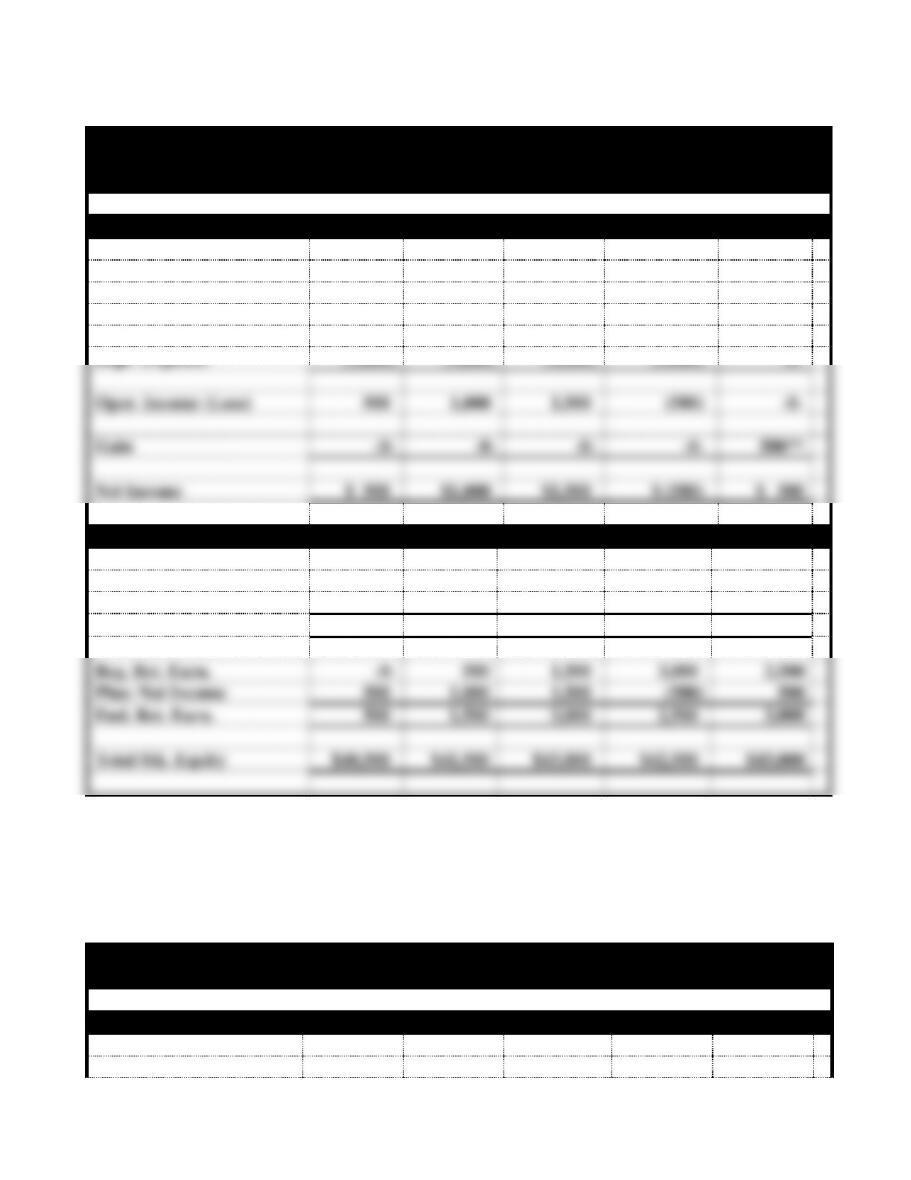
PROBLEM 6-25
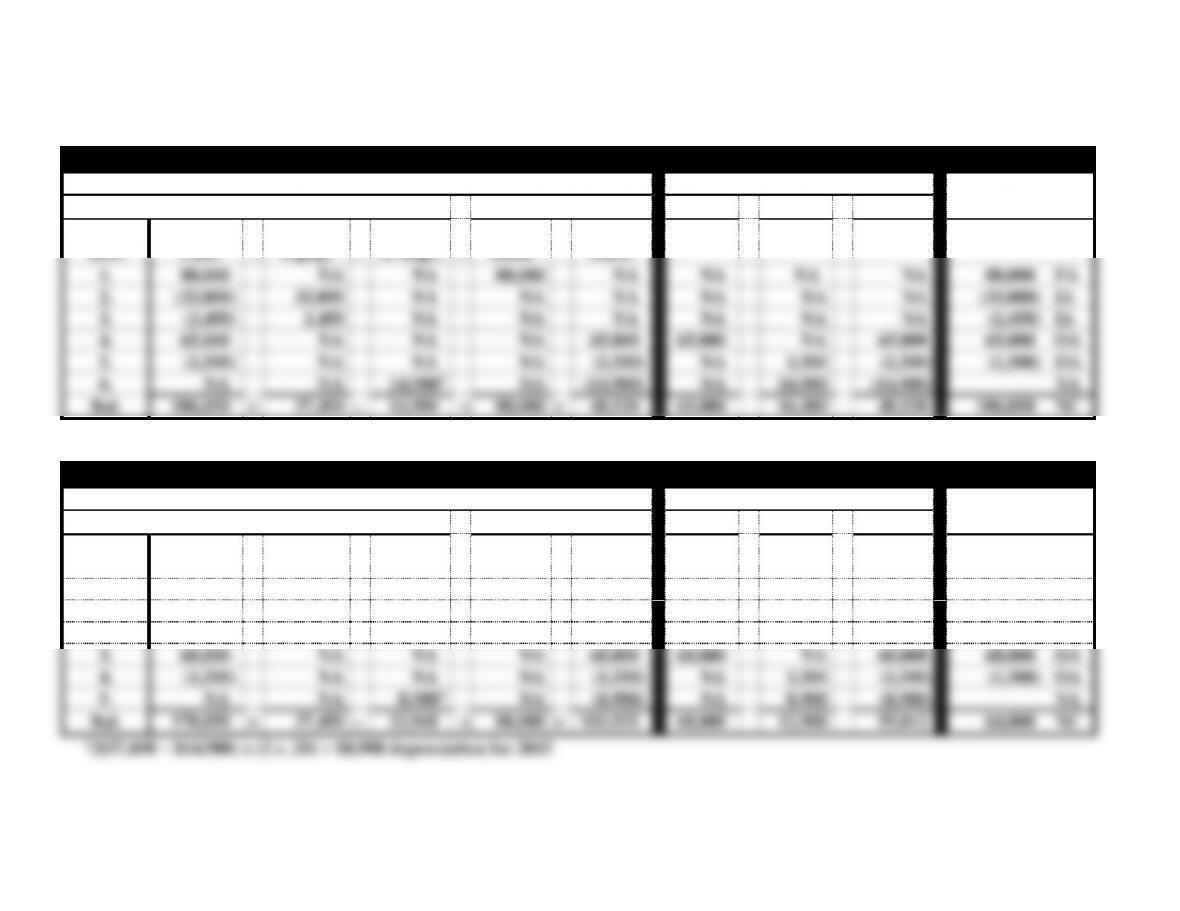
Zhao Company
Financial Statements
For the Year Ended December 31
Income Statements
2014
2015
2016
2017
2018
Revenue
$9,500
$10,000
$10,500
$8,500
$ -0–
Depr. Expense*
(9,000)
(9,000)
(9,000)
(9,000)
-0-
Oper. Income (Loss)
500
1,000
1,500
(500)
-0-
Gain
-0-
-0-
-0-
-0-
500**
Net Income
$ 500
$1,000
$1,500
$ (500)
$ 500
Statements of Changes in Stockholders’ Equity
Beg. Com. Stock
$ -0-
$40,000
$40,000
$40,000
$40,000
Plus: Stk. Issued
40,000
-0-
-0-
-0-
-0-
End. Com. Stock
40,000
40,000
40,000
40,000
40,000
Beg. Ret. Earn.
-0-
500
1,500
3,000
2,500
Plus: Net Income
500
1,000
1,500
(500)
500
End. Ret. Earn.
500
1,500
3,000
2,500
3,000
Total Stk. Equity
$40,500
$41,500
$43,000
$42,500
$43,000
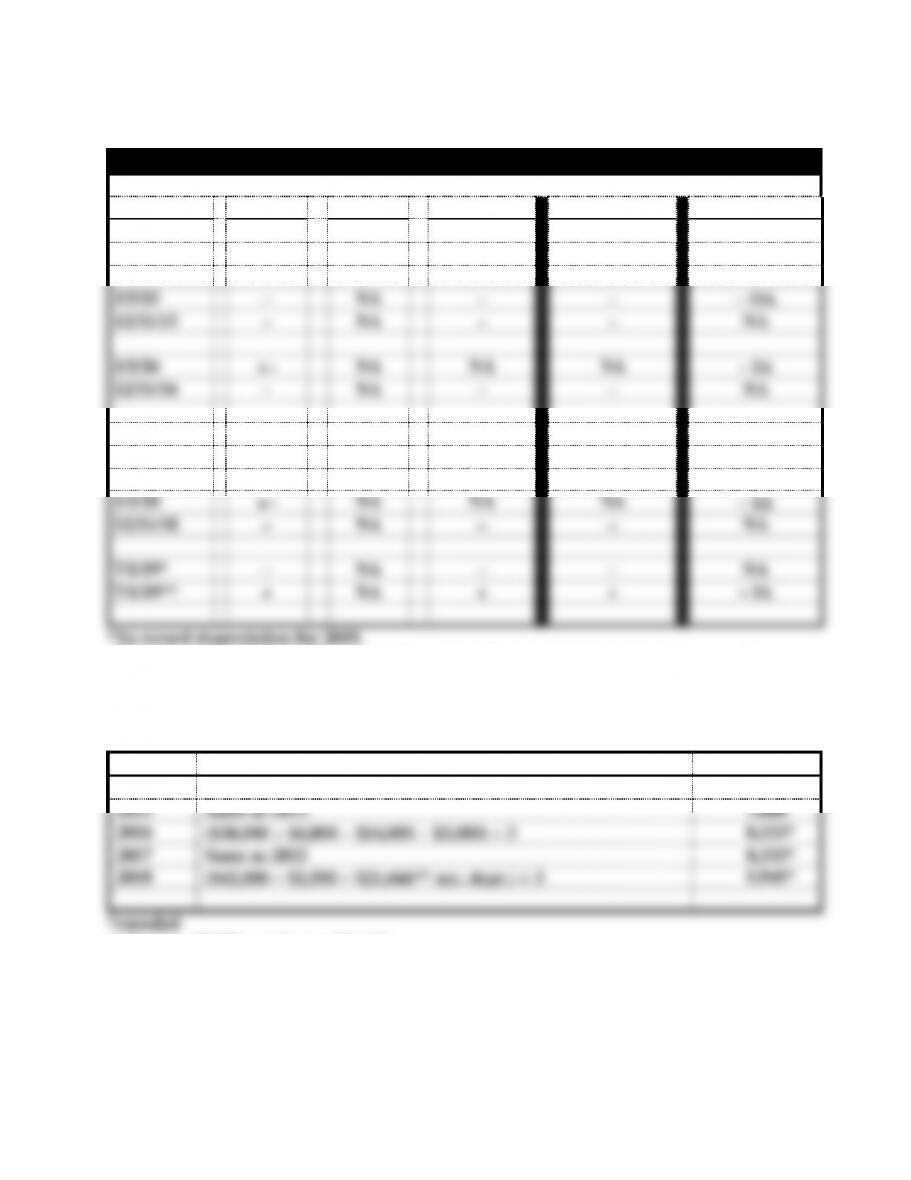
*Depreciation: $40,000 − $4,000 (salvage value) = $36,000;
$36,000 4 = $9,000 per year
**Sale of Equipment: Sales price $4,500 less book value $4,000=$500 gain
PROBLEM 6-25 (cont.)
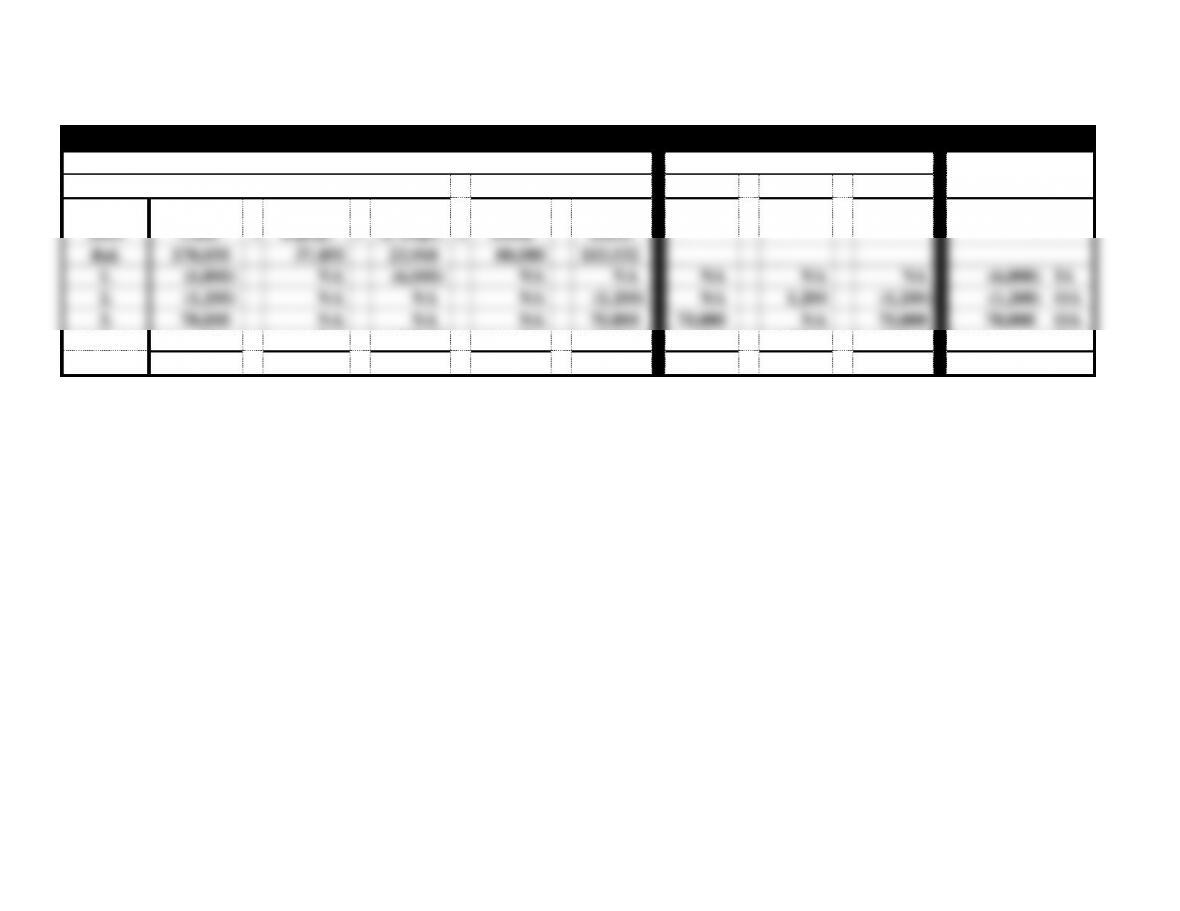
Zhao Company
Financial Statements
Balance Sheets as of December 31
2014
2015
2016
2017
2018
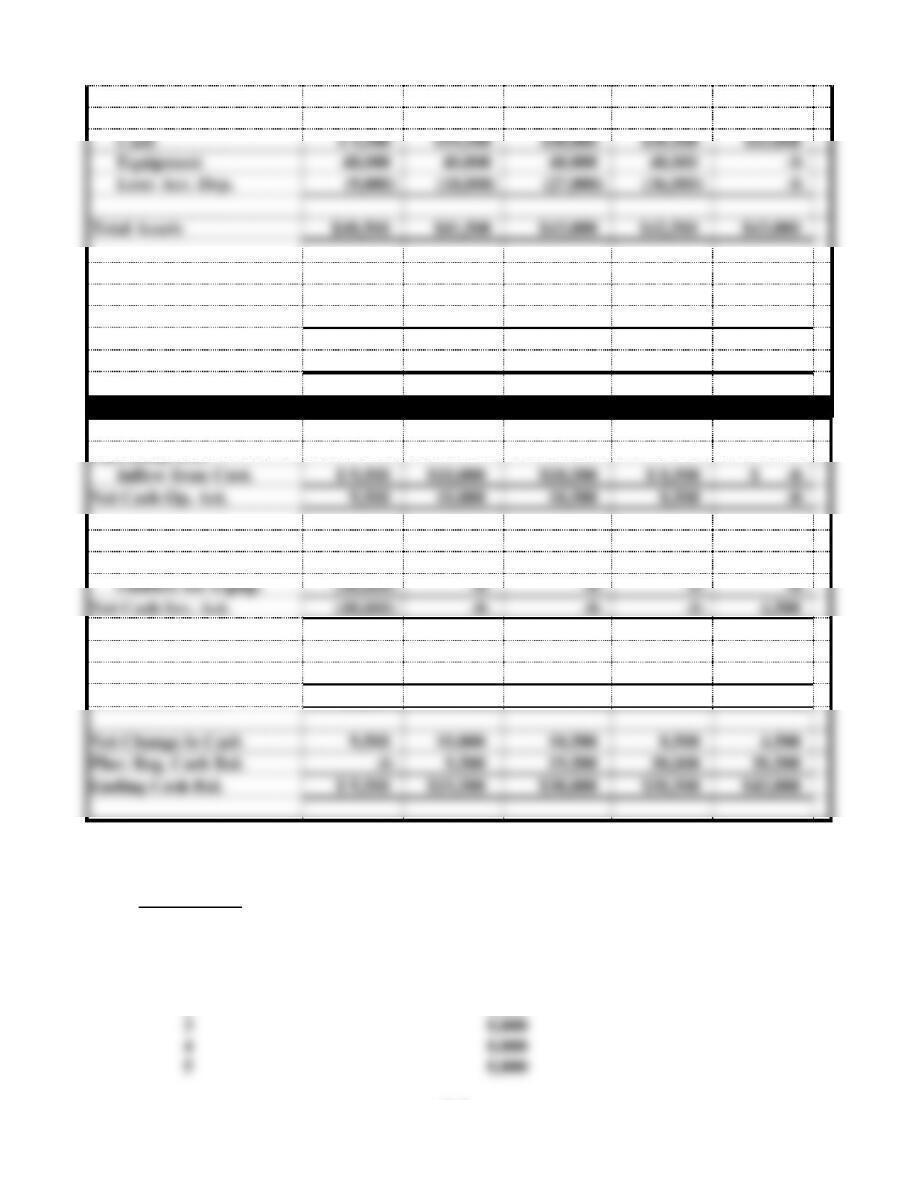
6-2
Assets
Cash
$ 9,500
$19,500
$30,000
$38,500
$43,000
Equipment
40,000
40,000
40,000
40,000
-0-
Less: Acc. Dep.
(9,000)
(18,000)
(27,000)
(36,000)
-0-
Total Assets
$40,500
$41,500
$43,000
$42,500
$43,000
Stockholders’ Equity
Common Stock
$40,000
$40,000
$40,000
$40,000
$40,000
Retained Earnings
500
1,500
3,000
2,500
3,000
Total Stk. Equity
$40,500
$41,500
$43,000
$42,500
$43,000
Statements of Cash Flows for the Year Ended December 31
Operating Act.:
Inflow from Cust.
$ 9,500
$10,000
$10,500
$ 8,500
$ -0-
Net Cash Op. Act.
9,500
10,000
10,500
8,500
-0-
Investing Act.:
Inflow from Sale
-0-
-0-
-0-
-0-
4,500
Outflow for Equip.
(40,000)
-0-
-0-
-0-
-0-
Net Cash Inv. Act.
(40,000)
-0-
-0-
-0-
4,500
Financing Act.
Inflow from Stock
40,000
-0-
-0-
-0-
-0-
Net Cash Fin. Act.
40,000
-0-
-0-
-0-
-0-
Net Change in Cash
9,500
10,000
10,500
8,500
4,500
Plus: Beg. Cash Bal.
-0-
9,500
19,500
30,000
38,500
Ending Cash Bal.
$ 9,500
$19,500
$30,000
$38,500
$43,000
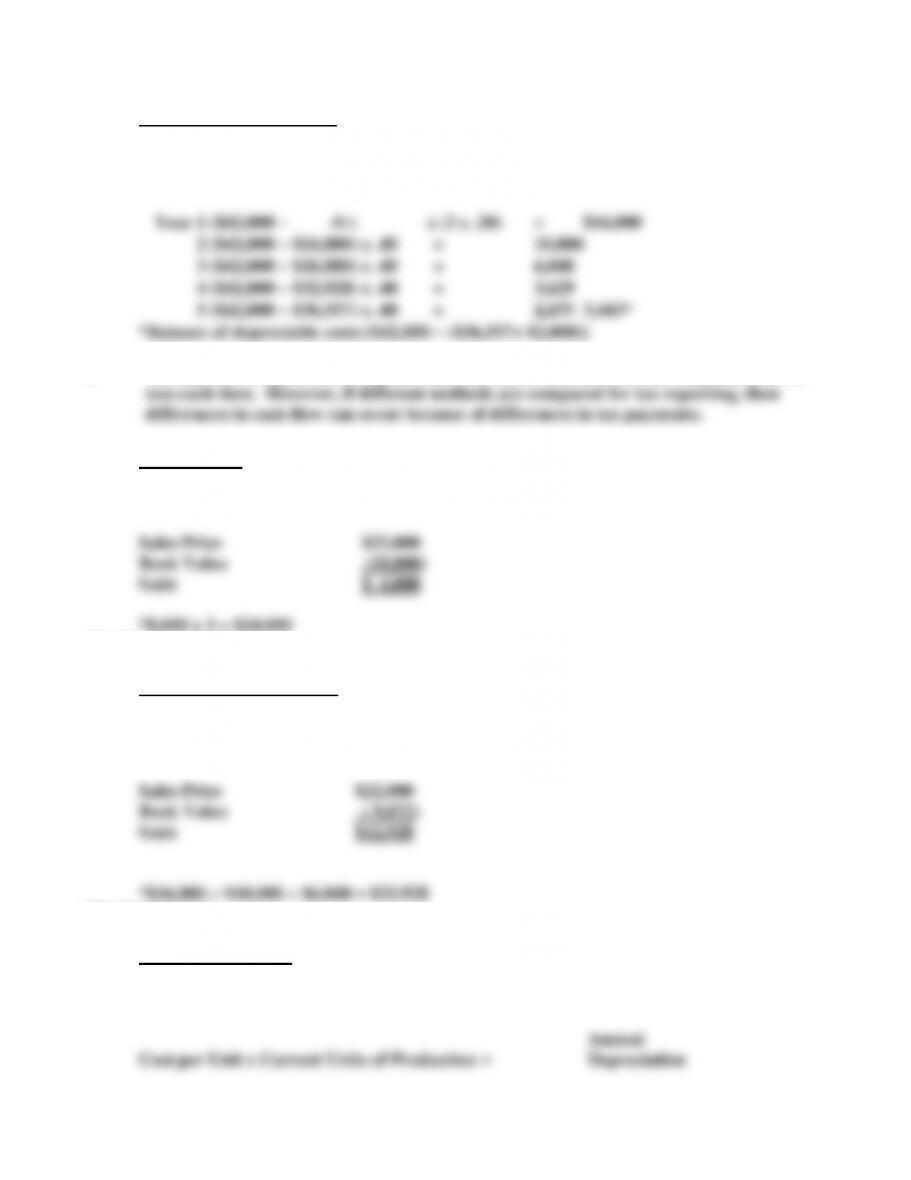
PROBLEM 6-26
a. Straight-Line
(Cost − Salvage Value) Useful Life = Annual Depreciation
Year 1 ($42,000 − 2,000) 5 = $8,000 per year
2 8,000
6-3
b. Double-Declining Balance
Accum. Depreciation Annual
(Cost − at Beginning of Period) x (2 x SL Rate) = Depreciation
c. The amount of depreciation expense does not affect cash flow because depreciation is a
d. Straight-Line
Book value $42,000 − $24,000* = $18,000
PROBLEM 6-26 d. (cont.)
Double-Declining-Balance
Book Value $42,000 − $32,928* = $9,072
PROBLEM 6-27
Units-of-Production
Total Estimated
(Cost − Salvage Value) Units of Production = Cost per Unit

6-4
a. $28,500 − $2,500
200,000 = $.13 per mile
6-5
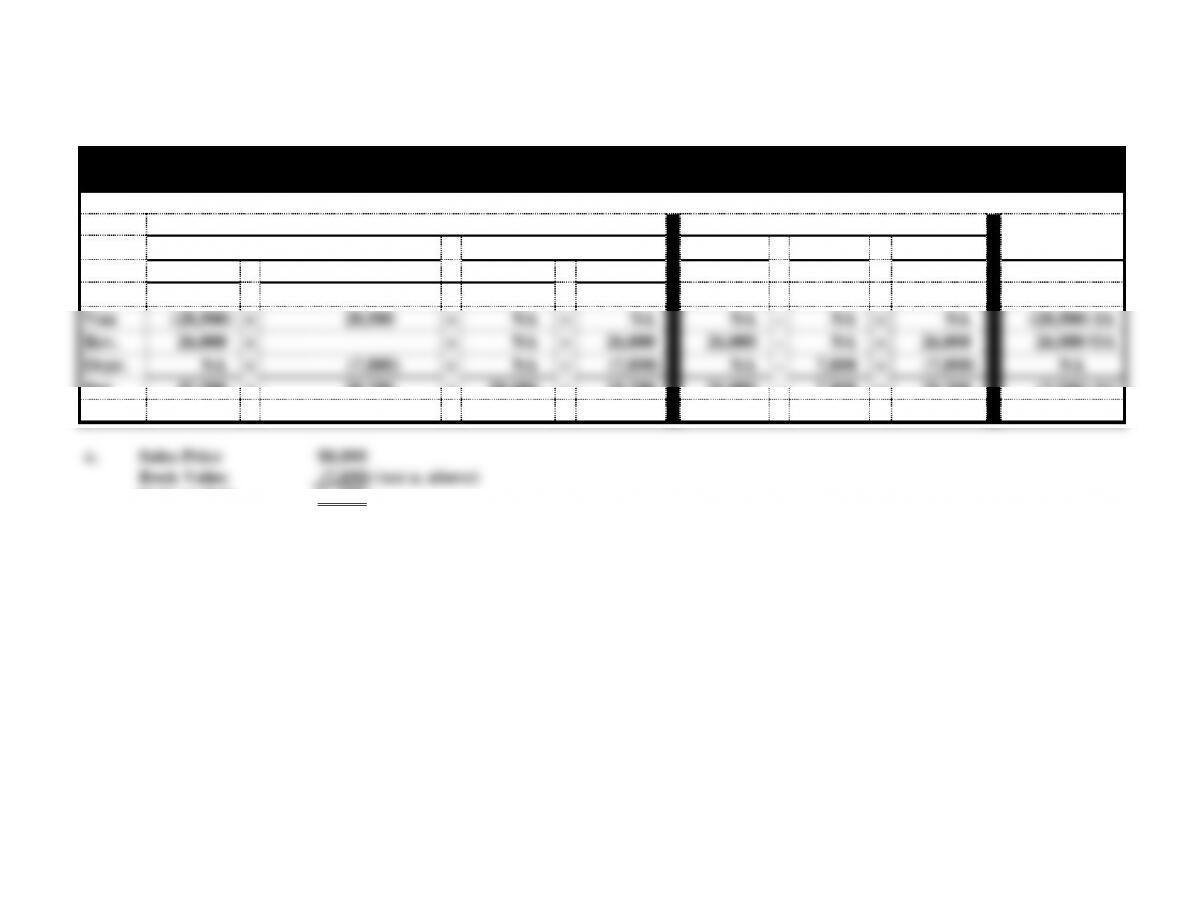
PROBLEM 6-27 (cont.)
b. NC = Net Change in Cash
Renner Corporation
Horizontal Statements Model
Balance Sheet
Income Statement
Statement of
Assets
=
Stockholders’ Equity
Rev.
−
Exp.
=
Net Inc.
Cash Flows
Event
Cash
+
Book Value of Van
=
C. Stock
+
Ret. Ear.
Bal.
50,000
+
=
50,000
+
NA
NA
−
NA
=
NA
NA
Van
(28,500)
+
28,500
=
NA
+
NA
NA
−
NA
=
NA
(28,500) IA
Rev.
26,000
+
=
NA
+
26,000
26,000
−
NA
=
26,000
26,000 OA
Depr.
NA
+
(7,800)
=
NA
+
(7,800)
NA
−
7,800
=
(7,800)
NA
Bal.
47,500
+
20,700
=
50,000
+
18,200
26,000
−
7,800
=
18,200
(2,500) NC
Gain on Sale $ 950
6-6
PROBLEM 6-28
a.
Engineering Solutions Inc. Horizontal Statements Model – 2014
Balance Sheet
Income Statement
Statemt. of
Assets
=
Equity
Rev.
−
Exp.
=
Net Inc.
Cash Flows
Event
2014
Cash
+
Equip.
−
A. Depr.
=
Com.
Stock
+
Ret.
Earn.
1.
80,000
NA
NA
80,000
NA
NA
NA
NA
80,000 FA
2.
(35,000)
35,000
NA
NA
NA
NA
NA
NA
(35,000) IA
3.
(2,450)
2,450
NA
NA
NA
NA
NA
NA
(2,450) IA
4.
65,000
NA
NA
NA
65,000
65,000
NA
65,000
65,000 OA
5.
(1,500)
NA
NA
NA
(1,500)
NA
1,500
(1,500)
(1,500) OA
6.
NA
NA
14,9801
NA
(14,980)
NA
14,980
(14,980)
NA
Bal.
106,050
+
37,450
−
14,980
=
80,000
+
48,520
65,000
16,480
48,520
106,050 NC
1($37,450) x (2 x .20) = $14,980
Engineering Solutions Inc. Horizontal Statements Model – 2015
Balance Sheet
Income Statement
Statemt. of
Assets
=
Equity
Rev.
−
Exp.
=
Net Inc.
Cash Flows
Event
2015
Cash
+
Equip.
−
A. Depr.
=
Com.
Stock
+
Ret.
Earn.
Bal.
106,050
37,450
14,980
80,000
48,520
1.
(1,000)
NA
NA
NA
(1,000)
NA
1,000
(1,000)
(1,000) OA
2.
(1,500)
NA
NA
NA
(1,500)
NA
1,500
(1,500)
(1,500) OA
3.
68,000
NA
NA
NA
68,000
68,000
NA
68,000
68,000 OA
4.
(1,500)
NA
NA
NA
(1,500)
NA
1,500
(1,500)
(1,500) OA
5.
NA
NA
8,9882
NA
(8,988)
NA
8,988
(8,988)
NA
Bal.
170,050
+
37,450
−
23,968
=
80,000
+
103,532
68,000
12,988
55,012
64,000 NC
2($37,450 − $14,980) x (2 x .20) = $8,988 depreciation for 2015
6-7
PROBLEM 6-28 (cont.)
Engineering Solutions Inc. Horizontal Statements Model – 2016
Balance Sheet
Income Statement
Statemt. of
Assets
=
Equity
Rev.
−
Exp.
=
Net Inc.
Cash Flows
Event
2014
Cash
+
Equip.
−
A. Depr.
=
Com.
Stock
+
Ret.
Earn.
Bal.
170,050
37,450
23,968
80,000
103,532
1.
(6,000)
NA
(6,000)
NA
NA
NA
NA
NA
(6,000) IA
2.
(1,200)
NA
NA
NA
(1,200)
NA
1,200
(1,200)
(1,200) OA
3.
70,000
NA
NA
NA
70,000
70,000
NA
70,000
70,000 OA
4.
NA
NA
9,7413
NA
(9,741)
NA
9,741
(9,741)
NA
Bal.
232,850
+
37,450
−
27,709
=
80,000
+
162,591
70,000
10,941
59,059
62,800 NC
3[$37,450 − ($23,968 − $6,000)] x (2 x .25) = $9,741 depreciation for 2016
6-8
PROBLEM 6-28 (cont.)
b.
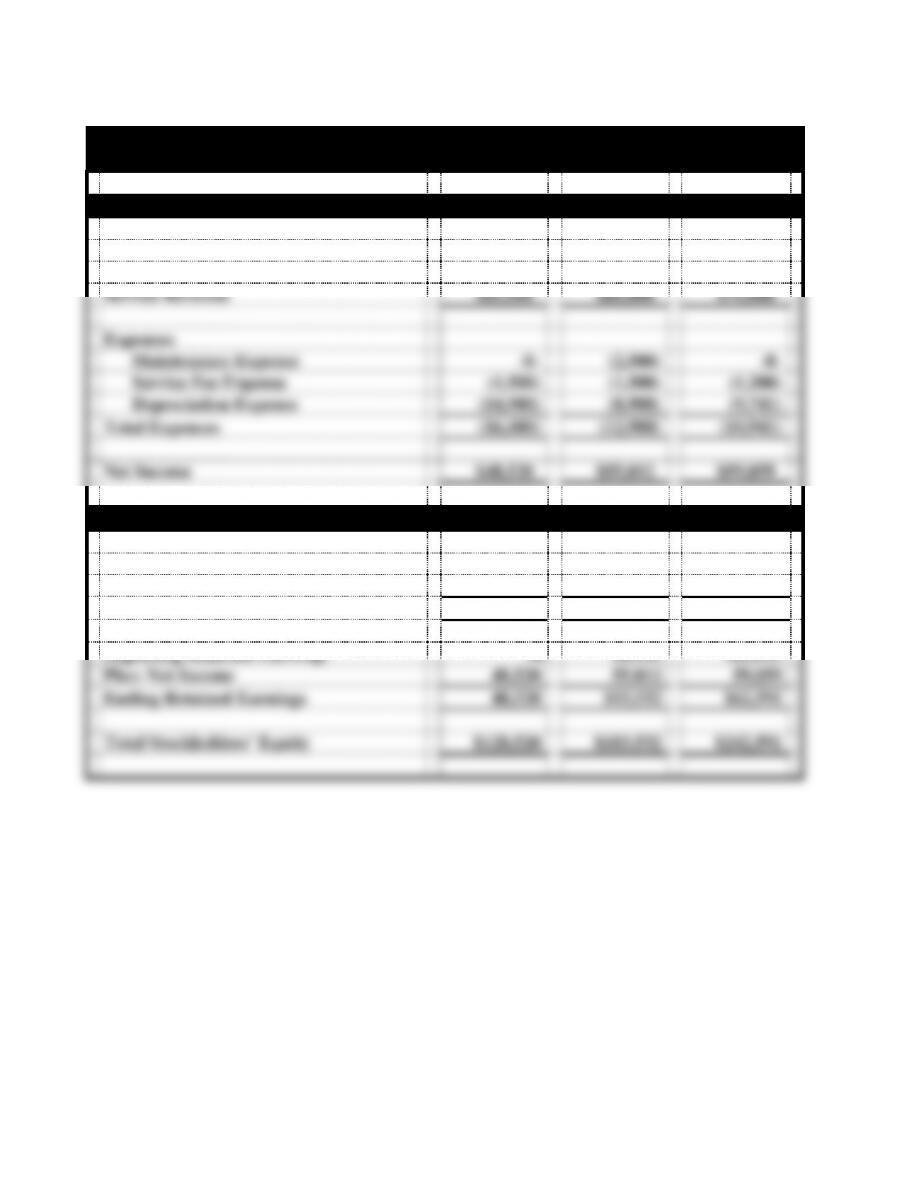
Engineering Solutions, Inc.
Financial Statements For the Year Ended December 31
Income Statements
2014
2015
2016
Service Revenue
$65,000
$68,000
$70,000
Expenses
Maintenance Expense
-0-
(2,500)
-0-
Service Fee Expense
(1,500)
(1,500)
(1,200)
Depreciation Expense
(14,980)
(8,988)
(9,741)
Total Expenses
(16,480)
(12,988)
(10,941)
Net Income
$48,520
$55,012
$59,059
Statements of Changes in Stockholders’ Equity
Beginning Common Stock
$ -0-
$80,000
$ 80,000
Plus: Stock Issued
80,000
-0-
-0-
Ending Common Stock
80,000
80,000
80,000
Beginning Retained Earnings
-0-
48,520
103,532
Plus: Net Income
48,520
55,012
59,059
Ending Retained Earnings
48,520
103,532
162,591
Total Stockholders’ Equity
$128,520
$183,532
$242,591
6-9
PROBLEM 6-28 b.(cont.)
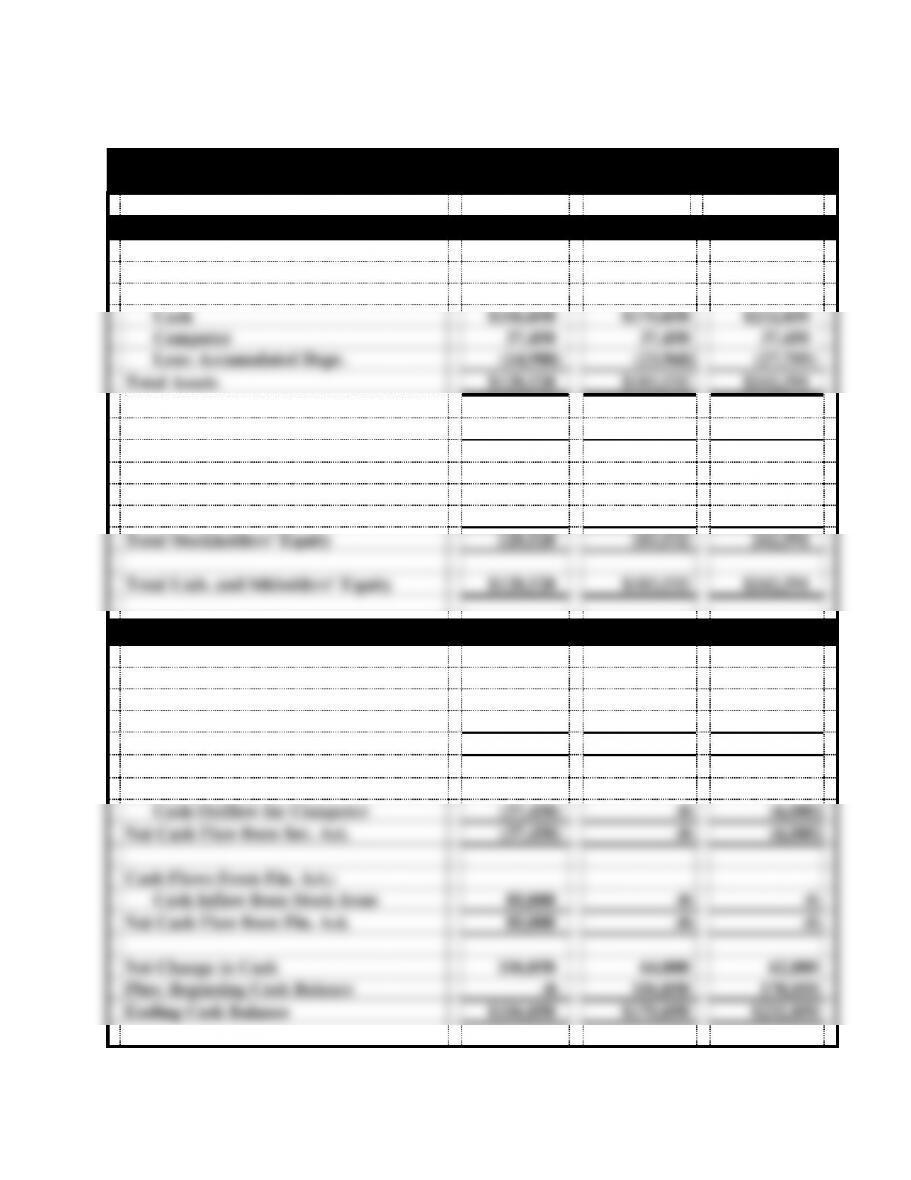
Engineering Solutions Inc.
Financial Statements
Balance Sheets
2014
2015
2016
Assets
Cash
$106,050
$170,050
$232,850
Computer
37,450
37,450
37,450
Less: Accumulated Depr.
(14,980)
(23,968)
(27,709)
Total Assets
$128,520
$183,532
$242,591
Liabilities
$ -0-
$ -0-
$ – 0-
Stockholders’ Equity
Common Stock
80,000
80,000
80,000
Retained Earnings
48,520
103,532
162,591
Total Stockholders’ Equity
128,520
183,532
242,591
Total Liab. and Stkholders’ Equity
$128,520
$183,532
$242,591
Statements of Cash Flows
Cash Flows From Oper. Act.:
Inflow from Revenue
$65,000
$68,000
$ 70,000
Outflow for Expenses
(1,500)
(4,000)
(1,200)
Net Cash Flow from Oper. Act.
63,500
64,000
68,800
Cash Flows From Inv. Act.:
Cash Outflow for Computer
(37,450)
-0-
(6,000)
Net Cash Flow from Inv. Act.
(37,450)
-0-
(6,000)
Cash Flows From Fin. Act.:
Cash Inflow from Stock Issue
80,000
-0-
-0-
Net Cash Flow from Fin. Act.
80,000
-0-
-0-
Net Change in Cash
106,050
64,000
62,800
Plus: Beginning Cash Balance
-0-
106,050
170,050
Ending Cash Balance
$106,050
$170,050
$232,850
6-10
PROBLEM 6-29
a.
Horizontal Statements Model
Date
Assets
=
Liab.
+
Equity
Net Income
Cash Flows
1/1/14
+−
NA
NA
NA
− IA
12/31/14
−
NA
−
−
NA
5/5/15
−
NA
−
−
− OA
12/31/15
−
NA
−
−
NA
1/1/16
+−
NA
NA
NA
− IA
12/31/16
−
NA
−
−
NA
3/1/17
−
NA
−
−
− OA
12/31/17
−
NA
−
−
NA
1/1/18
+−
NA
NA
NA
− IA
12/31/18
−
NA
−
−
NA
7/1/19*
−
NA
−
−
NA
7/1/19**
+
NA
+
+
+ IA
*To record depreciation for 2019.
**To record sale of asset. The plus in the assets column represents the net increase in
assets resulting from the sale of the equipment. Cash increases by a greater amount than
the decrease in the book value of the equipment.
b.
Year
Computation
Depr. Exp.
2014
($38,000 − $3,000) 5
$7,000
2015
Same as 2013
7,000
2016
($38,000 + $4,000 − $14,000 − $3,000) 3
8,333*
2017
Same as 2015
8,333*
2018
($42,000 − $2,500 − $21,666** acc. depr.) 3
5,945*
**30,666 − $9,000 overhaul = $21,666
6-11
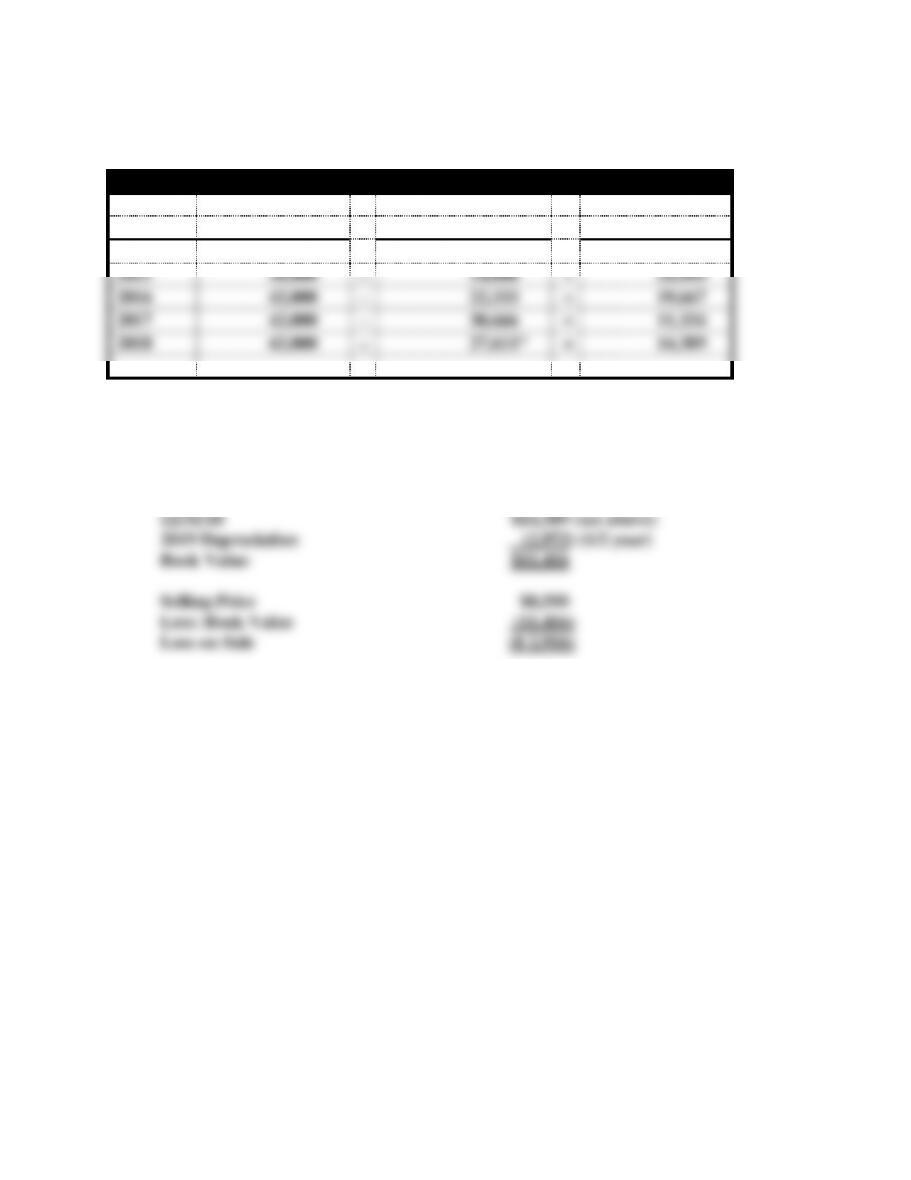
PROBLEM 6-29 (cont.)
c.
Computation of Book Value
Year
Cost
−
Acc. Depr.
=
Book Value
2014
$38,000
−
$7,000
=
$31,000
2015
38,000
−
14,000
=
24,000
2016
42,000
−
22,333
=
19,667
2017
42,000
−
30,666
=
11,334
2018
42,000
−
27,611*
=
14,389
*$30,666 − $9,000 overhaul + $5,945 depreciation expense.
d. Computation of Depreciation Expense for 2019:
$5,945 x 6/12 = $2,973
Book Value at Date of Sale: