Unlock document.
This document is partially blurred.
Unlock all pages and 1 million more documents.
Get Access
3-1
PROBLEM 3-23 (cont.)
b. & c.
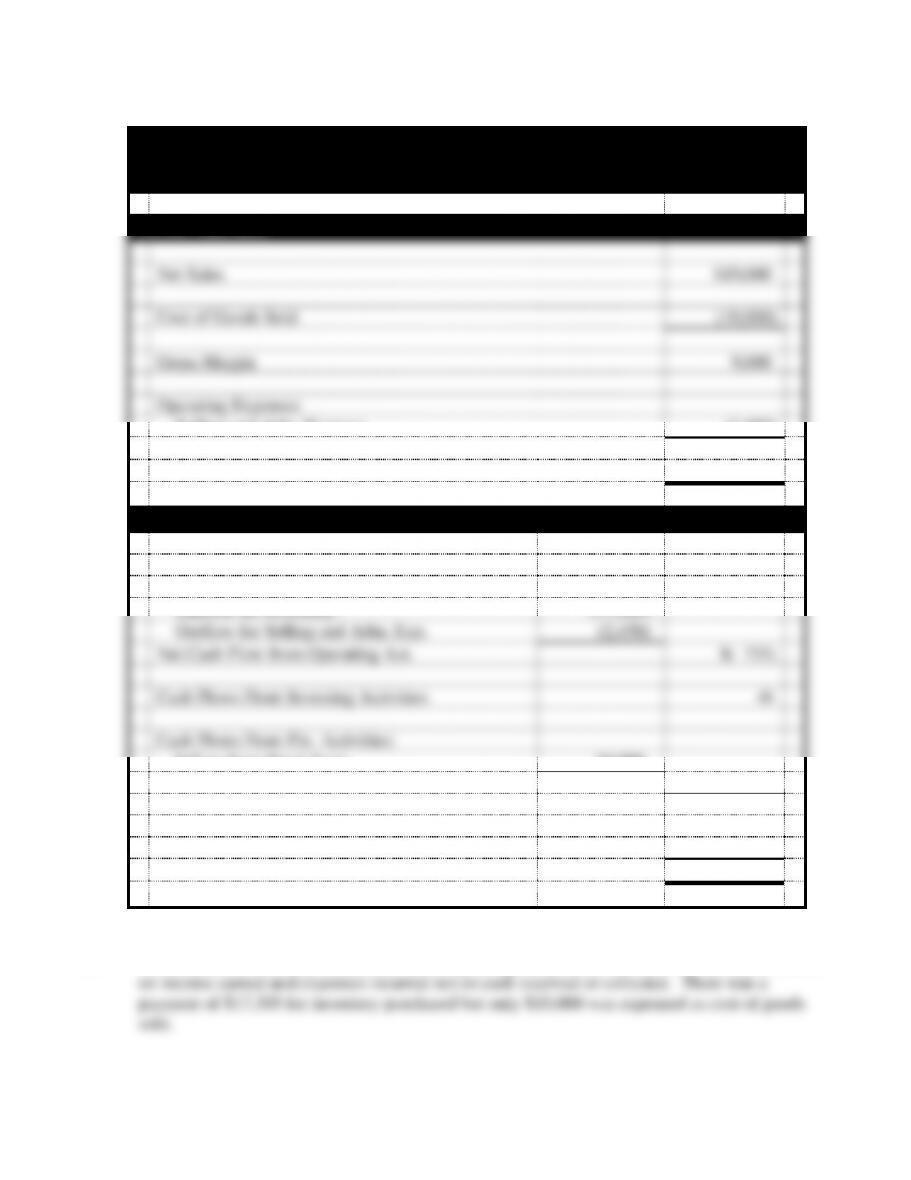
Yang’s Imports
Financial Statements
For the Month Ended September 30, 2014
Income Statement
Net Sales
$19,000
Cost of Goods Sold
(10,000)
Gross Margin
9,000
Operating Expenses
Selling and Adm. Expense
(2,450)
Net Income
$ 6,550
Statement of Cash Flows
Cash Flows From Oper. Activities:
Inflow from Customers
$19,000
Outflow for Inventory*
(17,305)
Outflow for Selling and Adm. Exp.
(2,450)
Net Cash Flow from Operating Act.
$( 755)
Cash Flows From Investing Activities
-0-
Cash Flows From Fin. Activities:
Inflow from Stock Issue
30,000
Net Cash Flow from Financing Act.
30,000
Net Change in Cash
29,245
Plus: Beginning Cash Balance
-0-
Ending Cash Balance
$29,245
*$16,905 + $400 = $17,305
d. Net income is $6,550 and Cash Flow from Operating Activities is ($755). Net income is based
3-2
PROBLEM 3-24 (Appendix)
a.
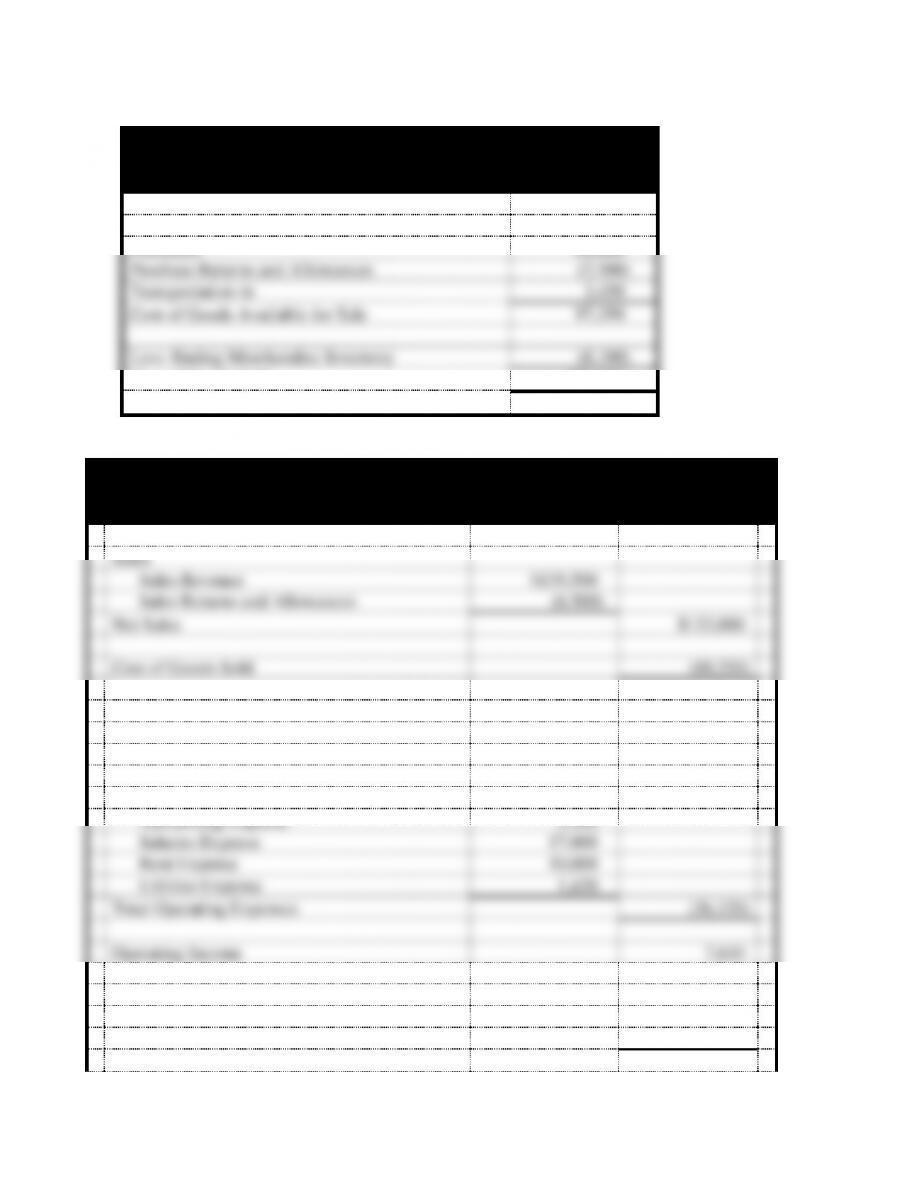
Omar Farm Co.
Schedule of Cost of Goods Sold
For the Year Ended December 31, 2014
Beginning Merchandise Inventory
$12,400
Purchases
84,000
Purchase Returns and Allowances
(2,500)
Transportation-in
3,450
Cost of Goods Available for Sale
97,350
Less: Ending Merchandise Inventory
(8,100)
Cost of Goods Sold
$89,250
PROBLEM 3-24 (cont.) (Appendix)
b.
Omar Farm Co.
Income Statement
For the Year Ended December 31, 2014
Sales
Sales Revenue
$139,500
Sales Returns and Allowances
(6,500)
Net Sales
$133,000
Cost of Goods Sold
(89,250)
Gross Margin
43,750
Operating Expenses
Miscellaneous Expense
800
Transportation-out
1,400
Advertising Expense
5,500
Salaries Expense
17,000
Rent Expense
10,000
Utilities Expense
1,420
Total Operating Expenses
(36,120)
Operating Income
7,630
Non-Operating Items
Interest Expense
(720)
Loss on Sale of Land
(6,800)
3-3
Net Income
$ 110
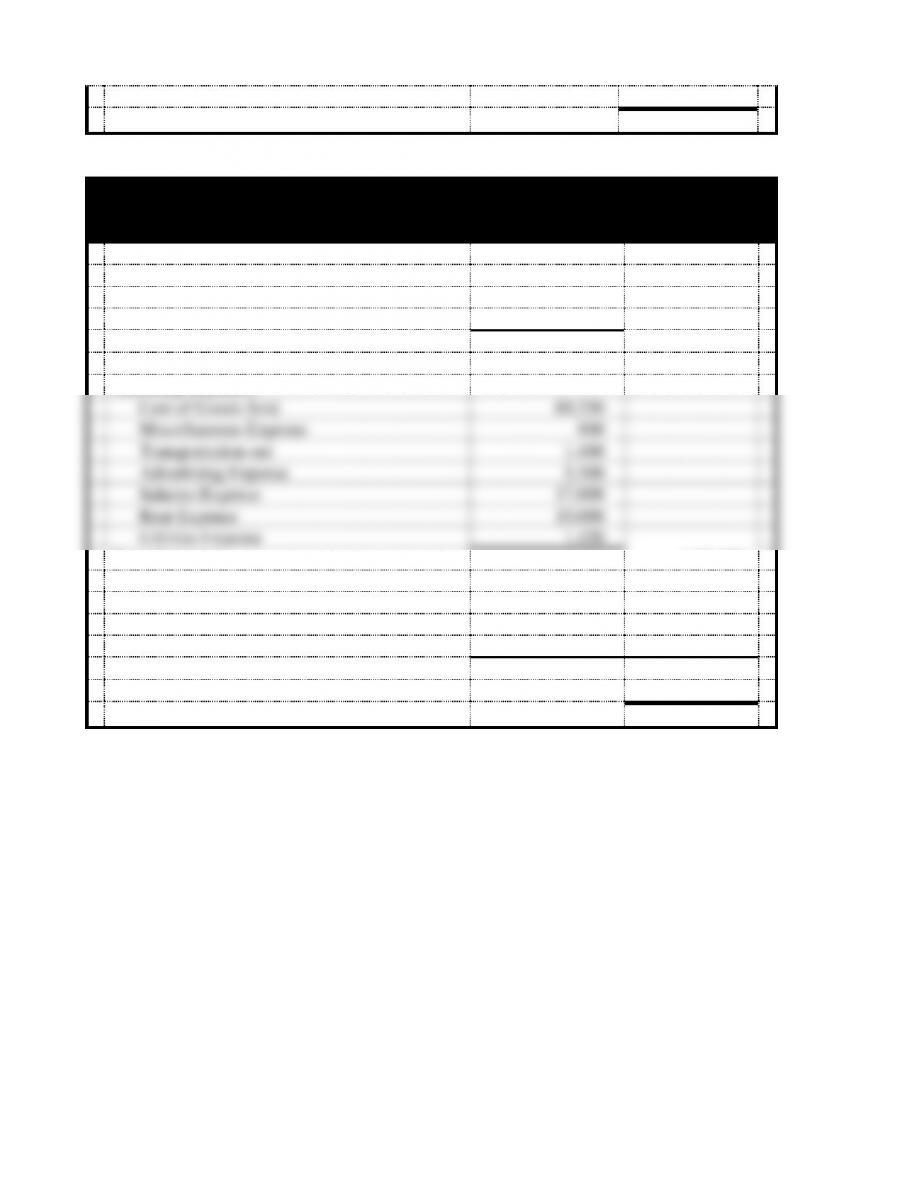
PROBLEM 3-24 (cont.) (Appendix)
c.
Omar Farm Co.
Income Statement
For the Year Ended December 31, 2014
Sales
Sales Revenue
$139,500
Sales Returns and Allowances
(6,500)
Net Sales
$133,000
Operating Expenses
Cost of Goods Sold
89,250
Miscellaneous Expense
800
Transportation-out
1,400
Advertising Expense
5,500
Salaries Expense
17,000
Rent Expense
10,000
Utilities Expense
1,420
Total Expenses
(125,370)
Nonoperating Items
Interest Expense
720
Loss on Sale of Land
6,800
(7,520)
Net Income
$ 110
3-4
PROBLEM 3-25
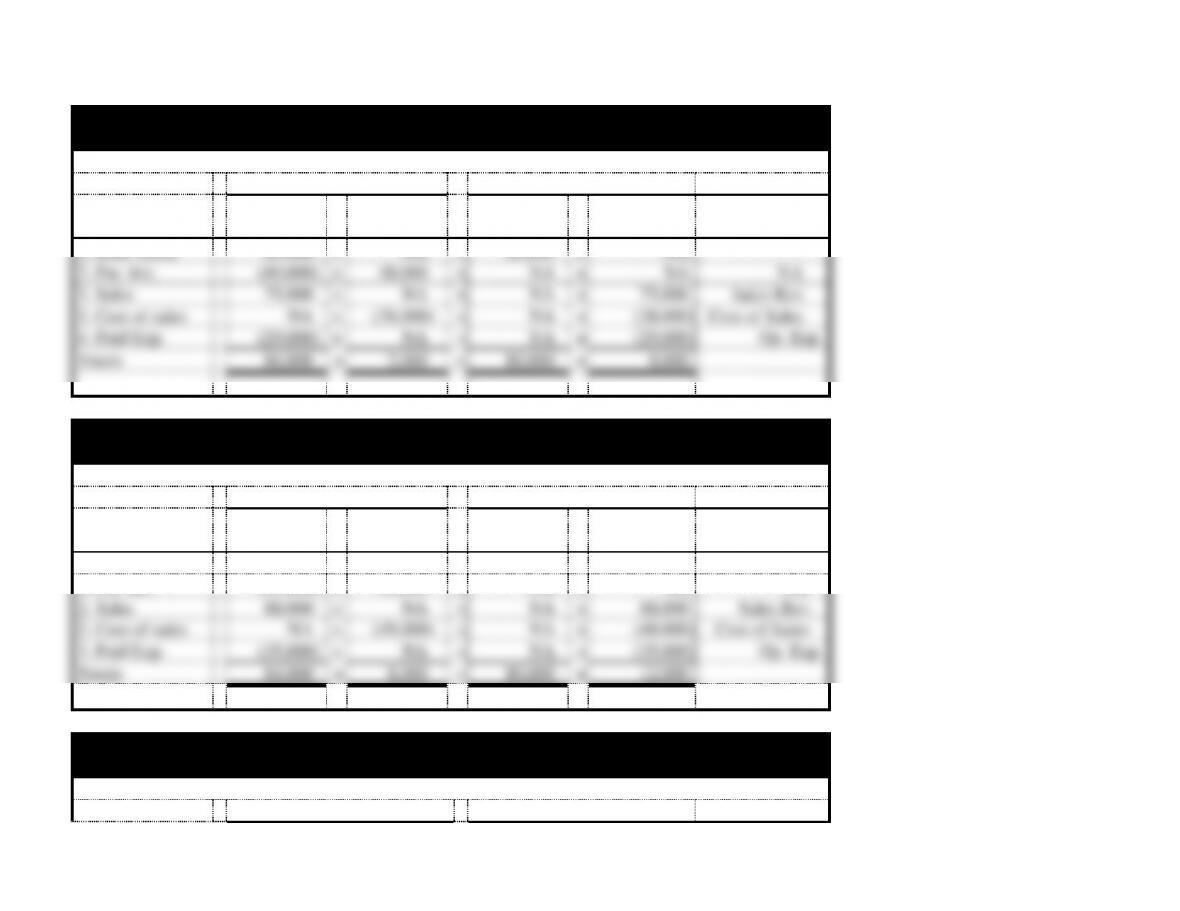
Amber’s Flower Company
Accounting Equation for 2014
Assets
=
Stockholders’ Equity
Event
Cash
+
Mdse. Inv.
=
Common
Stock
+
Retained
Earnings
Acct.
Title/RE
1. Issue Stock
80,000
+
NA
=
80,000
+
NA
2. Pur. Inv.
(40,000)
+
40,000
=
NA
+
NA
NA
3. Sales
75,000
+
NA
=
NA
+
75,000
Sales Rev.
3. Cost of sales
NA
+
(38,000)
=
NA
+
(38,000)
Cost of Sales
4. Paid Exp.
(29,000)
+
NA
=
NA
+
(29,000)
Op. Exp.
Totals
86,000
+
2,000
=
80,000
+
8,000
Amber’s Flower Company
Accounting Equation for 2015
Assets
=
Stockholders’ Equity
Event
Cash
+
Mdse. Inv.
=
Common
Stock
+
Retained
Earnings
Acct.
Title/RE
Beg. Bal
86,000
+
2,000
=
80,000
+
8,000
1. Pur. Inv.
(55,000)
+
55,000
=
NA
+
NA
NA
2. Sales
88,000
+
NA
=
NA
+
88,000
Sales Rev.
2. Cost of sales
NA
+
(49,000)
=
NA
+
(49,000)
Cost of Sales
3. Paid Exp.
(35,000)
+
NA
=
NA
+
(35,000)
Op. Exp.
Totals
84,000
+
8,000
=
80,000
+
12,000
Amber’s Flower Company
Accounting Equation for 2016
Assets
=
Stockholders’ Equity
3-5
Event
Cash
+
Mdse. Inv.
=
Common
Stock
+
Retained
Earnings
Acct.
Title/RE
Beg. Bal
84,000
+
8,000
=
80,000
+
12,000
1. Pur. Inv.
(95,000)
+
95,000
=
NA
+
NA
NA
2. Sales
146,000
+
NA
=
NA
+
146,000
Sales Rev.
2. Cost of sales
NA
+
(82,000)
=
NA
+
(82,000)
Cost of Sales
3. Paid Exp.
(42,000)
+
NA
=
NA
+
(42,000)
Op. Exp.
Totals
93,000
+
21,000
=
80,000
+
34,000
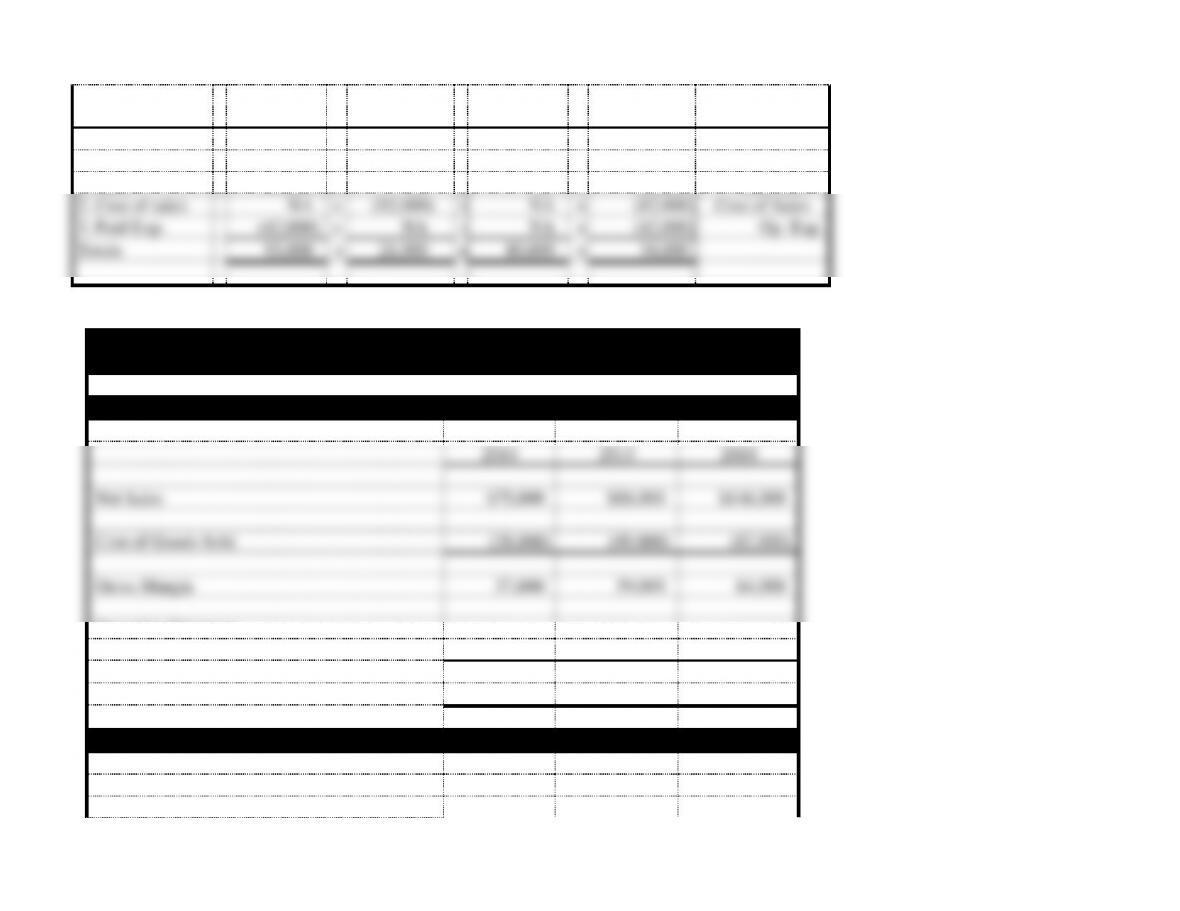
PROBLEM 3-25 (cont.)
Amber’s Flower Company
Financial Statements
Income Statements for the Year Ended December 31
2014
2015
2016
Net Sales
$75,000
$88,000
$146,000
Cost of Goods Sold
(38,000)
(49,000)
(82,000)
Gross Margin
37,000
39,000
64,000
Operating Expenses
Selling and Admin. Expense
(29,000)
(35,000)
(42,000)
Net Income
$ 8,000
$ 4,000
$22,000
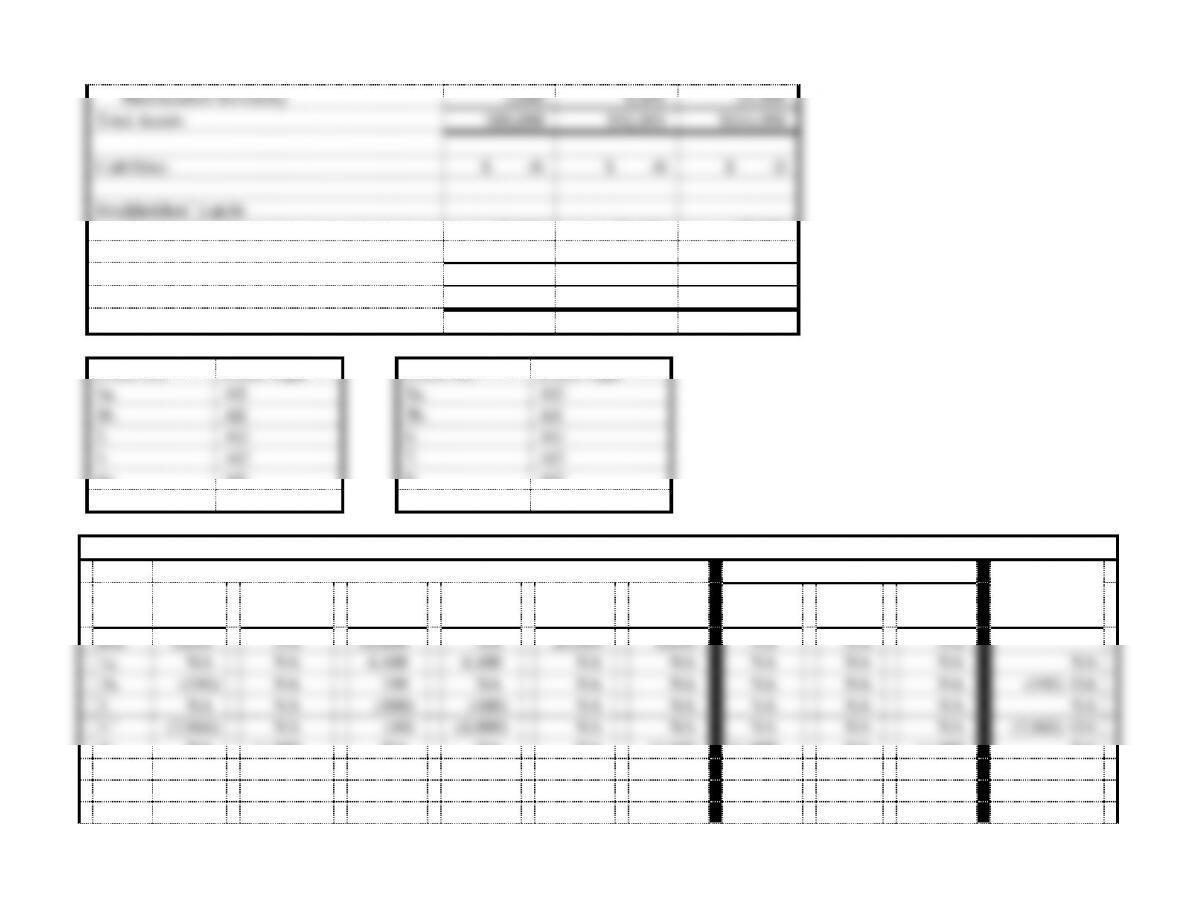
Balance Sheets at December 31
Assets
Cash
$86,000
$84,000
$ 93,000
3-6
Merchandise Inventory
2,000
8,000
21,000
Total Assets
$88,000
$92,000
$114,000
Liabilities
$ -0-
$ -0-
$ -0-
Stockholders’ Equity
Common Stock
80,000
80,000
80,000
Retained Earnings
8,000
12,000
34,000
Total Stockholders’ Equity
88,000
92,000
114,000
Total Liab. and Stkholders’ Equity
$88,000
$92,000
$114,000
PROBLEM 3-26 a.
Event No.
Event Type
Event No.
Event Type
1a.
AS
5a.
AU
1b.
AE
5b.
AS
2.
AU
6.
AU
3.
AU
7.
AU
4a.
AS
8.
AU
4b.
AU
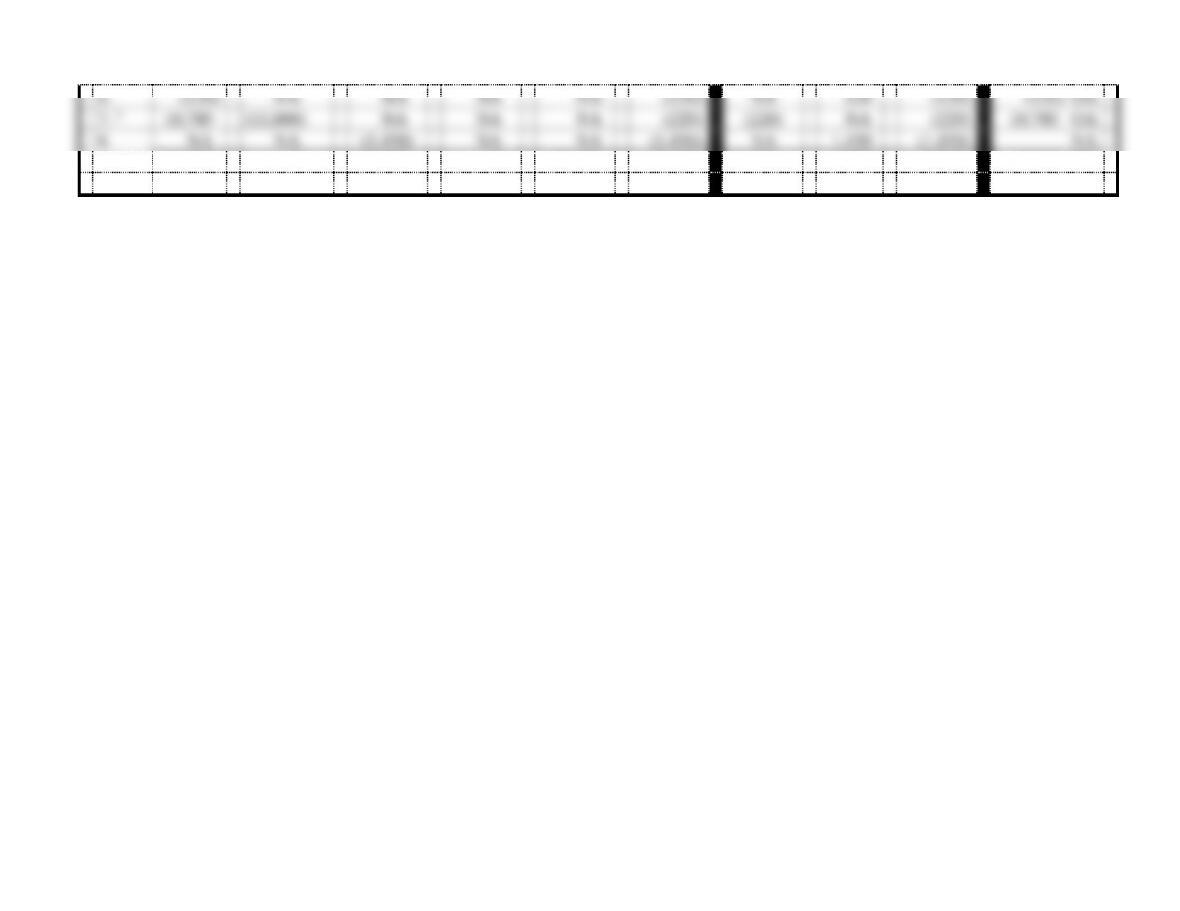
b.
Bradley Company Horizontal Statements Model - 2014
Balance Sheet
Income Statement
Statement
Event
No.
Cash
+
Accts. Rec.
+
Mdse.
Inv.
=
Accts.
Pay
+
Comm
Stock
+
Ret.
Earn.
Rev.
−
Exp.
=
Net Inc.
Of Cash
Flows
Bal.
8,600
NA
18,000
NA
20,000
6,600
NA
NA
NA
1a.
NA
NA
4,400
4,400
NA
NA
NA
NA
NA
NA
1b.
(190)
NA
190
NA
NA
NA
NA
NA
NA
(190) OA
2.
NA
NA
(400)
(400)
NA
NA
NA
NA
NA
NA
3.1
(3,960)
NA
(40)
(4,000)
NA
NA
NA
NA
NA
(3,960) OA
4a.
NA
11,000
NA
NA
NA
11,000
11,000
NA
11,000
NA
4b.
NA
NA
(6,000)
NA
NA
(6,000)
NA
6,000
(6,000)
NA
5a.
(1,450)
NA
NA
NA
NA
(1,450)
(1,450)
NA
(1,450)
(1,450) OA
5b.
NA
NA
800
NA
NA
800
NA
(800)
800
NA
3-7
6.
(120)
NA
NA
NA
NA
(120)
NA
120
(120)
(120) OA
7. 2
10,780
(11,000)
NA
NA
NA
(220)
(220)
NA
(220)
10,780 OA
8.
NA
NA
(1,450)
NA
NA
(1,450)
NA
1,450
(1,450)
NA
Bal.
13,660
-0-
15,500
-0-
20,000
9,160
9,330
6,770
2,560
5,060 NC
1$4,400 − $400 = $4,000; $4,000 x .99 = $3,960, the amount of cash paid. Discount taken: $4,000 x 1% = $40.
2$11,000 x .98 = $10,780, the amount of cash received. Discount given: $11,000 x 2% = $220.
3-8
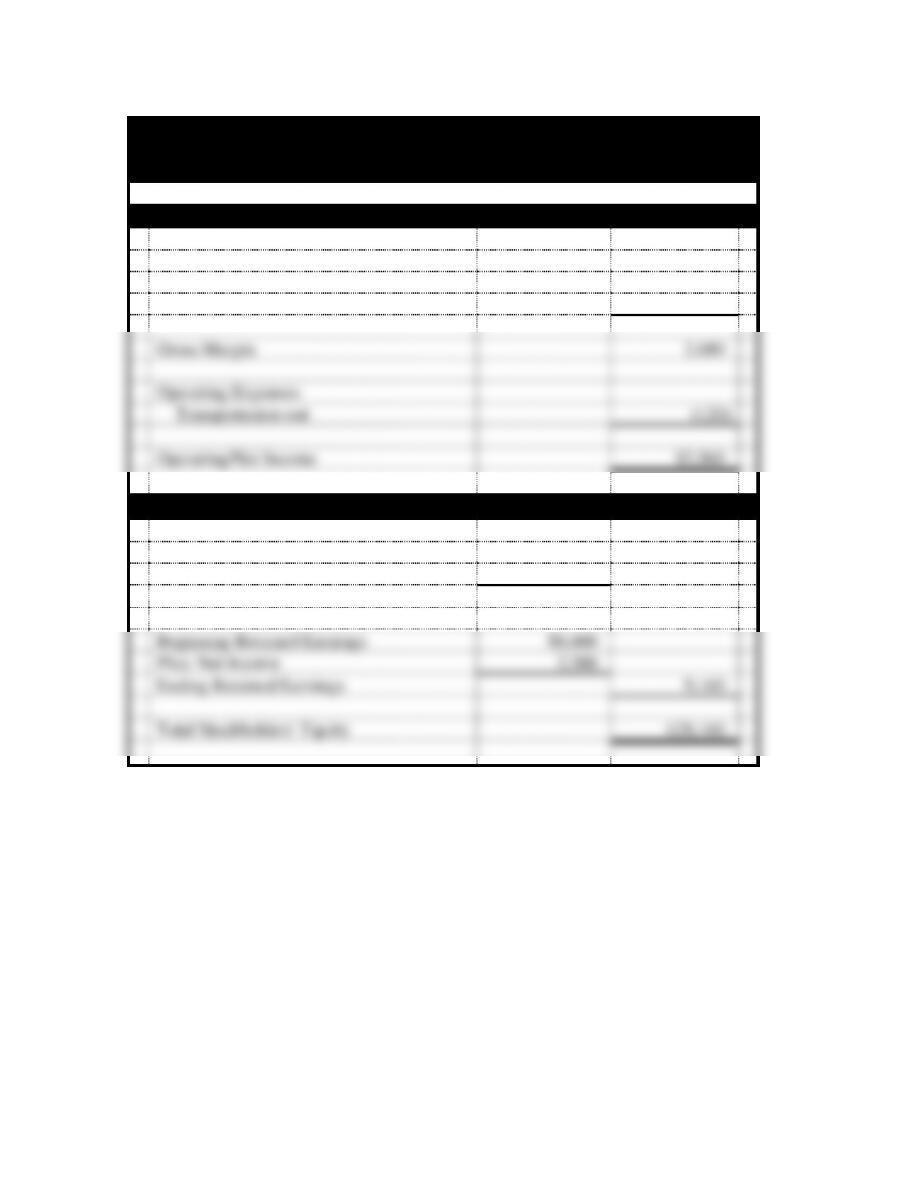
PROBLEM 3-26
c.
Bradley Company
Financial Statements
For the Year Ended December 31, 2014
Income Statement
Net Sales
$9,330
Cost of Goods Sold
(6,650)
Gross Margin
2,680
Operating Expenses
Transportation-out
(120)
Operating/Net Income
$2,560
Statement of Changes in Stockholders’ Equity
Beginning Common Stock
$20,000
Plus: Stock Issued
-0-
Ending Common Stock
$20,000
Beginning Retained Earnings
$6,600
Plus: Net Income
2,560
Ending Retained Earnings
9,160
Total Stockholders’ Equity
$29,160
3-9
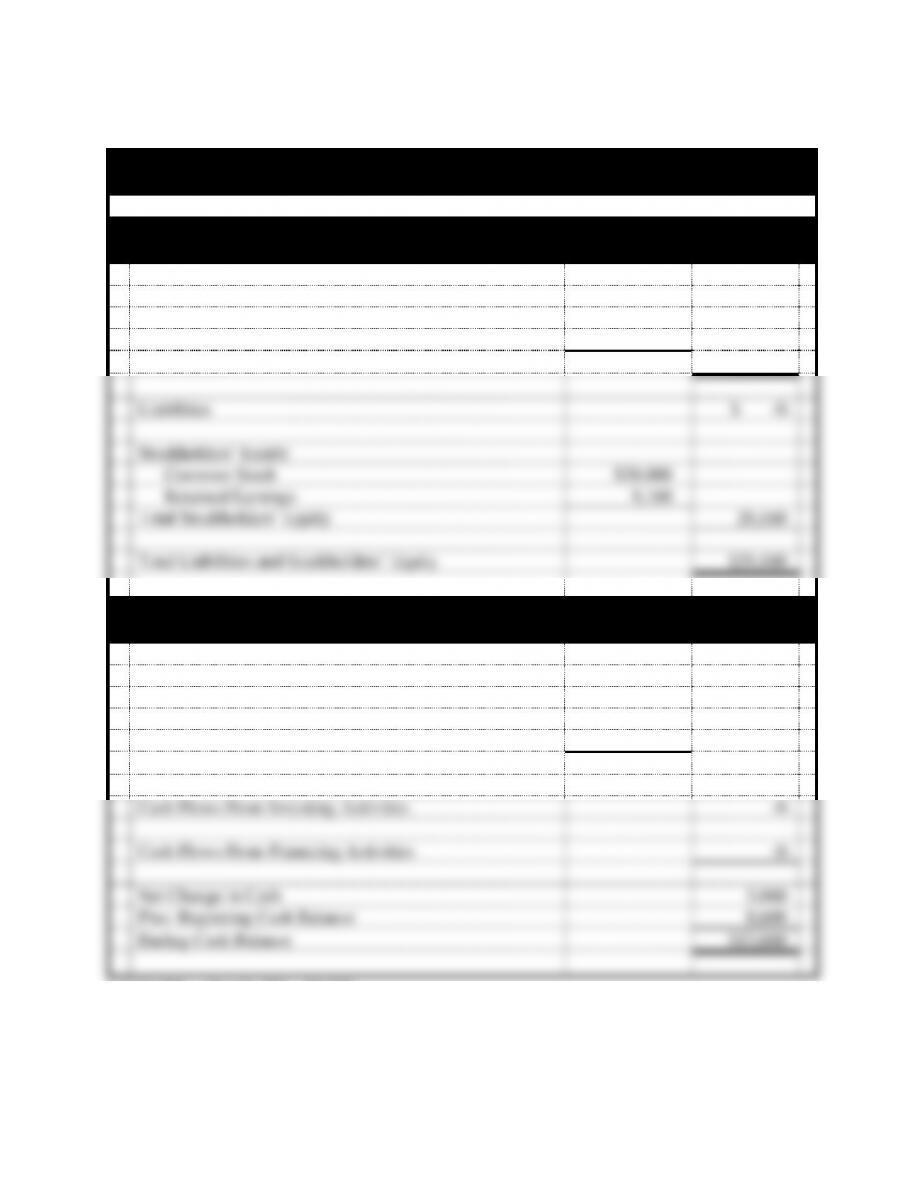
PROBLEM 3-26 c. (cont.)
Bradley Company
Financial Statements
Balance Sheet
As of December 31, 2014
Assets
Cash
$ 13,660
Merchandise Inventory
15,500
Total Assets
$29,160
Liabilities
$ -0-
Stockholders’ Equity
Common Stock
$20,000
Retained Earnings
9,160
Total Stockholders’ Equity
29,160
Total Liabilities and Stockholders’ Equity
$29,160
Statement of Cash Flows
For the Year Ended December 31, 2014
Cash Flows From Operating Activities:
Inflow from Customers*
$9,330
Outflow for Inventory**
(4,150)
Outflow for Expenses
(120)
Net Cash Flow from Operating Activities
$5,060
Cash Flows From Investing Activities
-0-
Cash Flows From Financing Activities
-0-
Net Change in Cash
5,060
Plus: Beginning Cash Balance
8,600
Ending Cash Balance
$13,660
*(7)10,780 – (5a) $1,450 = $9,330
**(1b) $190 + (3) $3,960 = $4,150
3-10
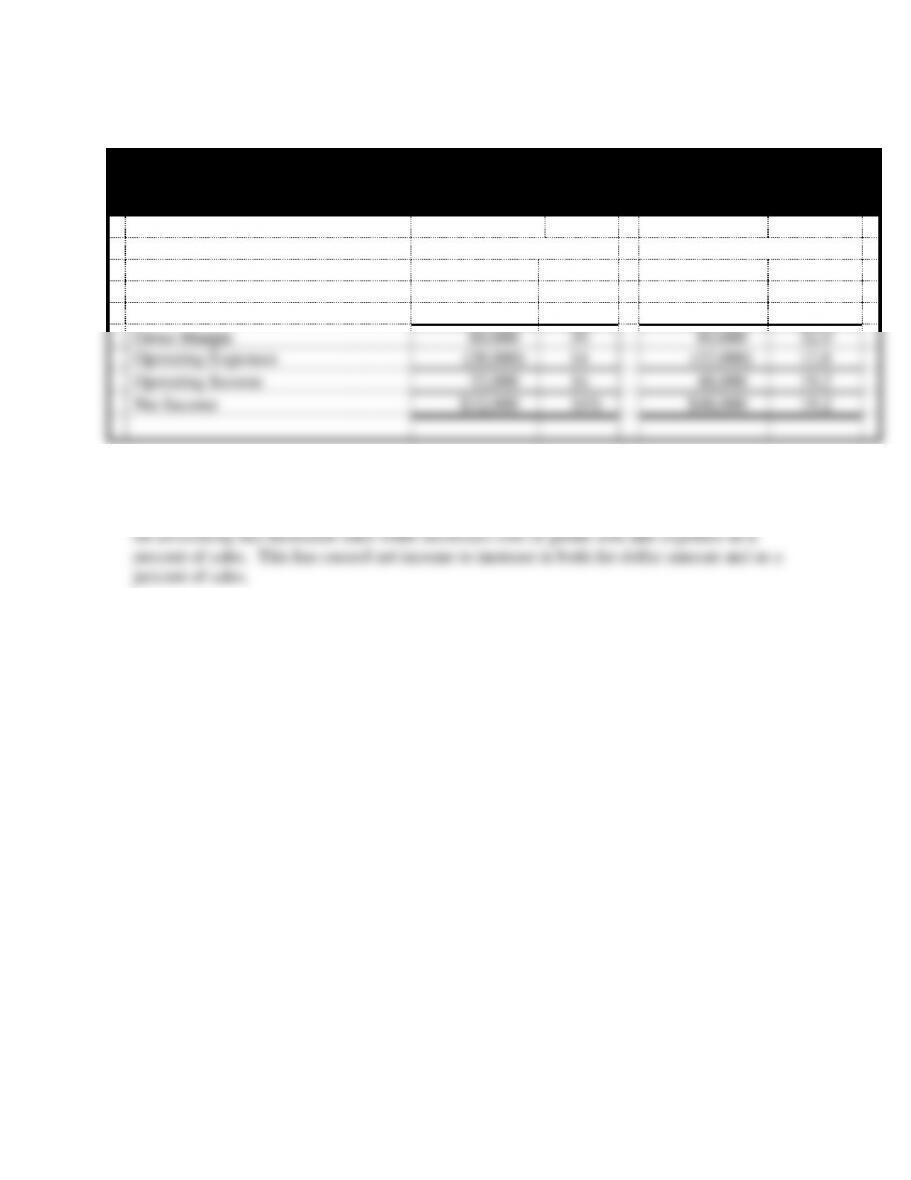
PROBLEM 3-27
Harper Sales Company
Income Statement
For the Years Ended December 31, 2014 and 2015
2014
2015
Net Sales
$200,000
100%
$250,000
100%
Cost of Goods Sold
(140,000)
70
(170,000)
68.0
Gross Margin
60,000
30
80,000
32.0
Operating Expenses
(28,000)
14
(32,000)
12.8
Operating Income
32,000
16
48,000
19.2
Net Income
$32,000
16%
$48,000
19.2
Sales have risen while cost of goods sold as a percent of sales has declined. Operating
expense increased, but not as a percentage of sales. So, it appears that spending a little more


