Unlock document.
This document is partially blurred.
Unlock all pages and 1 million more documents.
Get Access
Chapter 16 Planning for Capital Investments
16-1
must sit idle, then Alternative 2 may be the better option if Speedy Delivery actually has that
much money. The information provided is insufficient to determine which the better
alternative is.
Problem 16-17
a.
Cash Inflows
Table Value*
Present Value
Year 1
$ 84,000
x
0.934579
=
$ 78,505
Year 2
96,000
x
0.873439
=
83,850
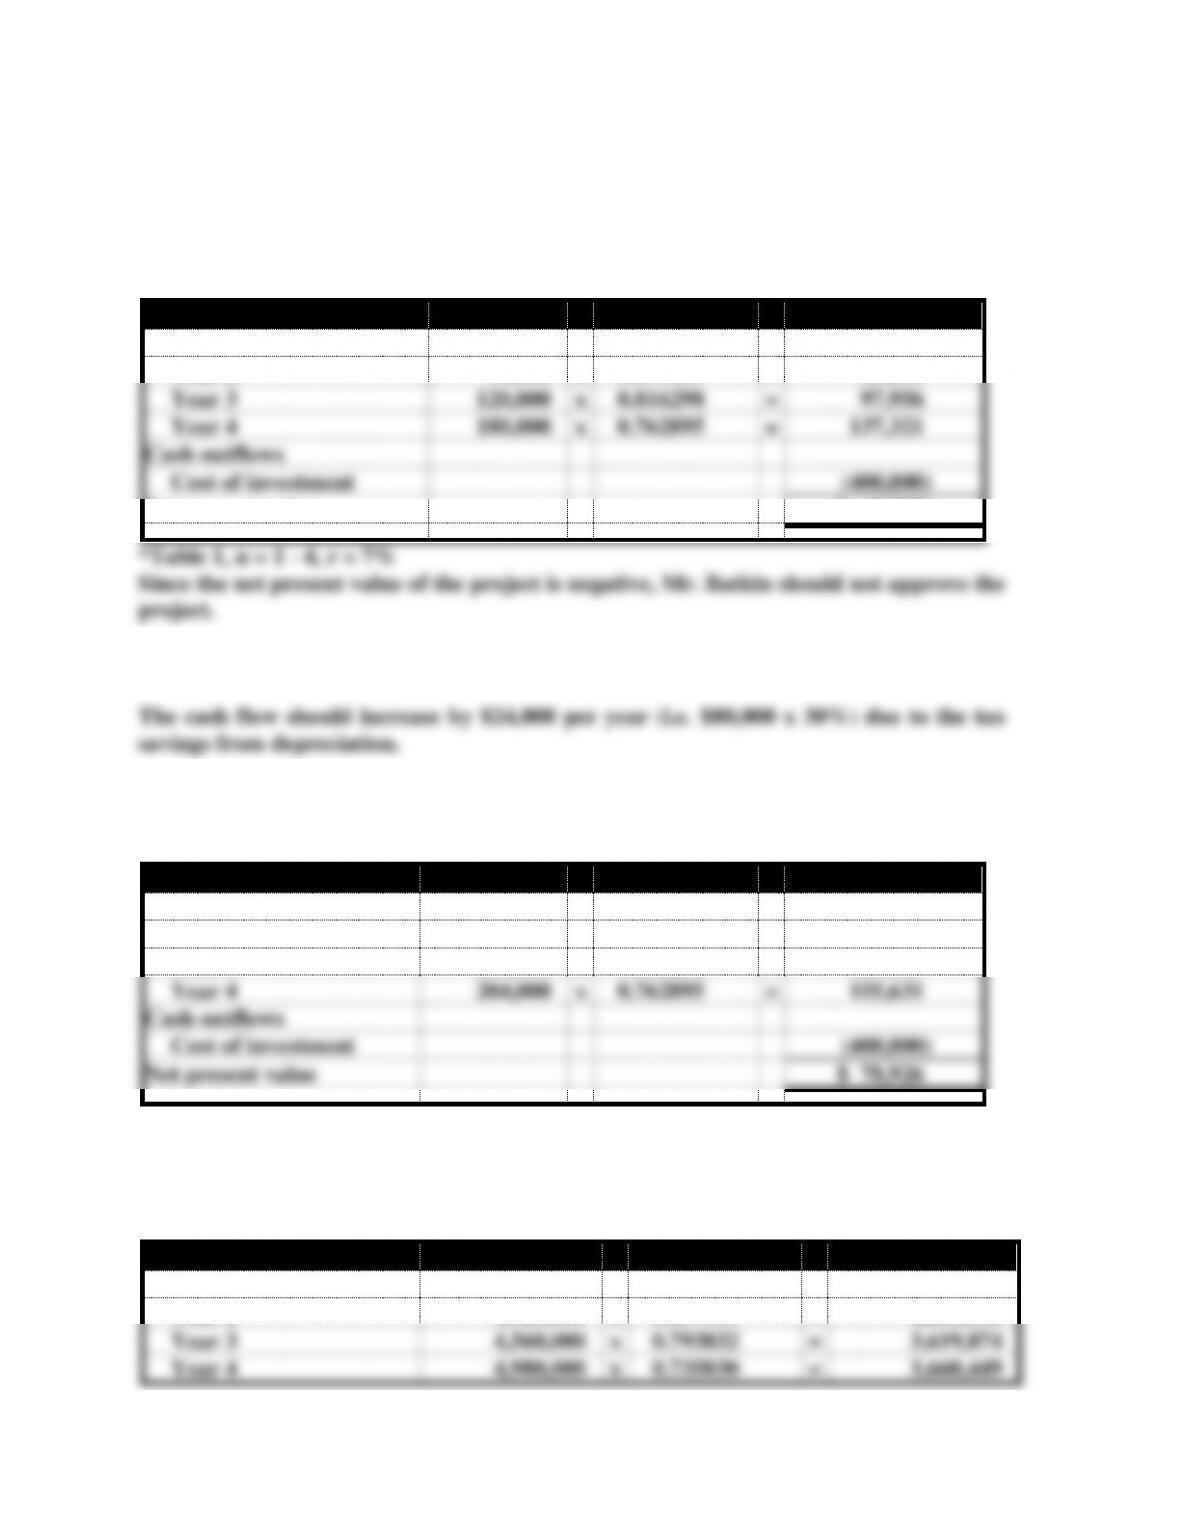
Year 3
120,000
x
0.816298
=
97,956
Year 4
180,000
x
0.762895
=
137,321
Cash outflows
Cost of investment
(400,000)
Net present value
$ (2,368)
b. & c.
The revised cash flow forecast and the net present value computation should be as
follows:
Cash Inflows
Table Value
Present Value
Year 1
$108,000
x
0.934579
=
$ 100,935
Year 2
120,000
x
0.873439
=
104,813
Year 3
144,000
x
0.816298
=
117,547
Year 4
204,000
x
0.762895
=
155,631
Cash outflows
Cost of investment
(400,000)
Net present value
$ 78,926
Since the net present value with the revised cash flow is positive, Mr. Batkin should
approve the project.
Problem 16-18
a.
Cash Inflows
Table Value*
Present Value
Year 1
$3,300,000
x
0.925926
=
$ 3,055,556
Year 2
4,920,000
x
0.857339
=
4,218,108
Year 3
4,560,000
x
0.793832
=
3,619,874
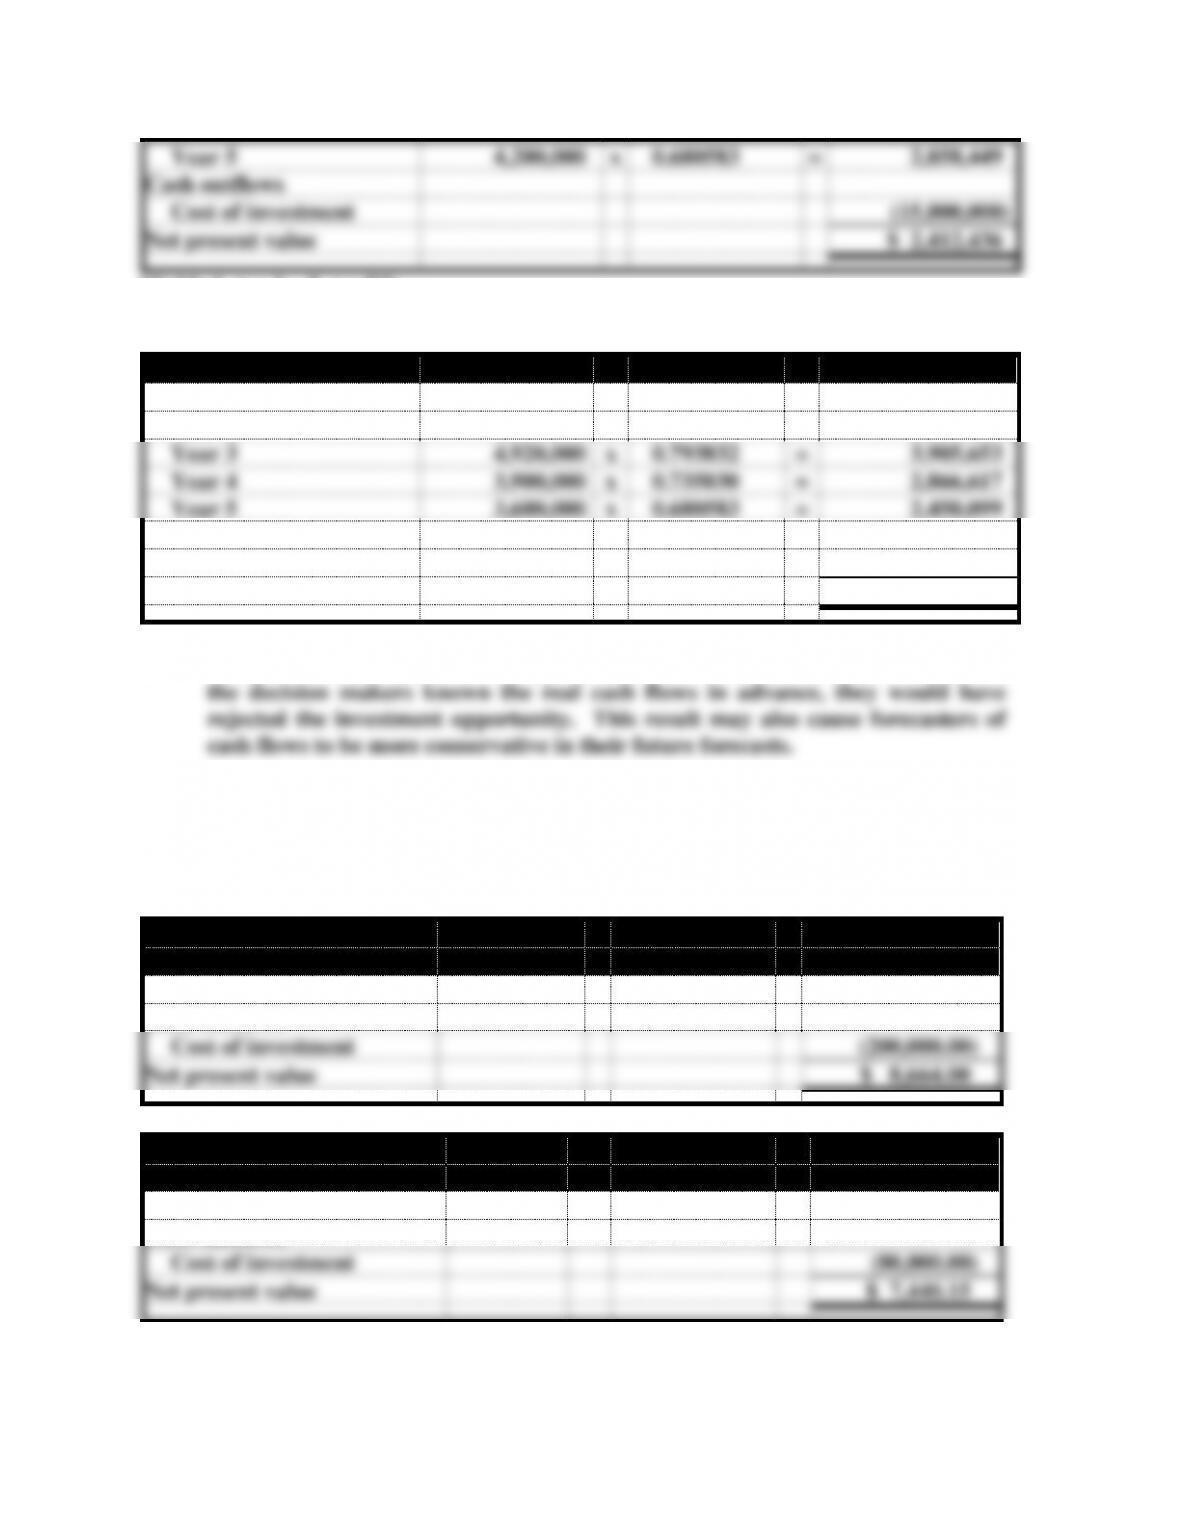
Year 4
4,980,000
x
0.735030
=
3,660,449
Chapter 16 Planning for Capital Investments
16-2
Year 5
4,200,000
x
0.680583
=
2,858,449
Cash outflows
Cost of investment
(15,000,000)
Net present value
$ 2,412,436
*Table 1, n = 1 – 5, r = 8%
b.
Cash Flows
Table Value
Present Value
Year 1
$2,700,000
x
0.925926
=
$ 2,500,000
Year 2
3,060,000
x
0.857339
=
2,623,457
Year 3
4,920,000
x
0.793832
=
3,905,653
Year 4
3,900,000
x
0.735030
=
2,866,617
Year 5
3,600,000
x
0.680583
=
2,450,099
Cash outflows
Cost of investment
(15,000,000)
Net present value
$ (654,174)
c. The postaudit reveals that the original cash flow estimates were inaccurate. Had
Problem 16-19
a.
Project A
Cash Inflows
Table Value
Present Value
Annual cash inflows
$63,000
x
3.312127*
=
$208,664.00
Cash outflows
Cost of investment
(200,000.00)
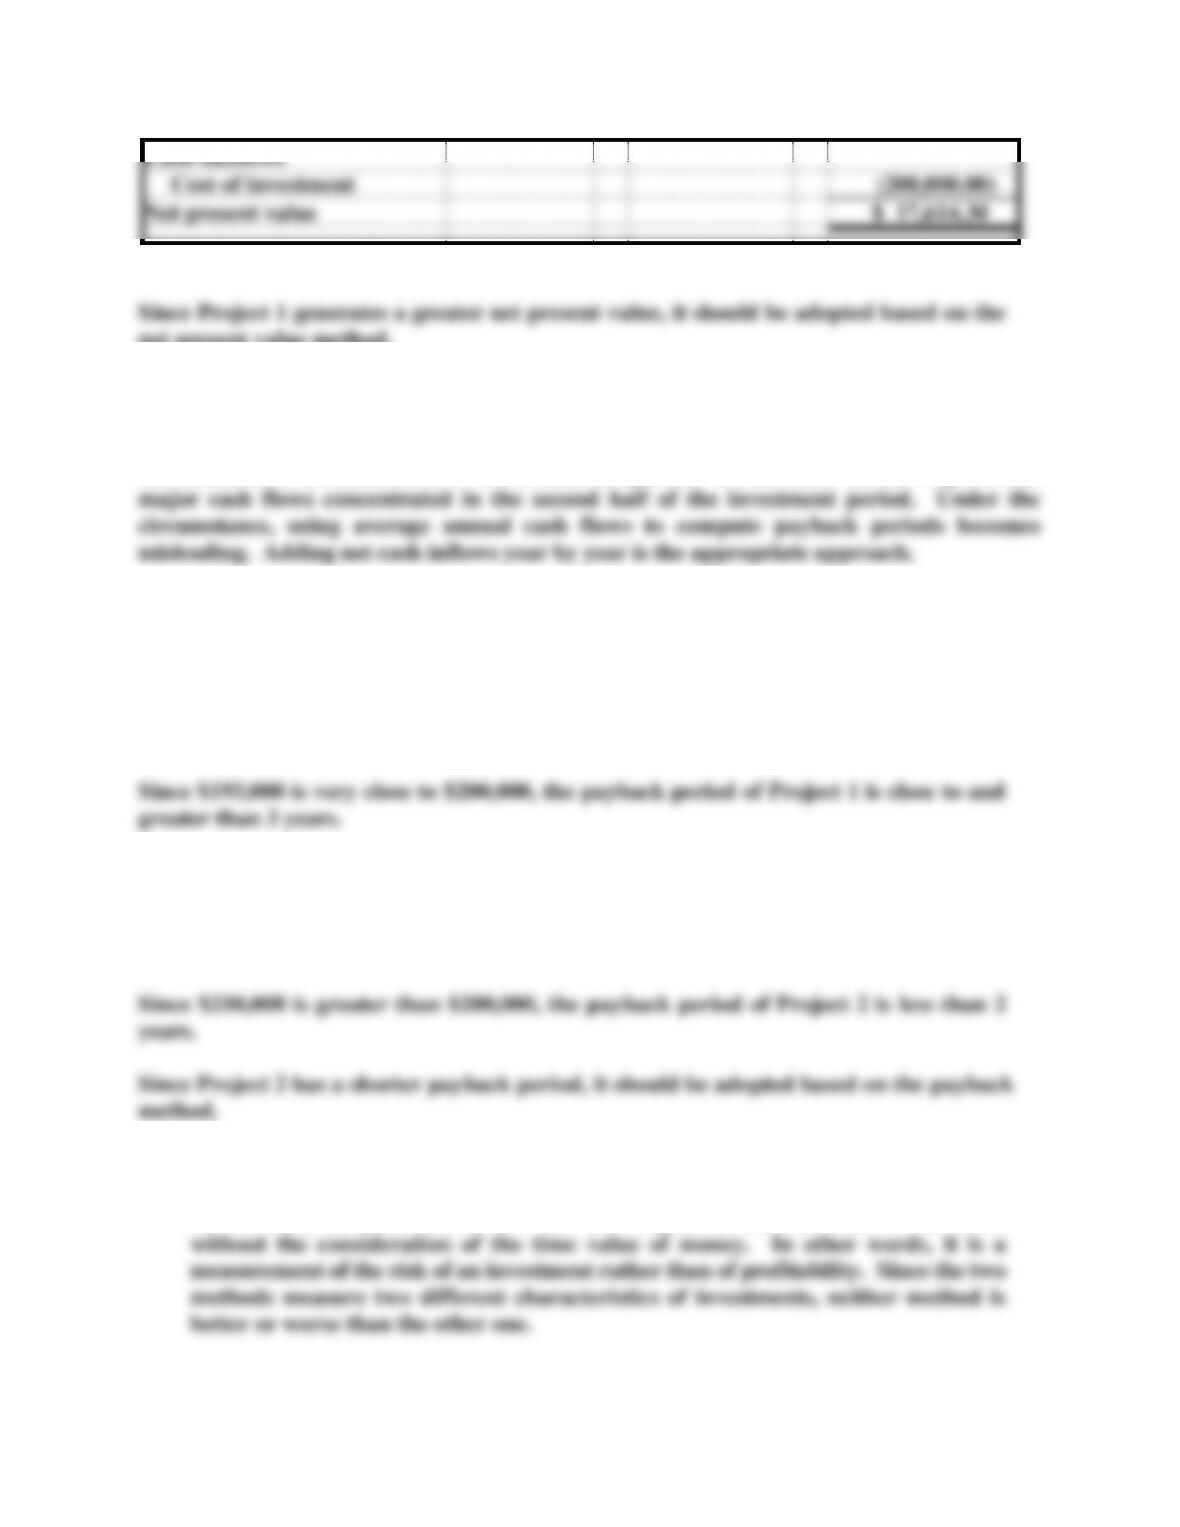
Net present value
$ 8,664.00
Project B
Cash Inflows
Table Value
Present Value
Annual cash inflows
$26,400
x
3.312127*
=
$87,440.15
Cash outflows
Cost of investment
(80,000.00)
Net present value
$ 7,440.15
*Table 2, n = 4, r = 8%
Chapter 16 Planning for Capital Investments
16-3
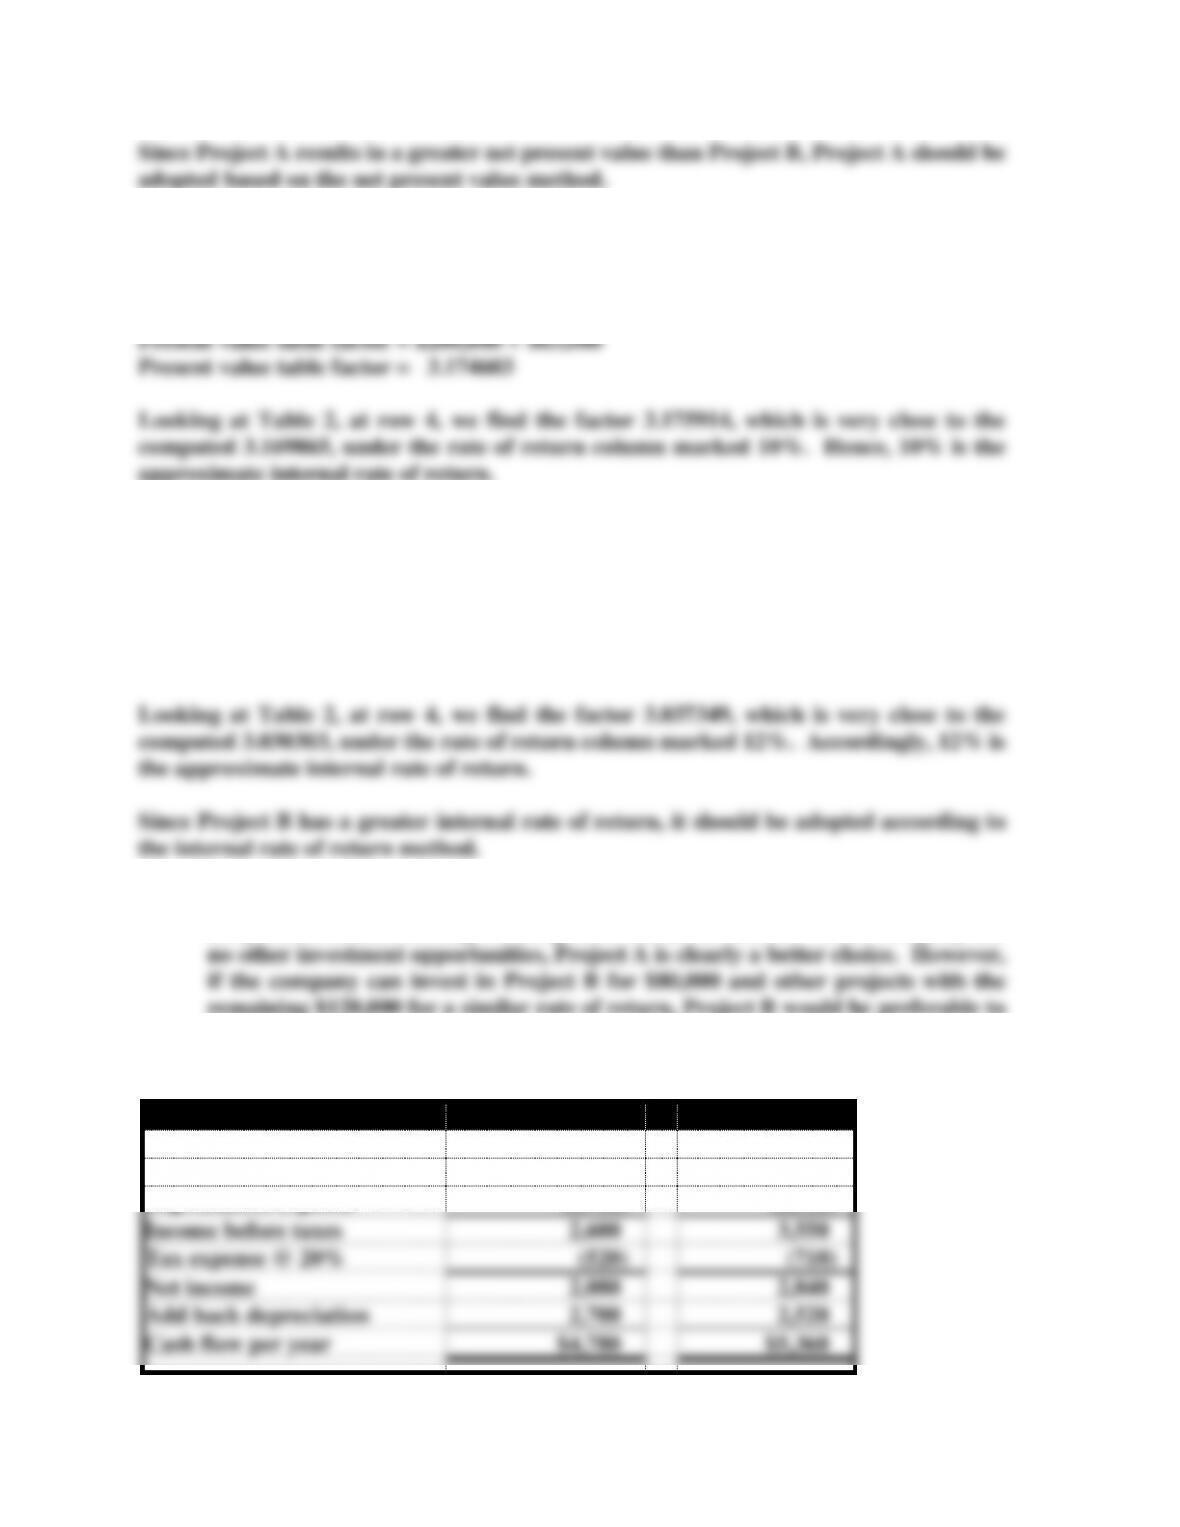
b.
Project A:
Present value table factor x $63,000 = $200,000
approximate internal rate of return.
Problem 16-19 (continued)
Project B:
Present value table factor x $26,400 = $80,000
Present value table factor = $80,000 $26,400
Present value table factor = 3.030303
c. Each method has its own strengths and weaknesses. Project A generates a greater
net present value, resulting from a greater initial investment. If the company has
remaining $120,000 for a similar rate of return, Project B would be preferable to
Project A.Problem 16-20
a.
Alternative 1
Alternative 2
Revenues
$6,200
$8,500
Operating expenses
(900)
(2,430)
Depreciation expense
(2,700)
(2,520)
Income before taxes
2,600
3,550
Tax expense @ 20%
(520)
(710)
Net income
2,080
2,840
Add back depreciation
2,700
2,520
Cash flow per year
$4,780
$5,360
Chapter 16 Planning for Capital Investments
16-4
Alternative 1
Alternative 2
Payback Period
Payback Period
$8,100
$10,080
= 1.69 years
= 1.88 years
$4,780
$5,360
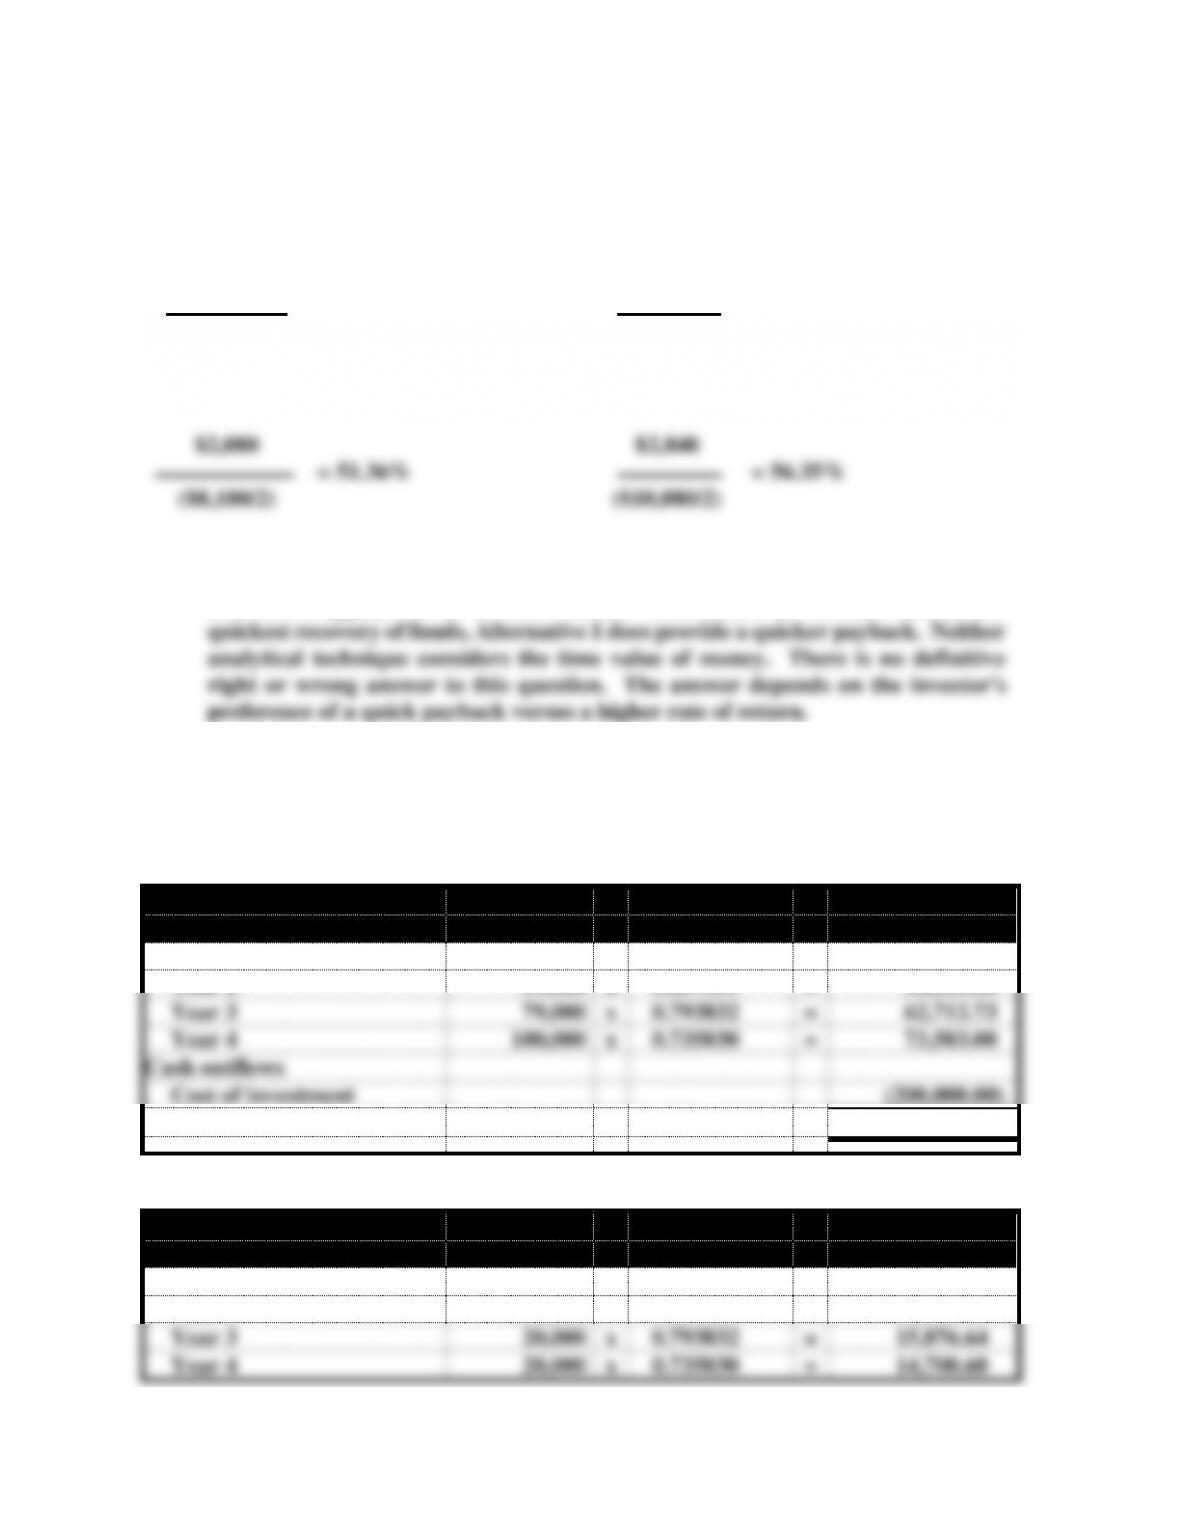
Unadjusted rate of return:
Unadjusted rate of return:
$2,080
$2,840
= 51.36%
= 56.35%
($8,100/2)
($10,080/2)
b. Because of its longer useful life and its higher unadjusted rate of return, the second
alternative appears to be a better choice. However, if an investor desires the
Problem 16-21
a.
Opportunity 1
Cash Inflows
Table Value*
Present Value
Year 1
$55,000
x
0.925926
=
$ 50,925.93
Year 2
59,000
x
0.857339
=
50,583.00
Year 3
79,000
x
0.793832
=
62,712.73
Year 4
100,000
x
0.735030
=
73,503.00
Cash outflows
Cost of investment
(200,000.00)
Net present value
$ 37,724.66
*Table 1, n = 1– 4, r = 8%
Opportunity 2
Cash Inflows
Table Value*
Present Value
Year 1
$102,000
x
0.925926
=
$ 94,444.45
Year 2
108,000
x
0.857339
=
92,592.61
Year 3
20,000
x
0.793832
=
15,876.64
Year 4
20,000
x
0.735030
=
14,700.60
Chapter 16 Planning for Capital Investments
16-5
Cash outflows
Cost of investment
(200,000.00)
Net present value
$ 17,614.30
*Table 1, n = 1– 4, r = 8%
net present value method.
b. Payback:
The cash flows in this problem are not evenly distributed. Project 1 has major cash inflows
concentrated in the second half of the investment period. On the other hand, Project 2 has
Problem 16-21 (continued)
Project 1:
Average annual cash flow:
$55,000 + $59,000 + $79,000 = $193,000 < $200,000
Project 2:
The sum of cash inflows for year 1 and year 2 =
$102,000 + $108,000 = $210,000 > $200,000
c. The net present value represents the net cash profit with the consideration of the
time value of money for a particular investment opportunity. The payback period,
on the other hand, measures how fast the original investment can be recovered
Chapter 16 Planning for Capital Investments
16-6
If an investor is very concerned about the risk of an investment, he/she should
probably use the payback method as the primary decision tool and the net present
Problem 16-22
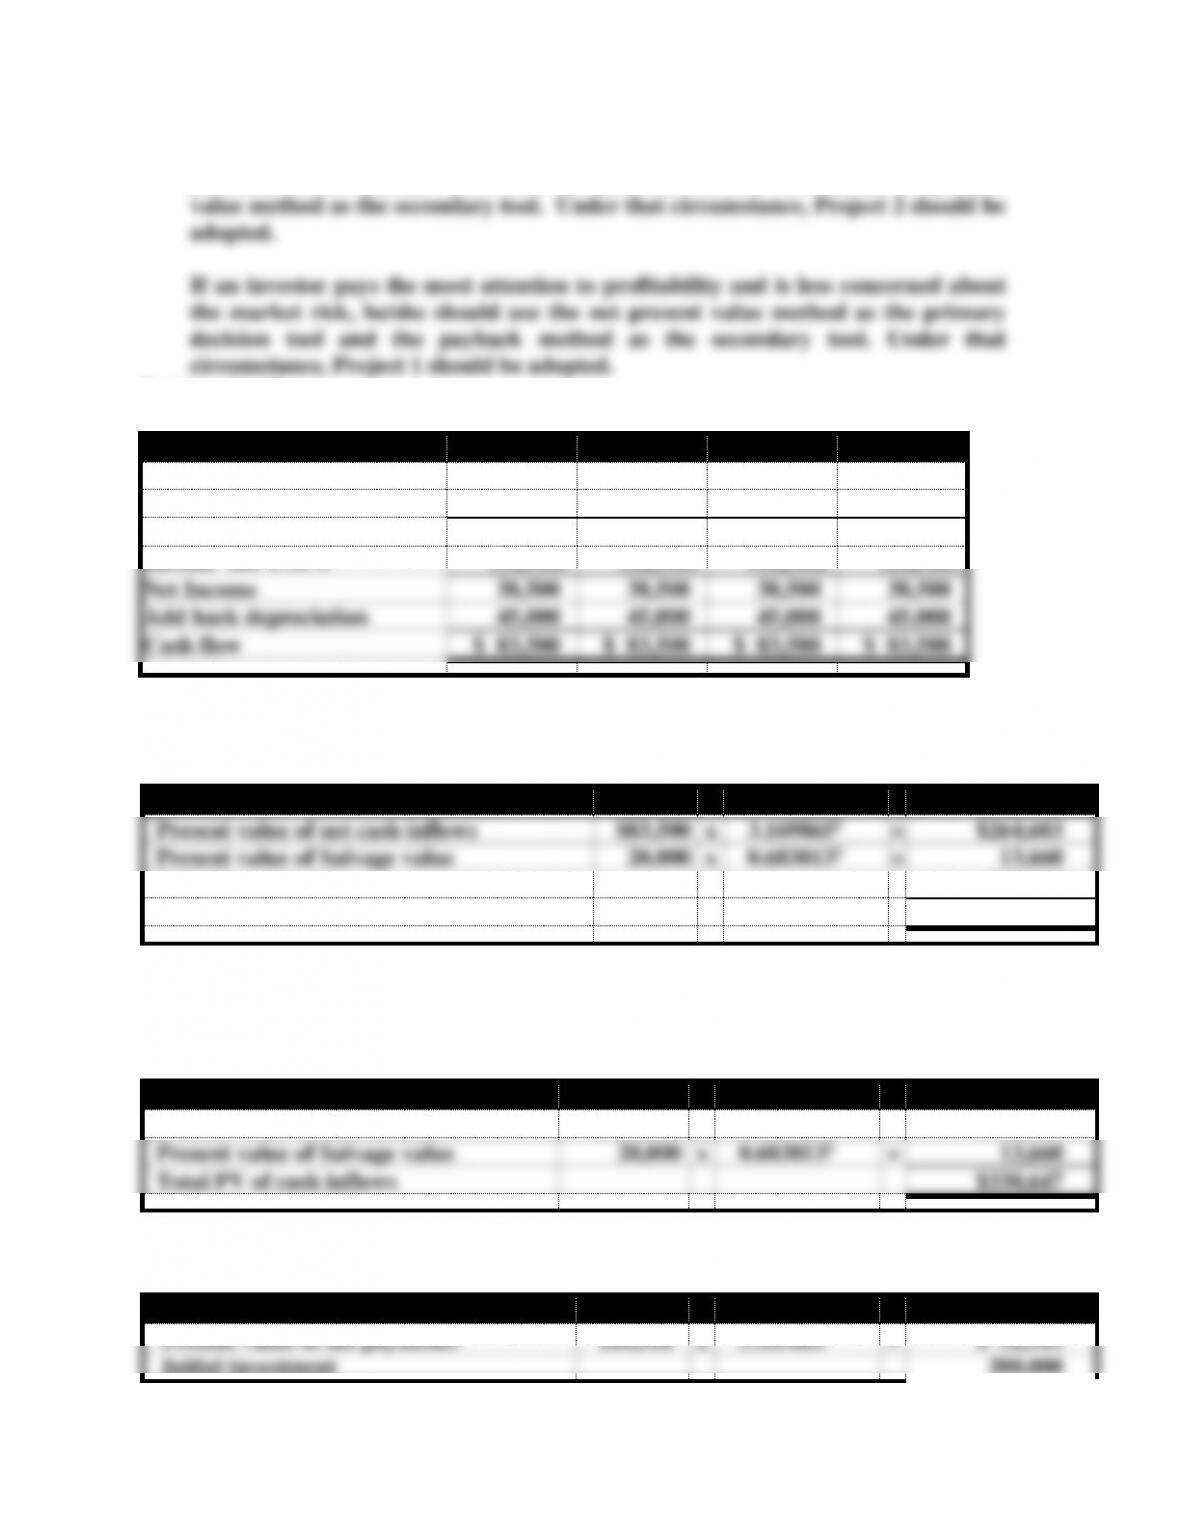
a.
Year
1
2
3
4
Revenue
$100,000
$100,000
$100,000
$100,000
Depreciation
(45,000)
(45,000)
(45,000)
(45,000)
Income before tax
55,000
55,000
55,000
55,000
Income tax @30%
(16,500)
(16,500)
(16,500)
(16,500)
Net Income
38,500
38,500
38,500
38,500
Add back depreciation
45,000
45,000
45,000
45,000
Cash flow
$ 83,500
$ 83,500
$ 83,500
$ 83,500
1Table 2, n=4, r=10%
2Table 1, n=4, r=10%
Net Present Value
Table Value
Present Value
Present value of net cash inflows
$83,500
x
3.1698651
=
$264,683
Present value of Salvage value
20,000
x
0.6830132
=
13,660
Initial investment
(200,000)
Net present value
$ 78,343
1Table 2, n=4, r=10%
2Table 1, n=4, r=10%
Present value index computation:
Present Value of Cash Inflows
Table Value
Present Value
Present value of cash inflows
$100,000
x
3.1698651
=
$316,987
Present value of Salvage value
20,000
x
0.6830132
=
13,660
Total PV of cash inflows
$330,647
1Table 2, n=4, r=10%
2Table 1, n=4, r=10%
Present Value of Cash Outflows
Table Value
Present Value
Present value of tax payments
$16,500
x
3.1698651
=
$ 52,303
Initial investment
200,000
Chapter 16 Planning for Capital Investments
16-7
Total PV of cash outflows
$252,303
1Table 2, n=4, r=10%
Present value index
$330,647
/
$252,303
=
1.31
Problem 16-22 (continued)
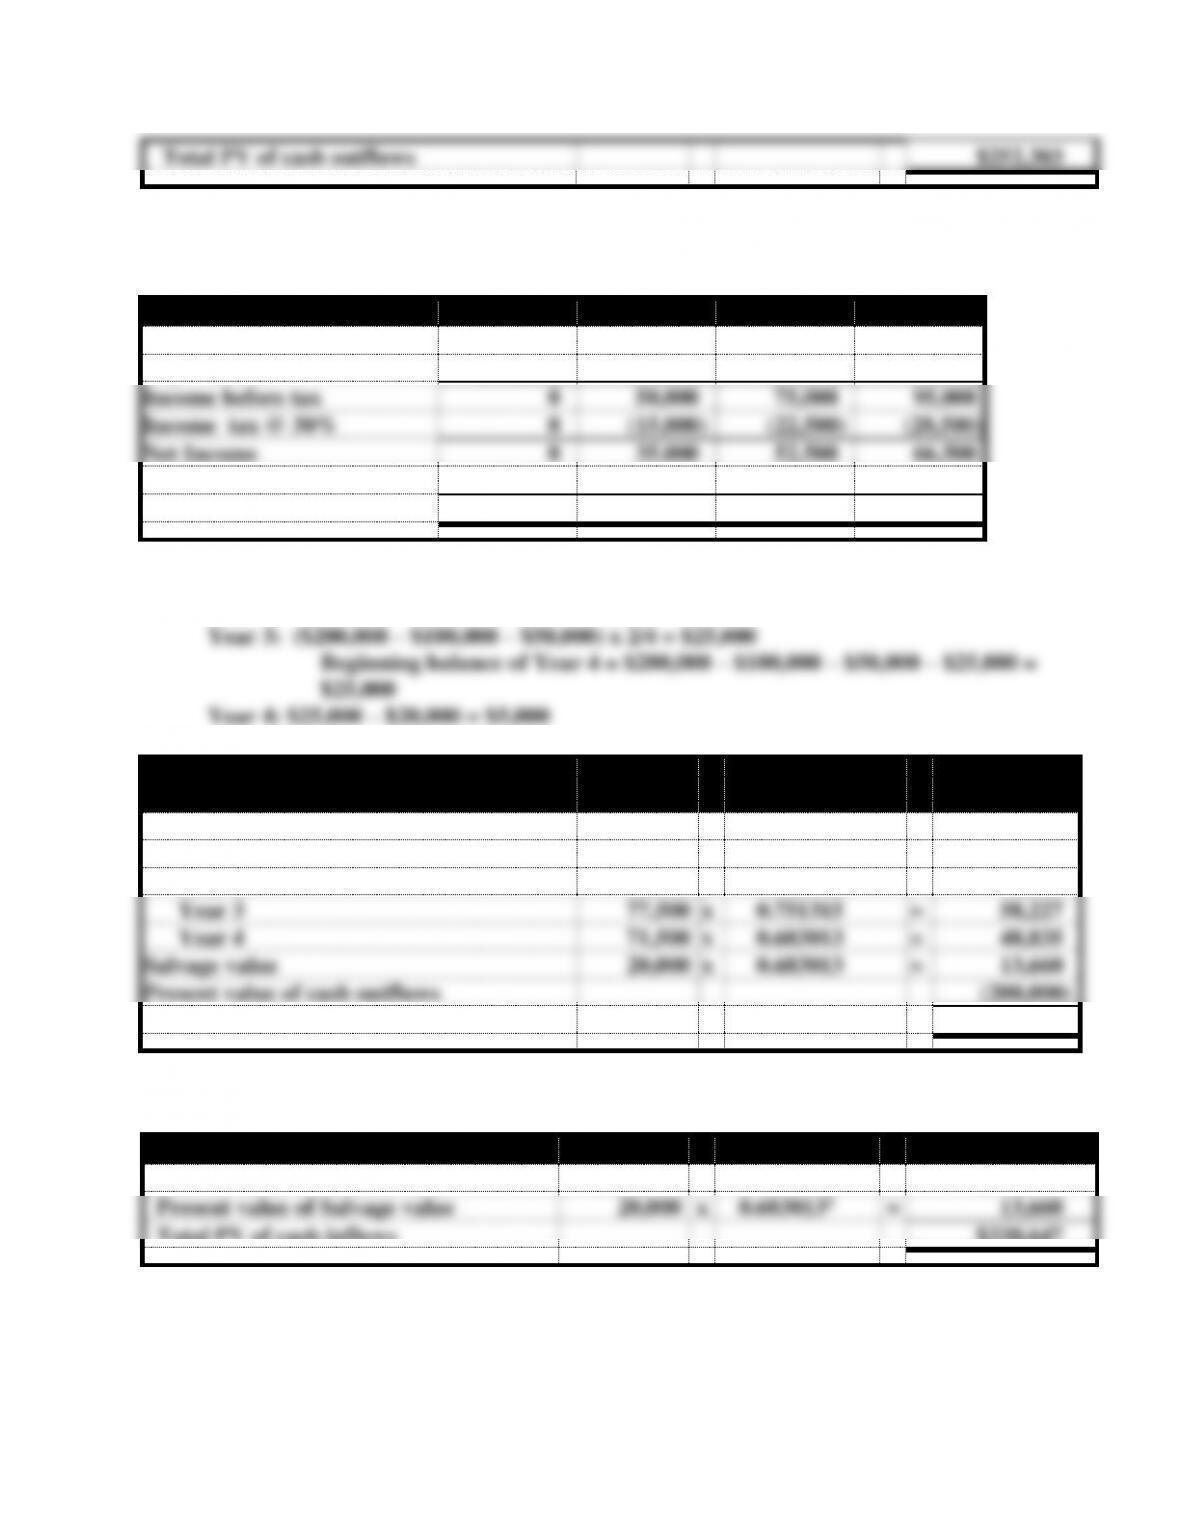
b.
Year
1
2
3
4
Revenue
$100,000
$100,000
$100,000
$100,000
Depreciation*
(100,000)
(50,000)
(25,000)
(5,000)
Income before tax
0
50,000
75,000
95,000
Income tax @ 30%
0
(15,000)
(22,500)
(28,500)
Net Income
0
35,000
52,500
66,500
Add back depreciation
100,000
50,000
25,000
5,000
Cash flow
$100,000
$ 85,000
$ 77,500
$ 71,500
*Double-declining-balance depreciation:
Year 1: $200,000 x 2/4 = $100,000
Year 2: ($200,000 – $100,000) x 2/4 = $50,000
Net Present Value
Table Value*
Present Value
Present value of net cash inflows
Year 1
$100,000
x
0.909091
=
$ 90,909
Year 2
85,000
x
0.826446
=
70,248
Year 3
77,500
x
0.751315
=
58,227
Year 4
71,500
x
0.683013
=
48,835
Salvage value
20,000
x
0.683013
=
13,660
Present value of cash outflows
(200,000)
Net present value
$ 81,879
*Table 1, n= 1 – 4, r=10%
Present value index computation:
Present Value of Cash Inflows
Table Value
Present Value
Present value of cash inflows
$100,000
x
3.1698651
=
$316,987
Present value of Salvage value
20,000
x
0.6830132
=
13,660
Total PV of cash inflows
$330,647
1Table 2, n=4, r=10%
2Table 1, n=4, r=10%%
Problem 16-22 (continued)
Chapter 16 Planning for Capital Investments
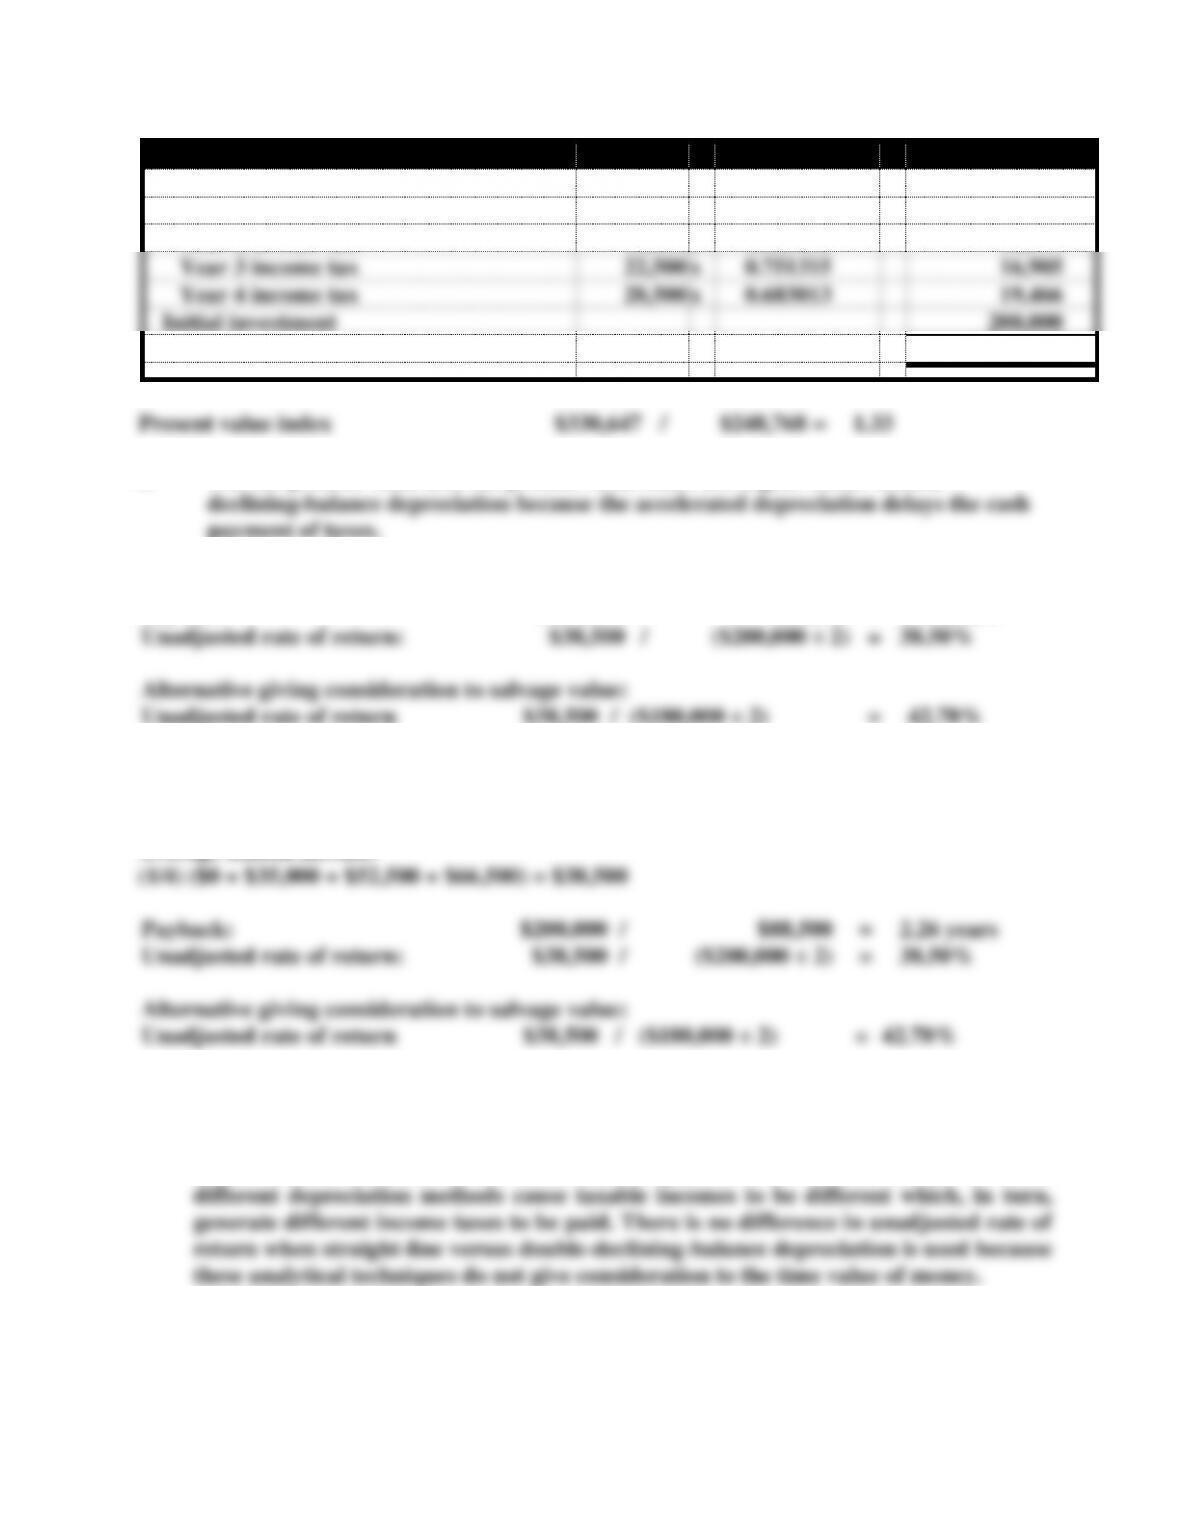
Present Value of Cash Outflows
Table Value
Present Value
Present value of tax payments
Year 1 income tax
0
x
0.909091
$0
Year 2 income tax
15,000
x
0.826446
12,397
Year 3 income tax
22,500
x
0.751315
16,905
Year 4 income tax
28,500
x
0.683013
19,466
Initial investment
200,000
Total PV of cash outflows
$248,768
Present value index
$330,647
/
$248,768
=
1.33
c. The net present value and the present value index are higher under double-
payment of taxes.
d.
Payback:
$200,000
/
$83,500
=
2.40 years
Unadjusted rate of return:
$38,500
/
($200,000 ÷ 2)
=
38.50%
Alternative giving consideration to salvage value:
Unadjusted rate of return
$38,500
/
($180,000 ÷ 2)
=
42.78%
e.
Average annual cash flow under the double declining depreciation:
(1/4) ($100,000 + $85,000 + $77,500 + $91,500) =$88,500
Average annual income:
Payback:
$200,000
/
$88,500
=
2.26 years
Unadjusted rate of return:
$38,500
/
($200,000 ÷ 2)
=
38.50%
Alternative giving consideration to salvage value:
Unadjusted rate of return
$38,500
/
($180,000 ÷ 2)
=
42.78%
Problem 16-22 (continued)
(f) The difference in the payback period when straight-line versus double-declining-balance
depreciation are caused by the differences in payments for income taxes. The two
different depreciation methods cause taxable incomes to be different which, in turn,
generate different income taxes to be paid. There is no difference in unadjusted rate of
return when straight-line versus double-declining-balance depreciation is used because
these analytical techniques do not give consideration to the time value of money.
Problem 16-23
Chapter 16 Planning for Capital Investments
16-9
a. Unadjusted Rate of Return:
Average increase in net income Average net cost of original investment
$7,000 $50,000 = 14%
b. Internal Rate of Return:
Present value table factor x $27,700 = $100,000
Present value table factor = $100,000 $27,700
Present value table factor = 3.610108
c. The internal rate of return is the better method for this capital investment decision
ATC 16-1
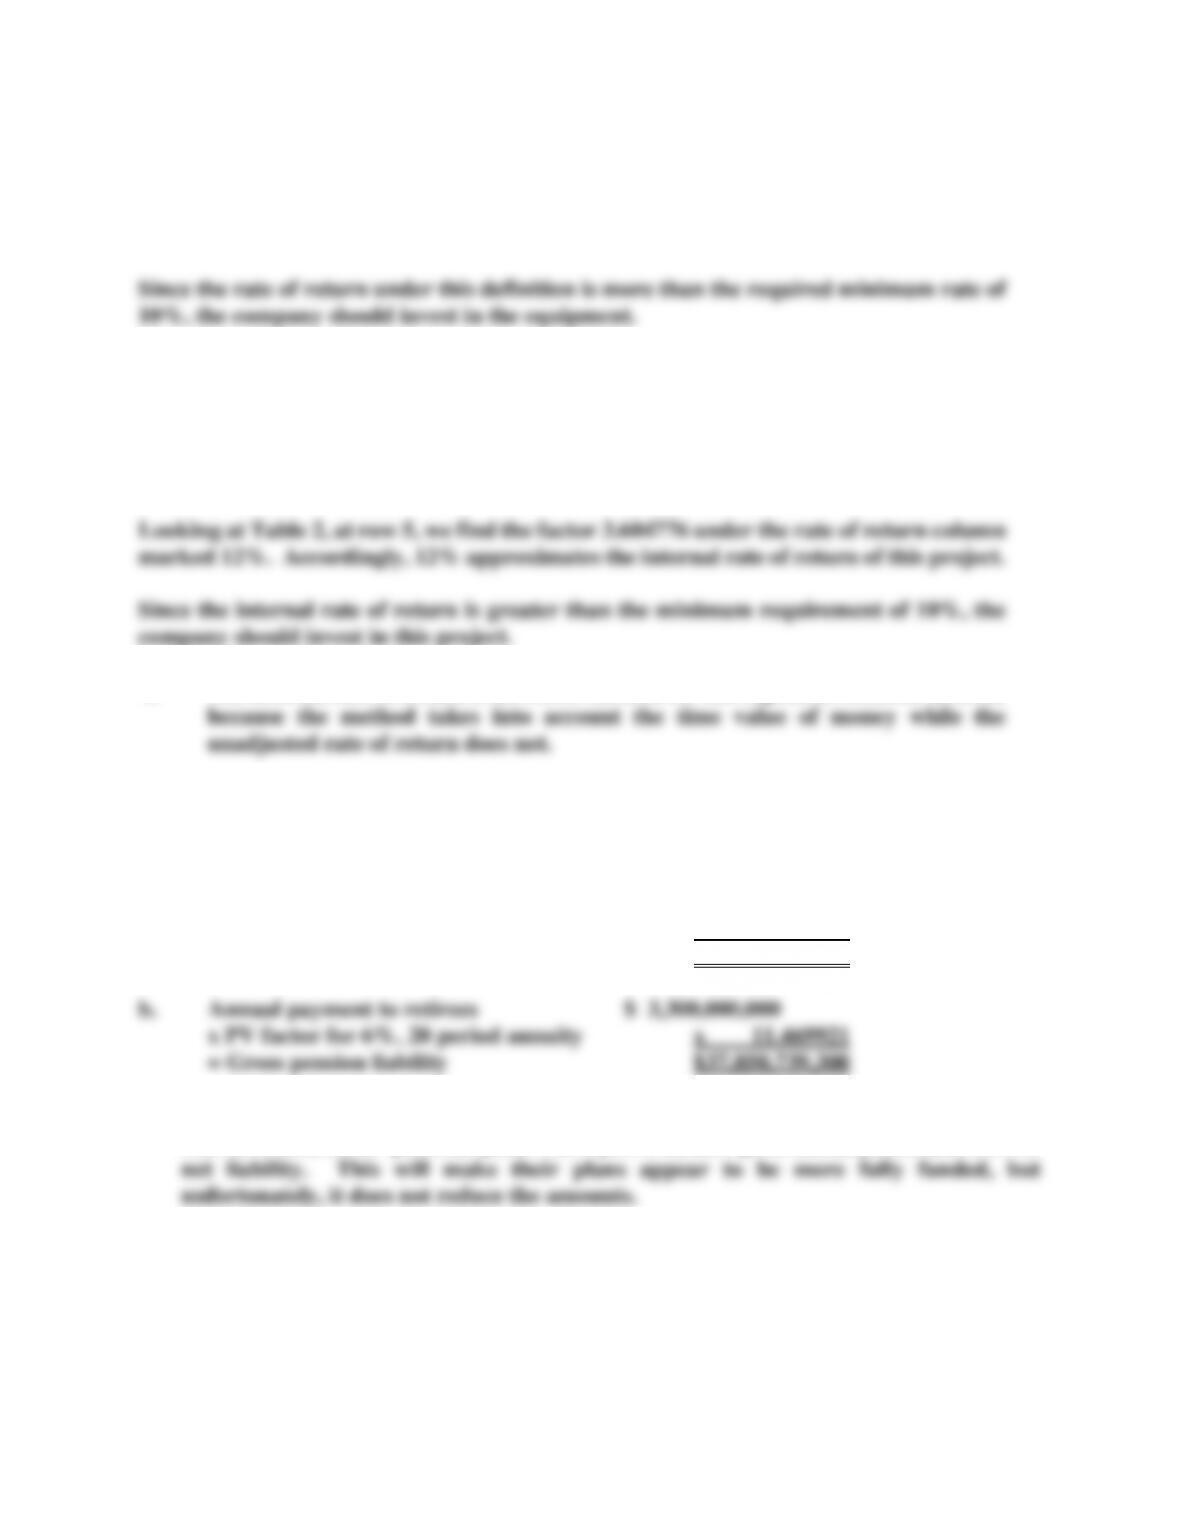
a. Annual payment to retirees $ 3,300,000,000
x PV factor for 8%, 20 period annuity x 9.818147
= Gross pension liability $32,399,885,100
c. By assuming the investments in their pension plans will earn a higher, versus a lower,
rate of return, states’ pensions plans will report a smaller gross liability, and thus a lower
ATC 16-2
Computations rounded to nearest whole dollar:
Harding Properties


