Unlock document.
This document is partially blurred.
Unlock all pages and 1 million more documents.
Get Access
Chapter 15 Performance Evaluation
15-1
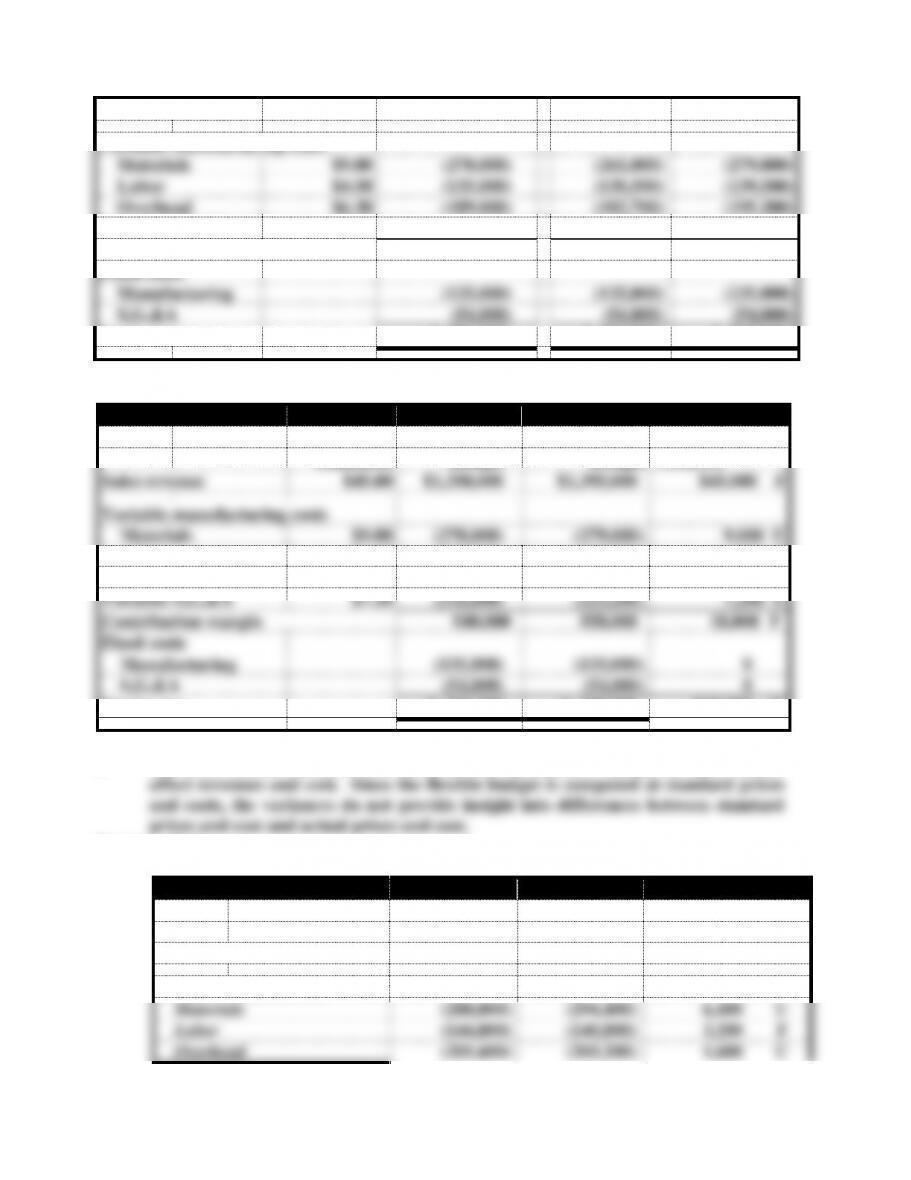
Sales revenue
$45.00
$1,350,000
$1,305,000
$1,395,000
Variable manufacturing costs
Materials
$9.00
(270,000)
(261,000)
(279,000)
Labor
$4.50
(135,000)
(130,500)
(139,500)
Overhead
$6.30
(189,000)
(182,700)
(195,300)
Variable S,G,&A
$7.20
(216,000)
(208,800)
(223,200)
Contribution margin
540,000
522,000
558,000
Fixed costs
Manufacturing
(135,000)
(135,000)
(135,000)
S,G,&A
(54,000)
(54,000)
(54,000)
Net income
$ 351,000
$ 333,000
$ 369,000
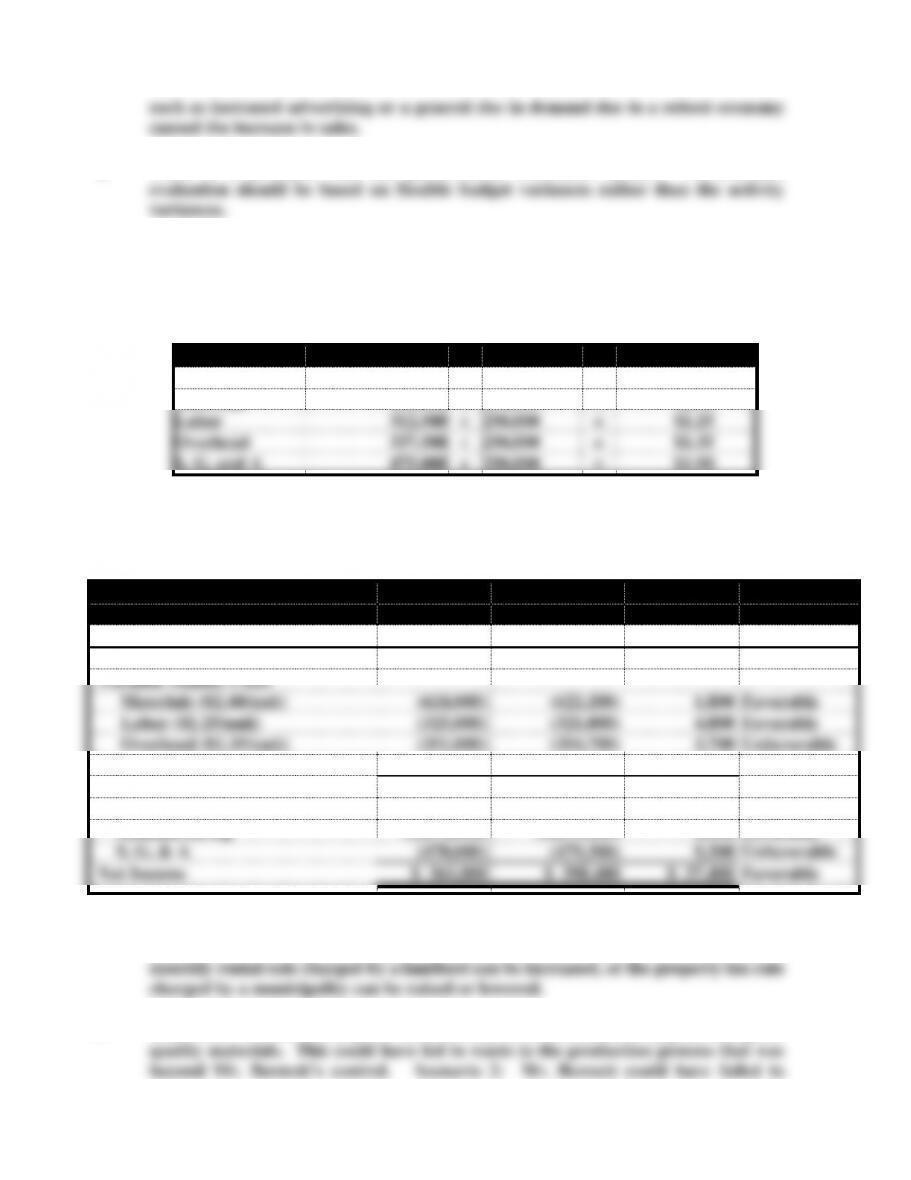
c. & d.
Number of units
30,000
31,000
Per Unit
Master
Flexible
Volume
Standards
Budget
Budget
Variances
Sales revenue
$45.00
$1,350,000
$1,395,000
$45,000 F
Variable manufacturing costs
Materials
$9.00
(270,000)
(279,000)
9,000 U
Labor
$4.50
(135,000)
(139,500)
4,500 U
Overhead
$6.30
(189,000)
(195,300)
6,300 U
Variable S,G,&A
$7.20
(216,000)
(223,200)
7,200 U
Contribution margin
540,000
558,000
18,000 F
Fixed costs
Manufacturing
(135,000)
(135,000)
0
S,G,&A
(54,000)
(54,000)
0
Net income
$ 351,000
$ 369,000
$18,000 F
e. The sales volume variances are useful in determining how changes in sales volume
Problem 15-21
a. & b.
Number of units
32,000
32,000
Flexible
Actual
Flexible Budget
Budget
Results
Variances
Sales revenue
$1,440,000
$1,392,000
$48,000 U
Variable manuf. costs
Materials
(288,000)
(294,400)
6,400 U
Labor
(144,000)
(140,800)
3,200 F
Overhead
(201,600)
(203,200)
1,600 U
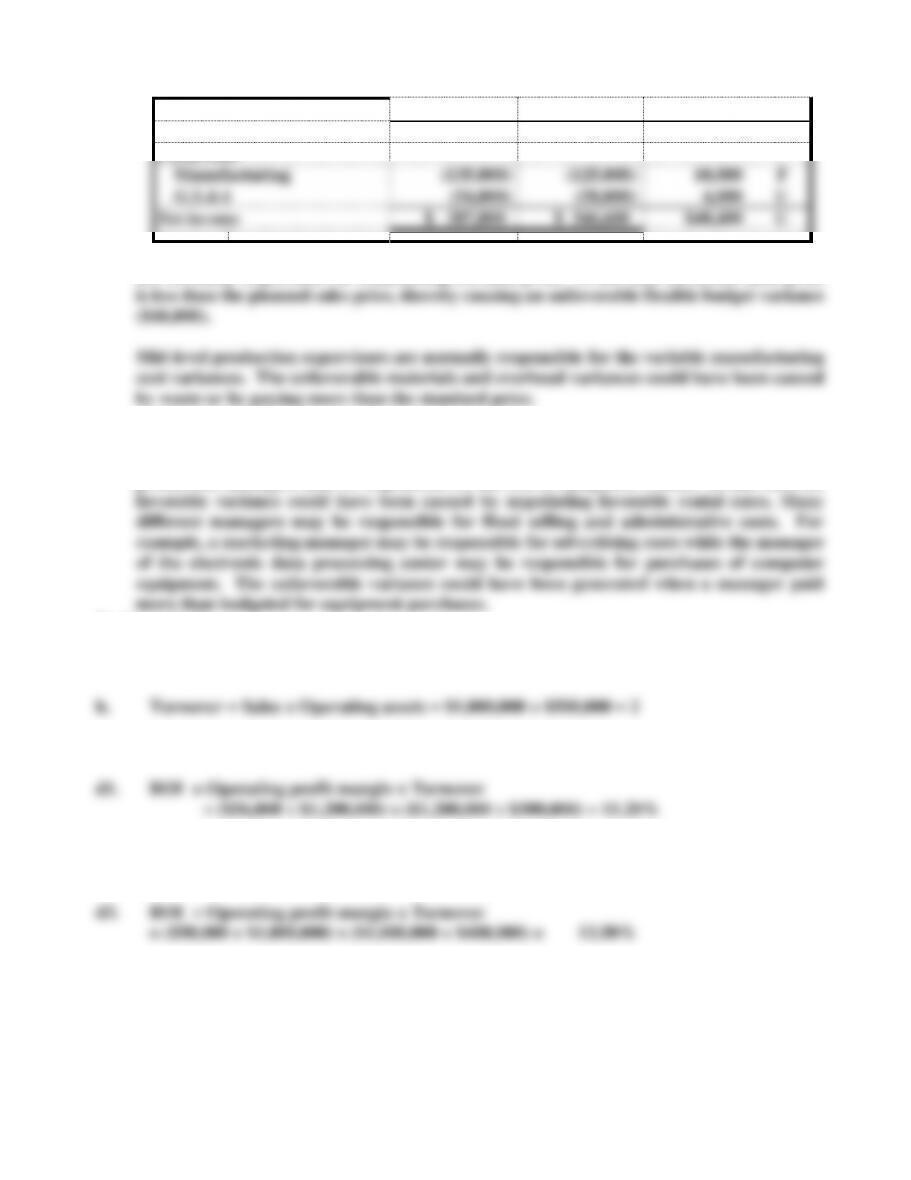
Chapter 15 Performance Evaluation
15-2
Variable G,S,&A
(230,400)
(224,000)
6,400 F
Contribution margin
576,000
529,600
46,400 U
Fixed costs
Manufacturing
(135,000)
(125,000)
10,000 F
G,S,&A
(54,000)
(58,000)
4,000 U
Net income
$ 387,000
$ 346,600
$40,400 U
c. Upper-level marketing managers are responsible for the sales variance. These managers
are normally responsible for establishing the sales price. In this case the actual sales price
Many different managers may be responsible for fixed manufacturing cost variances. For
example, the personnel manager may be responsible for supervisory salaries while
production managers may be responsible for the cost of equipment rentals. In this case, the
Problem 15-22
a. Operating profit margin = Operating income ÷ Sales = $50,000 ÷ $1,000,000 = 5.00%
c. ROI = Operating profit margin x Turnover = 5.00% x 2 = 10.00%
d2. ROI = Operating profit margin x Turnover
= ($52,000 ÷ $1,000,000) x ($1,000,000 ÷ $500,000) = 10.40%
Problem 15-23
a. Operating income, instead of net Income, should be used to determine the ROI for the
Morrison investment center because operating income is a better measurement of
Chapter 15 Performance Evaluation
15-3
b. Operating assets, instead of total assets, should be used to determine the ROI for the
c. Operating Assets = Total Assets – Non-Operating Assets
Operating Assets = $197,682 – $9,000 = $188,682
d. If ROI is the only performance measure for Morrison’s performance, the new investment
would hurt Morrison’s manager if the new ROI decreases. Morrison’s return on the new
Income from New Investment = $96,000 x 12% = $11,520
e. If Cole’s objective is profit maximization, residual income (RI), rather than ROI can
measure operating performance to reflect that objective better. Further computation
follows.
Original RI = $43,500 – ($188,682 x 10%) = $24,632 (rounded)
New RI = $55,020 – ($284,682 x 10%) = $26,552 (rounded)
Chapter 15 Performance Evaluation
15-4
Problem 15-24
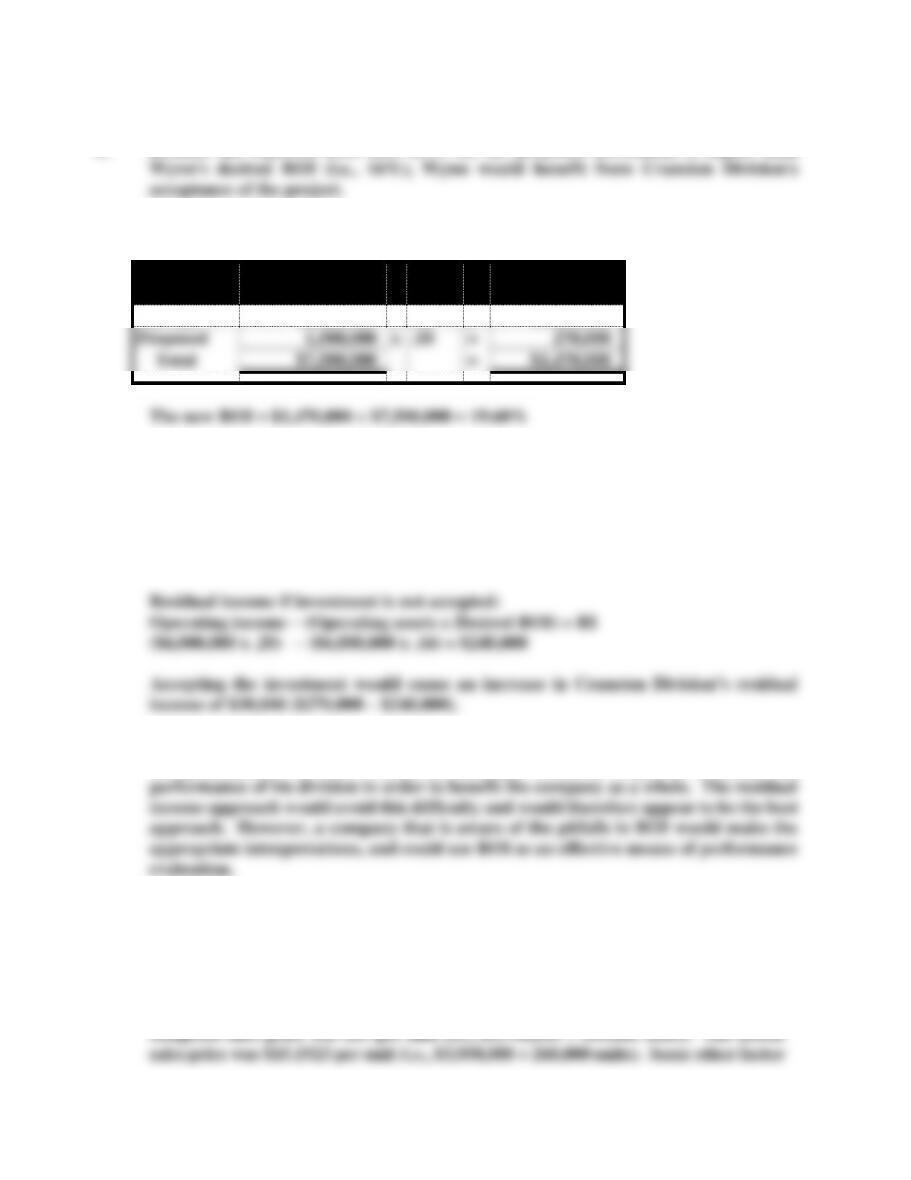
a. Because the expected ROI (i.e., 18%) on the proposed investment is higher than
b. Computation of ROI if the proposed investment is accepted:
Operating
Assets
x
ROI
=
Operating
Income
Current
$6,000,000
x
.20
=
$1,200,000
Proposed
1,500,000
x
.18
=
270,000
Total
$7,500,000
=
$1,470,000
Accepting the proposed project would result in a decline of the division's ROI from 20% to
19.60%.
c. Residual income if investment is accepted:
Operating income – (Operating assets x Desired ROI) = RI
($7,500,000 x .196) – ($7,500,000 x .16) = $270,000
d. In this case, the ROI approach for performance evaluation may result in
suboptimization. In other words, the manager would be required to reduce the
ATC 15-1
a. The increase in sales volume was not achieved by lowering the sales price. The
Chapter 15 Performance Evaluation
15-5
b. There is a problem with the performance evaluation system. Performance
c. To prepare a flexible budget, first determine the budgeted sales price, and the standard
cost per unit for materials, labor, overhead, and G,S,&A. These amounts are shown
below:
Dollars
Units
Cost Per Unit
Sales Price
$3,750,000
÷
250,000
=
$15.00
Materials
600,000
÷
250,000
=
$2.40
Labor
312,500
÷
250,000
=
$1.25
Overhead
337,500
÷
250,000
=
$1.35
S, G, and A
475,000
÷
250,000
=
$1.90
ATC 15-1 (continued)
The flexible budget variances are shown below.
Flexible
Actual
Budget
Results
Variances
Number of Units
260,000
260,000
0
Sales Revenue
$3,900,000
$3,950,000
$50,000
Favorable
Variable Manuf. Costs
Materials ($2.40/unit)
(624,000)
(622,200)
1,800
Favorable
Labor ($1.25/unit)
(325,000)
(321,000)
4,000
Favorable
Overhead ($1.35/unit)
(351,000)
(354,700)
3,700
Unfavorable
Variable S, G, & A ($1.90/unit)
(494,000)
(501,300)
7,300
Unfavorable
Contribution Margin ($8.10/unit)
2,106,000
2,150,800
44,800
Favorable
Fixed Costs
Manufacturing
(1,275,000)
(1,273,100)
1,900
Favorable
S, G, & A
(470,000)
(479,300)
9,300
Unfavorable
Net Income
$ 361,000
$ 398,400
$ 37,400
Favorable
d. A cost is defined as fixed if it does not change when there is a change in activity, but
there are other things that can cause a “fixed” cost to change. For example, the
e. Scenario 1: The favorable price variance may have been attained by purchasing low
Chapter 15 Performance Evaluation
15-6
ATC 15-1 (continued)
f. Recall that the total variance is composed of price and usage variances. Note that
g. The fixed overhead volume variance was favorable, because more units were
Chapter 15 Performance Evaluation
15-7
ATC 15-2
1. Current ROI $8,640,000 ÷ $72,000,000 = 12%
ROI with additional investment $9,960,000* ÷ $84,000,000** = 11.86%
**$72,000,000 + $12,000,000
Since the new investment would decrease Bellco’s ROI, it would have a negative effect
2. Current residual income
$8,640,000 − (10% x $72,000,000) = $1,440,000
Residual Income with additional investment
Since the new investment would increase Bellco’s residual income, it would have a
3. & 4. In-class requirements.
5. ROI is more likely to produce suboptimization because an opportunity that would
Chapter 15 Performance Evaluation
15-8
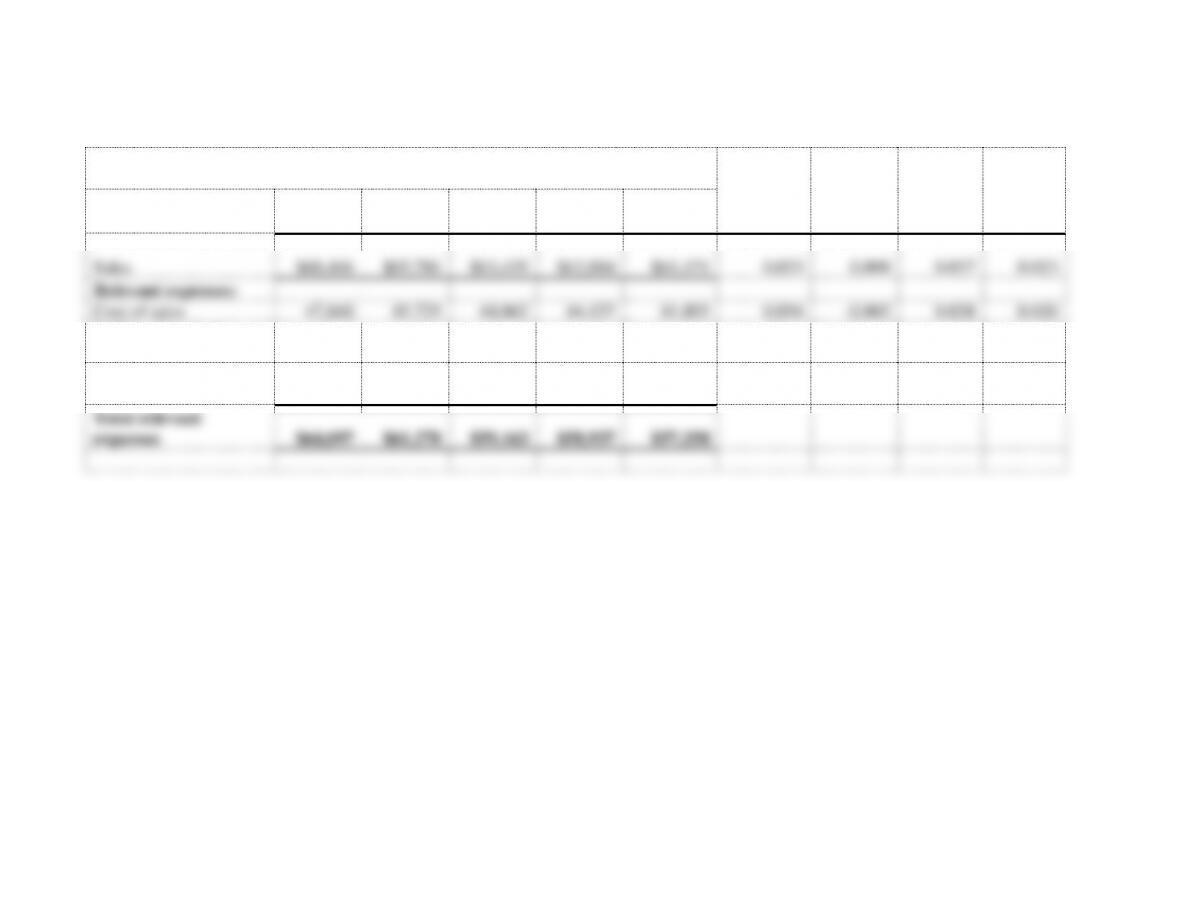
ATC 15-3
Raw Data and Percentage Analysis from Target’s 2008 to 2012 Income
Statements
% of
change
2008 -
2009
% of
change
2009 -
2010
% of
change
2010 –
2011
Average
2008 –
2011
(dollar amounts in
millions)
2012
2011
2010
2009
2008
Sales
$68,466
$65,786
$63,435
$62,884
$61,471
0.023
0.009
0.037
0.023
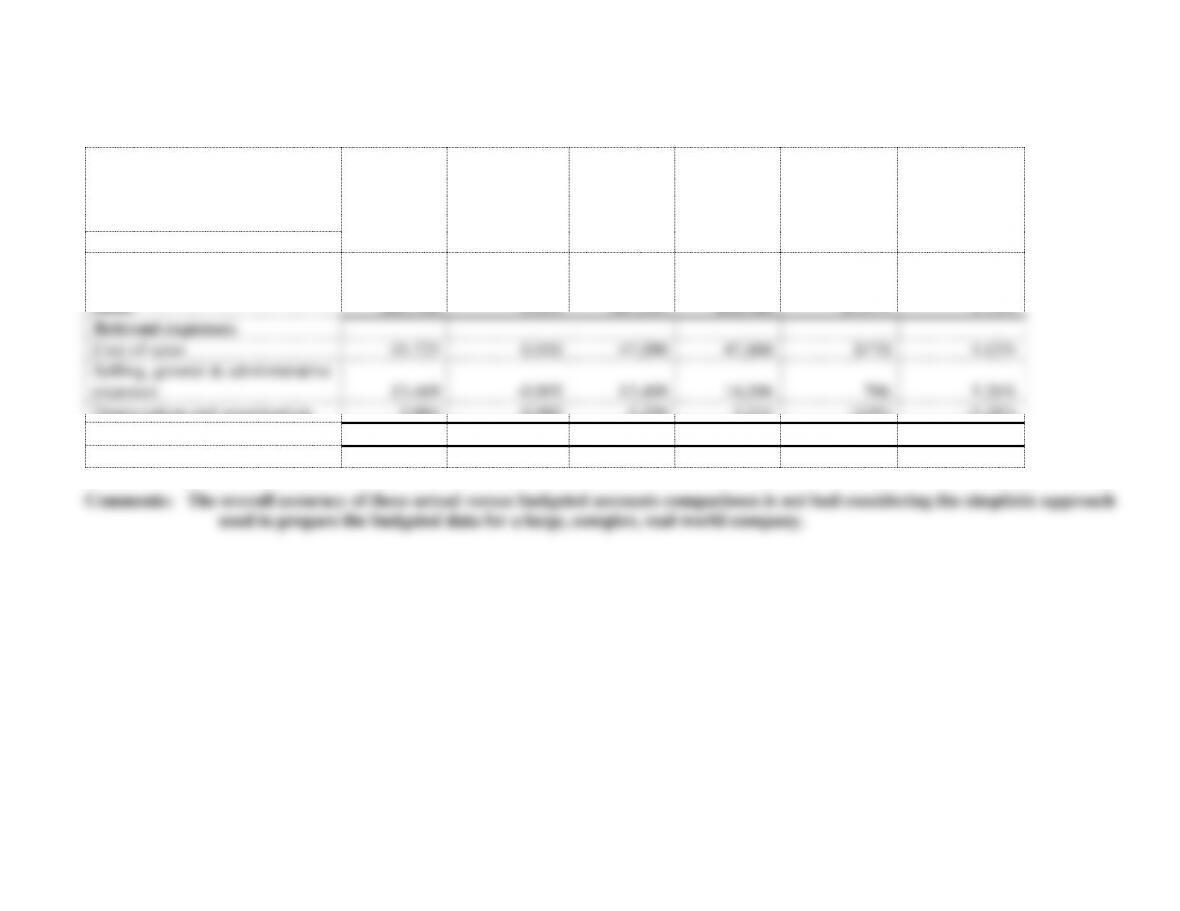
Relevant expenses:
Cost of sales
47,860
45,725
44,062
44,157
41,895
0.054
-0.002
0.038
0.030
Selling, general &
administrative expenses
14,106
13,469
13,078
12,954
13,704
-0.055
0.010
0.030
-0.005
Depreciation and
amortization
2,131
2,084
2,023
1,826
1,659
0.101
0.108
0.030
0.080
Total relevant
expenses
$64,097
$61,278
$59,163
$58,937
$57,258
Chapter 15 Performance Evaluation
15-9
ATC 15-3 continued
Target’s Budgeted and Actual
Income Statement Accounts
Actual **
2011
3 year
Average
Change
2008 to 2011
Budget
2012
Actual
2012
Difference
% Different
from budget
(dollar amounts in millions)
Sales
$65,786
0.023
$67,295
$68,466
$1,171
1.74%
Relevant expenses:
Cost of sales
45,725
0.030
47,090
47,860
$770
1.63%
Selling, general & administrative
expenses
13,469
-0.005
13,400
14,106
706
5.26%
Depreciation and amortization
2,084
0.080
2,250
2,131
(119)
-5.28%
Total relevant expenses
$61,278
$62,740
$64,097
$1,357
2.16%
Chapter 15 Performance Evaluation
15-10
ATC 15-4
The computations below are used to answer requirements a., b., c., and d.
Dollar amounts in millions
Eurasia
Latin
North
2011 FY
& Africa
Europe
America
America
Pacific
(A) Segment income
1,089
3,134
2,832
2,325
2,154
(B) Identifiable assets
1,245
3,204
2,446
33,422
2,085
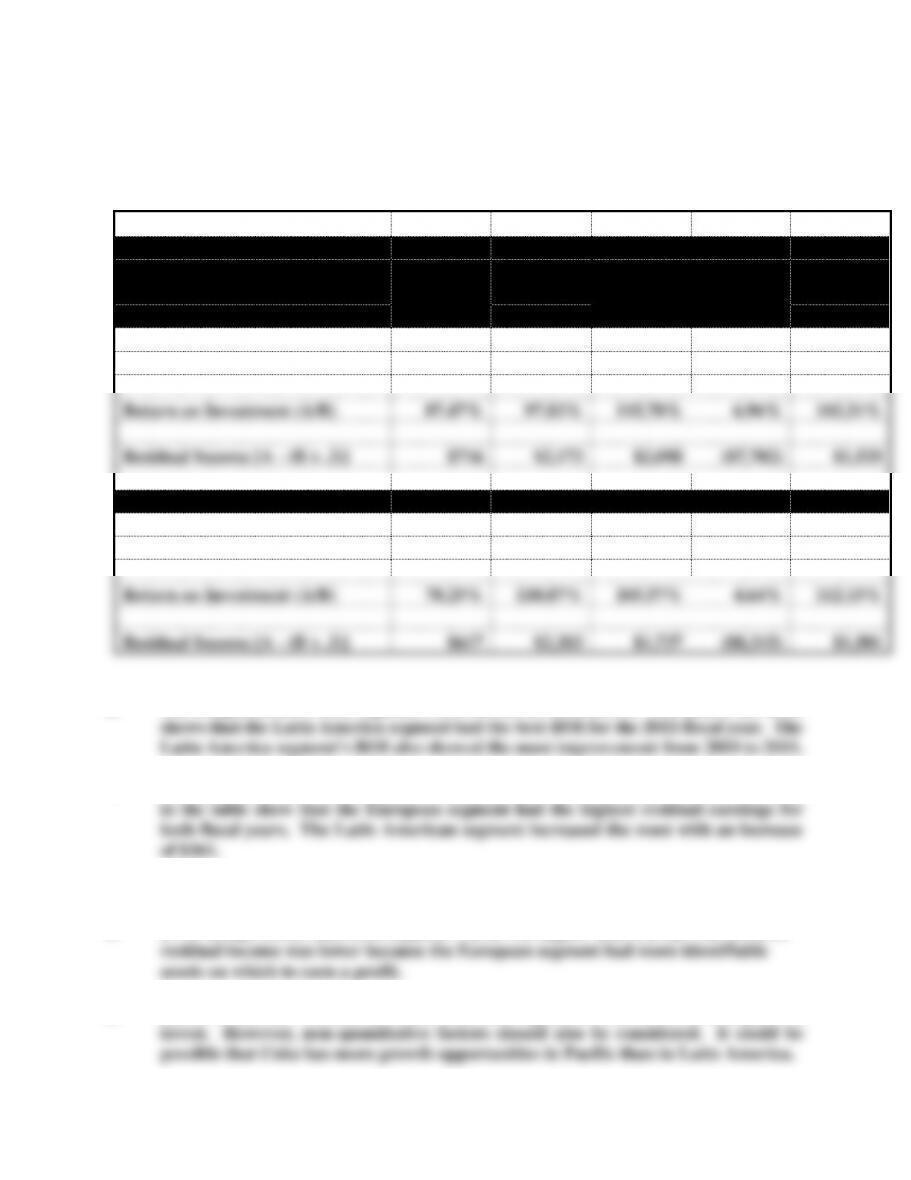
Return on Investment (A/B)
87.47%
97.82%
115.78%
6.96%
103.31%
Residual Income [A - (B x .3)]
$716
$2,173
$2,098
($7,702)
$1,529
2010 FY
(A) Segment income
1,000
3,020
2,426
1,523
2,049
(B) Identifiable assets
1,278
2,724
2,298
32,793
1,827
Return on Investment (A/B)
78.25%
110.87%
105.57%
4.64%
112.15%
Residual Income [A - (B x .3)]
$617
$2,203
$1,737
($8,315)
$1,501
a. The computations of each segment’s ROI are in the table above. The data in the table
b. The computations of each segment’s residual income are in the table above. The data
ATC 15-1 (continued)
c. Even though Latin American segment’s ROI was higher than Europe’s in 2011, its
d. Based on the ROI’s alone, the Latin American segment seems to be the best place to
Chapter 15 Performance Evaluation
15-11
ATC 15-5
a. Mr. Dawson is hoping that his workers will work faster if they think the standard is 21
b. In the short-term the workers may very well try to meet the 21 minute standard. If they
In the long-run, several problems may arise. If they cannot meet the standard, they may
become disillusioned with the standard costing system and simply stop trying to work
efficiently. This could lead to even poorer performance due to their having no faith in the
If the workers should learn that Mr. Dawson has lied to them about the proper standard,
his effectiveness as a manager will be greatly compromised. In the future, anytime they


