Chapter 12 Cost Accumulation, Tracing, and Allocation
12-1
a.
1. Product
2. Fixed
3. Indirect
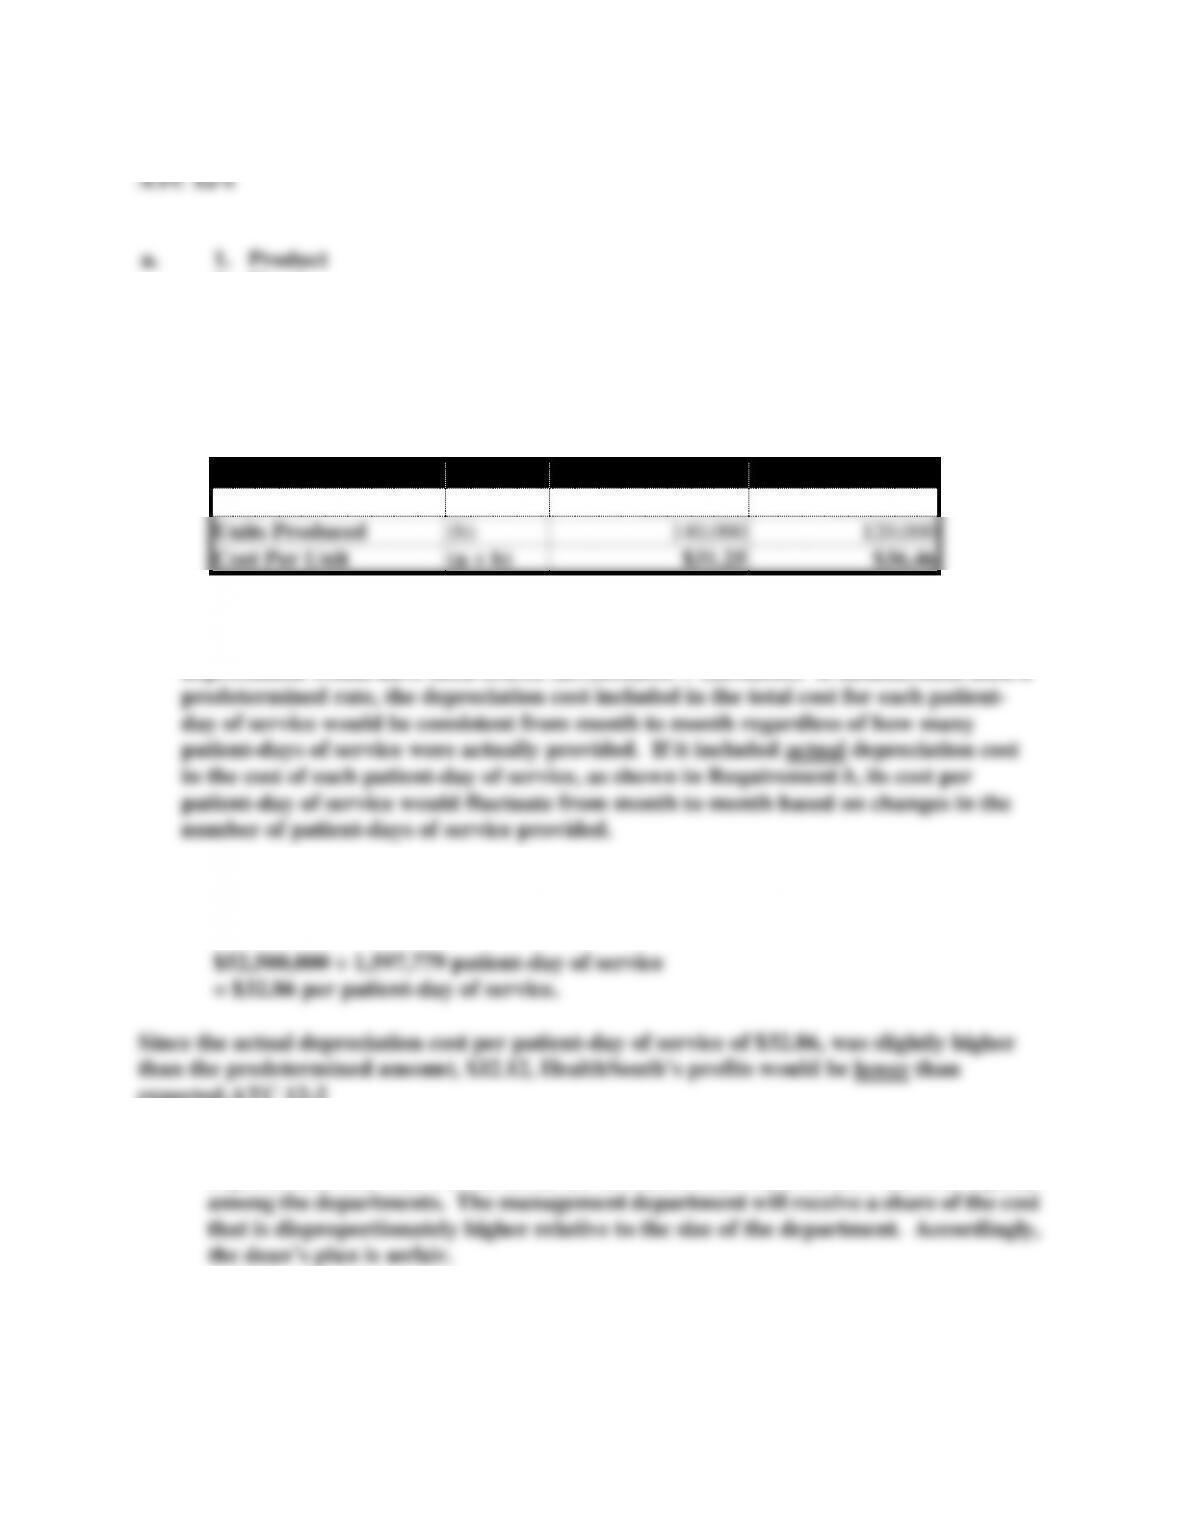
b. Based on “actual” costs and actual production levels for each month independently,
the cost per unit for February and March would be:
February
March
Total Cost
(a)
$4,375,000
$4,375,000
Units Produced
(b)
140,000
120,000
Cost Per Unit
(a ÷ b)
$31.25
$36.46
c. If HealthSouth expected its annual depreciation cost to be $53,000,000 and its annual
service level to be 1,650,000 patient-days of service, its predetermined cost for
depreciation would have been $32.12 ($53,000,000 ÷ 1,650,000). If HealthSouth used a
d. Based on actual depreciation costs and actual service level for the entire year, the
depreciation per patient-day of service would be:
$52,500,000 ÷ 1,597,779 patient-day of service
= $32.86 per patient-day of service.
expected.ATC 12-2
a. Since the accounting and marketing departments are larger than the management
department, they will benefit from an allocation base that divides the cost equally
b. It is in the self-interest of each department to minimize the amount of the overhead
cost allocation. By minimizing total cost, operating income will be maximized, and
the department will thereby receive the largest amount of discretionary funding. The
Chapter 12 Cost Accumulation, Tracing, and Allocation
12-2
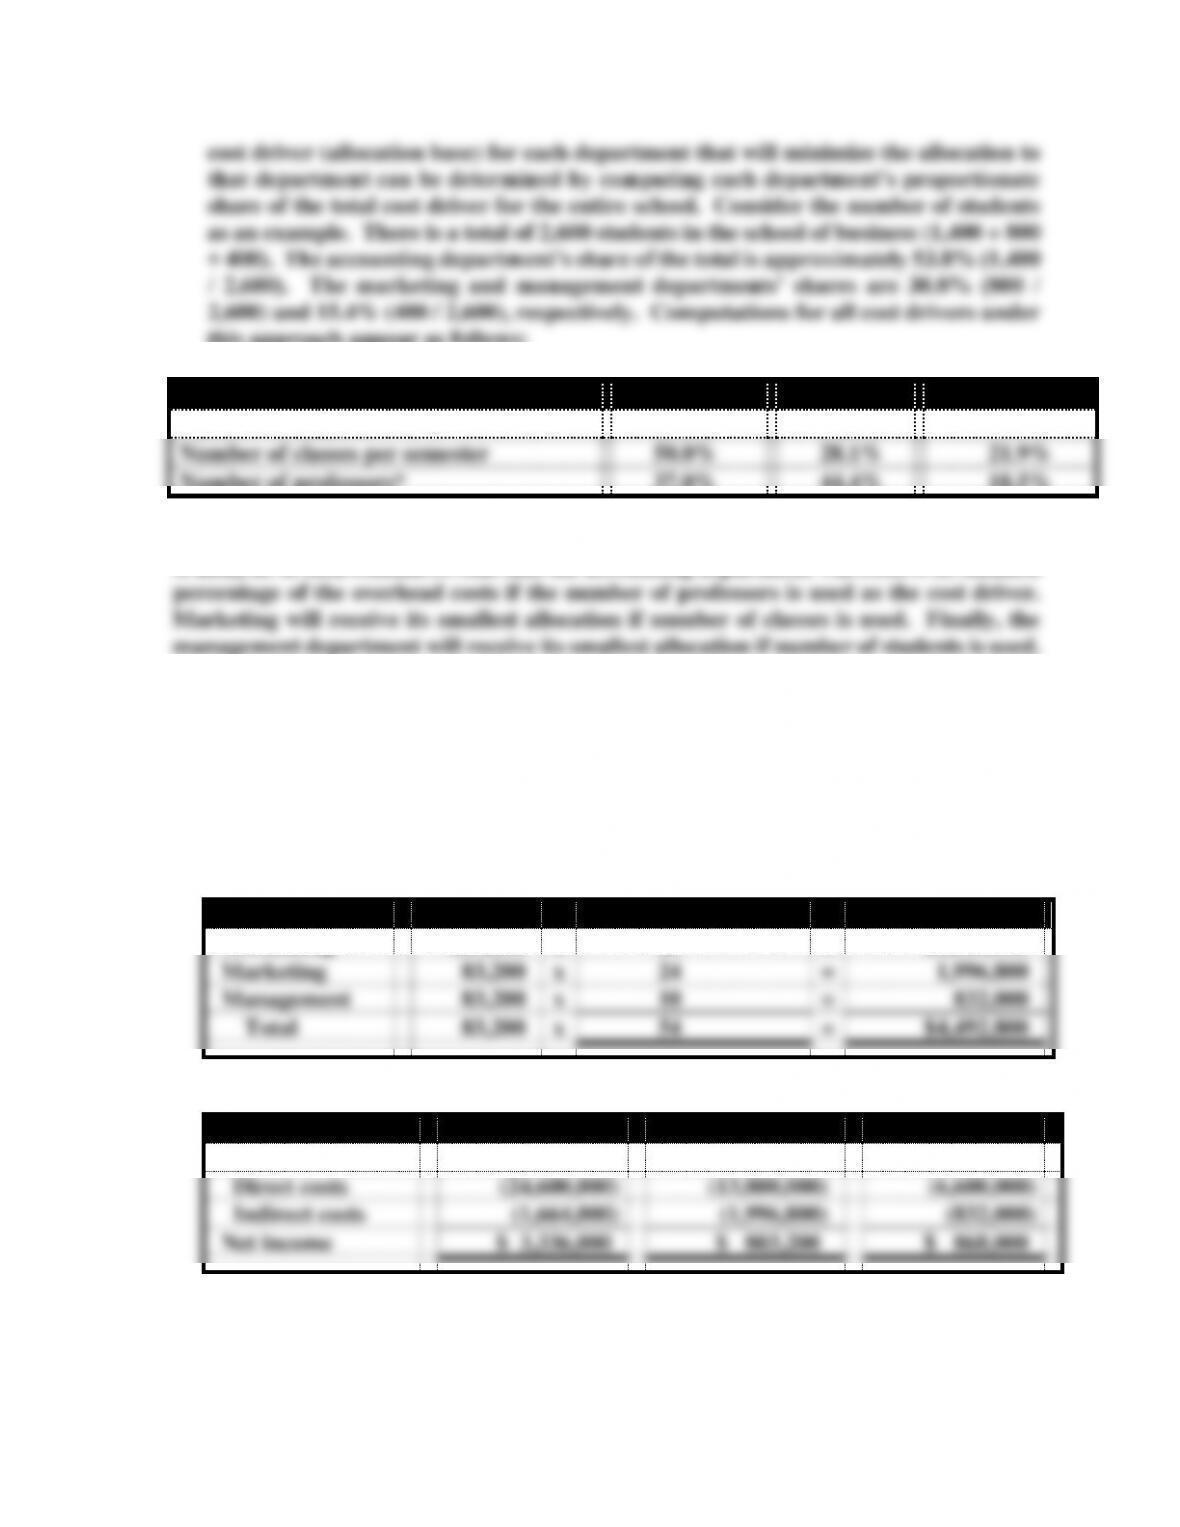
this approach appear as follows:
Cost Driver
Accounting
Marketing
Management
Number of students
53.8%
30.8%
15.4%
Number of classes per semester
50.0%
28.1%
21.9%
Number of professors*
37.0%
44.4%
18.5%
*The percentages do not add up to 100% because of rounding error.
A analysis of each column reveals that the accounting department will receive its smallest
ATC 12-2 (continued)
c. The groups in the section representing the accounting department should base their
allocation on number of professors. The following allocation results:
Allocation rate : Cost to be allocated / Cost driver = Allocation rate
$4,492,800 / 54 =$83,200 per professor
Department
Rate
x
No. of Professors
=
Allocated Cost
Accounting
$83,200
x
20
=
$1,664,000
Marketing
83,200
x
24
=
1,996,800
Management
83,200
x
10
=
832,000
Total
83,200
x
54
=
$4,492,800
Income Statements
Accounting
Marketing
Management
Revenue
$29,600,000
$16,600,000
$8,300,000
Direct costs
(24,600,000)
(13,800,000)
(6,600,000)
Indirect costs
(1,664,000)
(1,996,800)
(832,000)
Net income
$ 3,336,000
$ 803,200
$ 868,000
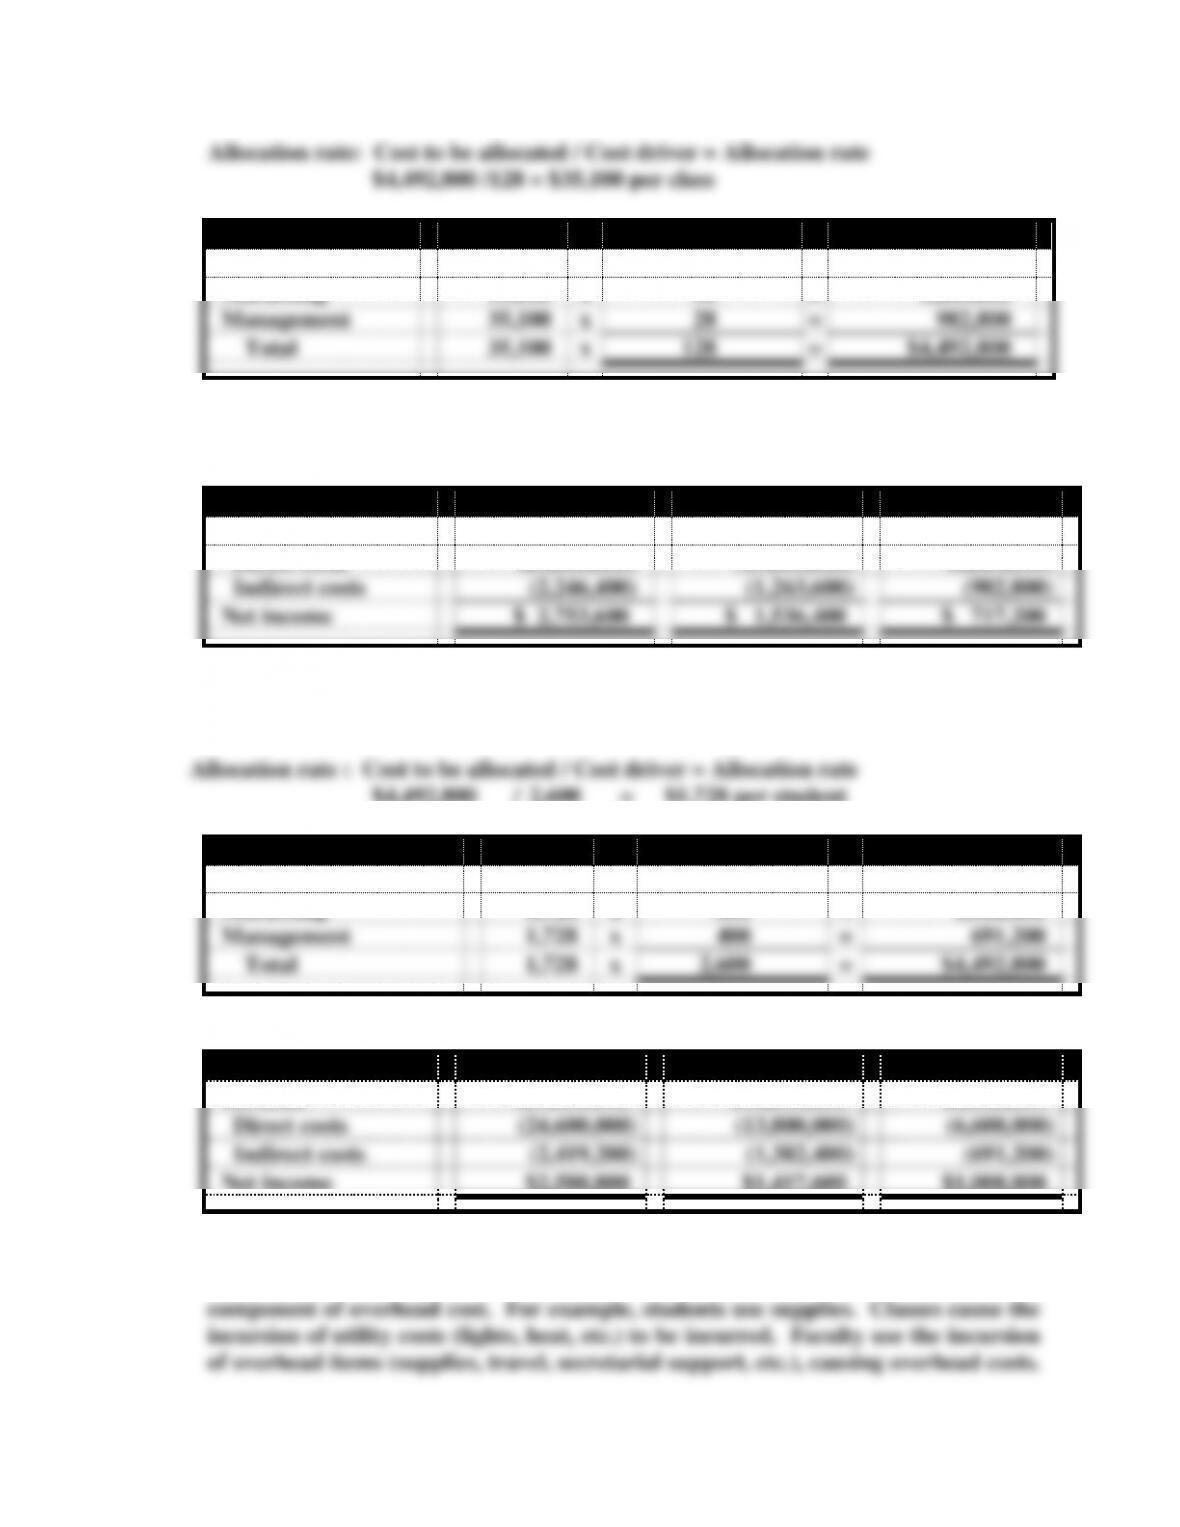
The groups in the section representing the marketing department should base their
allocation on number of classes per semester. The following allocation results:
Chapter 12 Cost Accumulation, Tracing, and Allocation
12-3
Department
Rate
x
No. of Classes
=
Allocated Cost
Accounting
$35,100
x
64
=
$2,246,400
Marketing
35,100
x
36
=
1,263,600
Management
35,100
x
28
=
982,800
Total
35,100
x
128
=
$4,492,800
ATC 12-2 (continued)
Income Statements
Accounting
Marketing
Management
Revenue
$29,600,000
$16,600,000
$8,300,000
Direct costs
(24,600,000)
(13,800,000)
(6,600,000)
Indirect costs
(2,246,400)
(1,263,600)
(982,800)
Net income
$ 2,753,600
$ 1,536,400
$ 717,200
The groups in the section representing the management department should base their
allocation on number of students. The following allocation should result:
Allocation rate : Cost to be allocated / Cost driver = Allocation rate
$4,492,800 / 2,600 = $1,728 per student
Department
Rate
x
No. Students
=
Allocated Cost
Accounting
$1,728
x
1,400
=
$2,419,200
Marketing
1,728
x
800
=
1,382,400
Management
1,728
x
400
=
691,200
Total
1,728
x
2,600
=
$4,492,800
Income Statements
Accounting
Marketing
Management
Revenue
$29,600,000
$16,600,000
$8,300,000
Direct costs
(24,600,000)
(13,800,000)
(6,600,000)
Indirect costs
(2,419,200)
(1,382,400)
(691,200)
Net income
$2,580,800
$1,417,600
$1,008,800
d. Many rational arguments are possible for each scenario. However, each argument
should establish a logical link between the allocation base and some identifiable
Chapter 12 Cost Accumulation, Tracing, and Allocation
12-4
ATC 12-3
a. Item 2 explains that shipping and handling costs are included within “costs of goods
sold.” Thus, these costs are not included in manufacturing costs. Some companies do
b. A good cost driver would be the weight of the products shipped. If individual products
were of approximately the same weight, i.e., a bottle of Dr. Pepper weighs the same as
c. In order to avoid unreasonable fluctuations in the cost per unit of beverages resulting
d. Soft drinks are a somewhat seasonal product; that is, customers drink more soft drinks
ATC 12-4
Each memo will be unique. Even so, the student should take the position that the current
cost driver (number of units) is an appropriate allocation base. The most appropriate cost
driver is the one that reflects the factors that cause overhead to be incurred. In the case of
ATC 12-5
a. The answer to the question as to “Who should pay?” is a matter of opinion.
b. Allocation could be used to spread the cost of disability services evenly over all courses.
For example, this cost could be treated as any other overhead cost. It would add $240

Chapter 12 Cost Accumulation, Tracing, and Allocation
12-5