Chapter 12 Cost Accumulation, Tracing, and Allocation
12-1
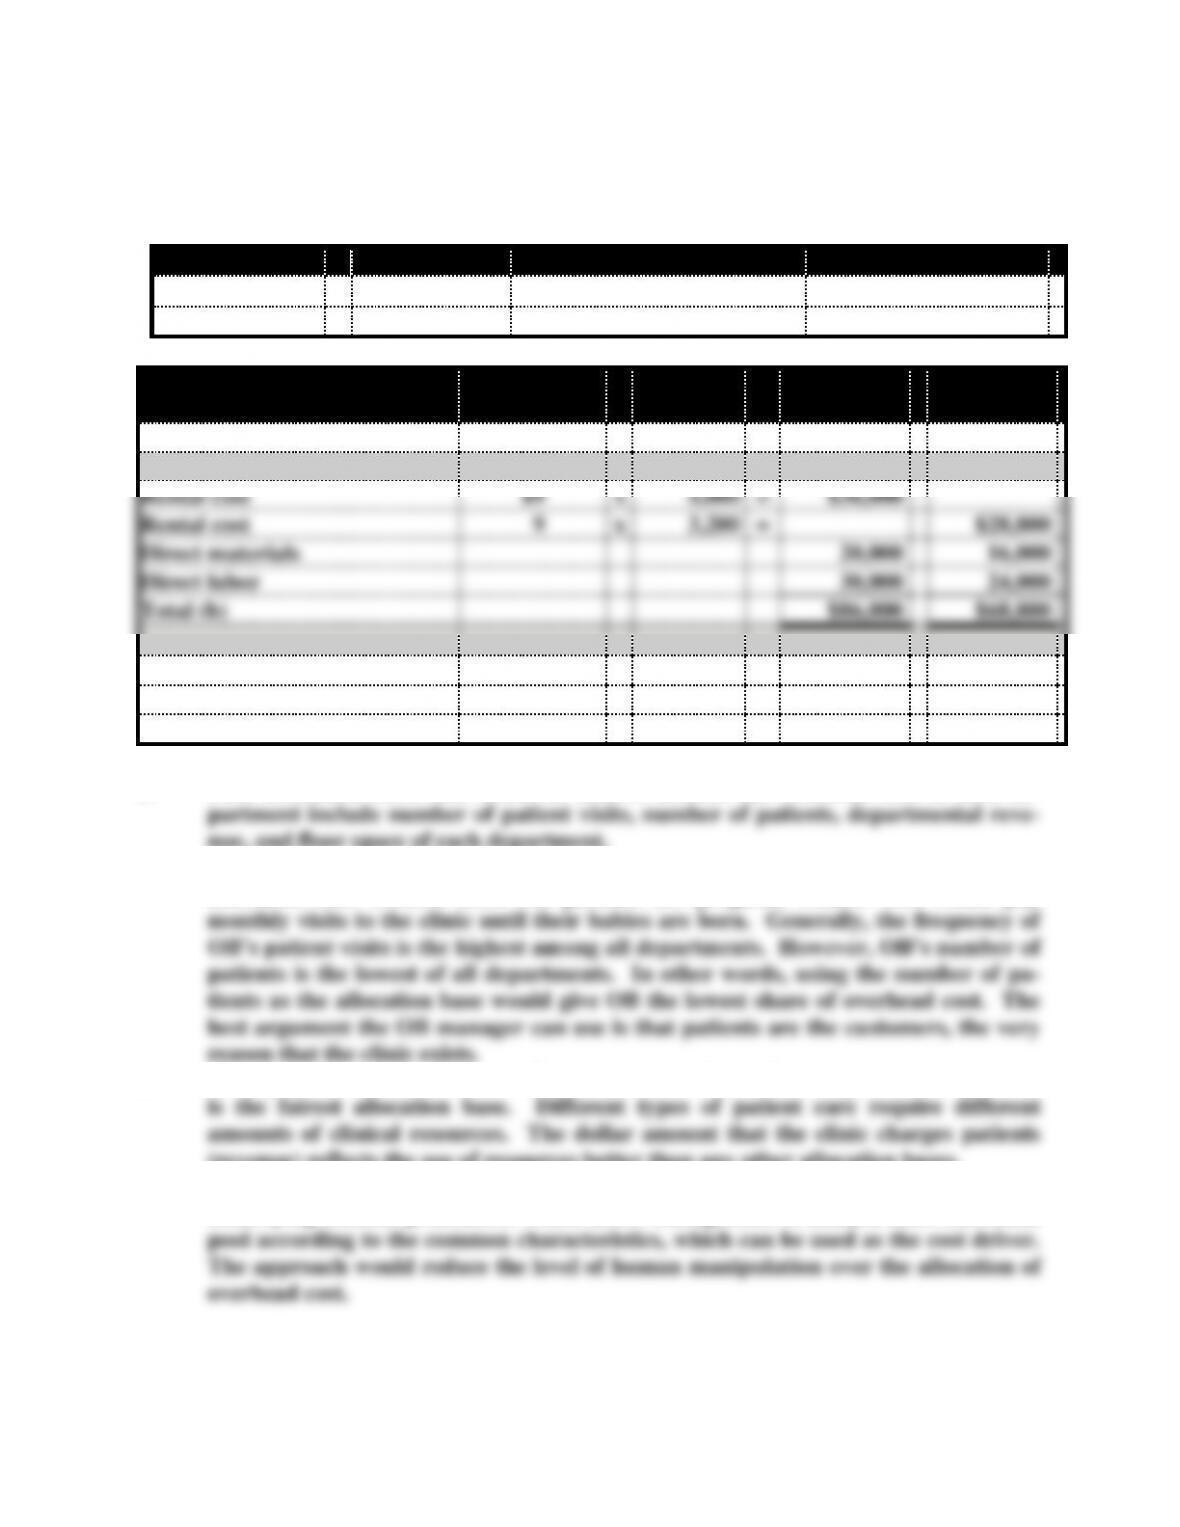
Exercise 12-12
The allocation rate is computed below:
Cost
÷
Base
Computation
Allocation Rate
Rental cost
÷
No. units
$360,000 ÷ 40,000 =
$9 per unit
Allocation
Rate
x
Weight
of Base
=
January
February
Number of units (a)
4,000
3,200
Rental cost
$9
x
4,000
=
$36,000
Rental cost
9
x
3,200
=
$28,800
Direct materials
20,000
16,000
Direct labor
30,000
24,000
Total (b)
$86,000
$68,800
Cost per unit [c =(b ÷ a)]
$21.50
$21.50
Price (c x 1.40)
$30.10
$30.10
Exercise 12-1
a. Four allocation bases that could be used to allocate the overhead cost to each de-
nue, and floor space of each department.
b. The manager of OB would most likely recommend the number of patients as the
allocation base because most OB patients are pregnant women who would pay
c. If the president cares about the financial health of the clinic, departmental revenue
(revenue) reflects the use of resources better than any other allocation bases.
d. Classifying overhead costs into separate pools based on the characteristics of the
underlying medical procedures would allow management to analyze each individual
Problem 12-14
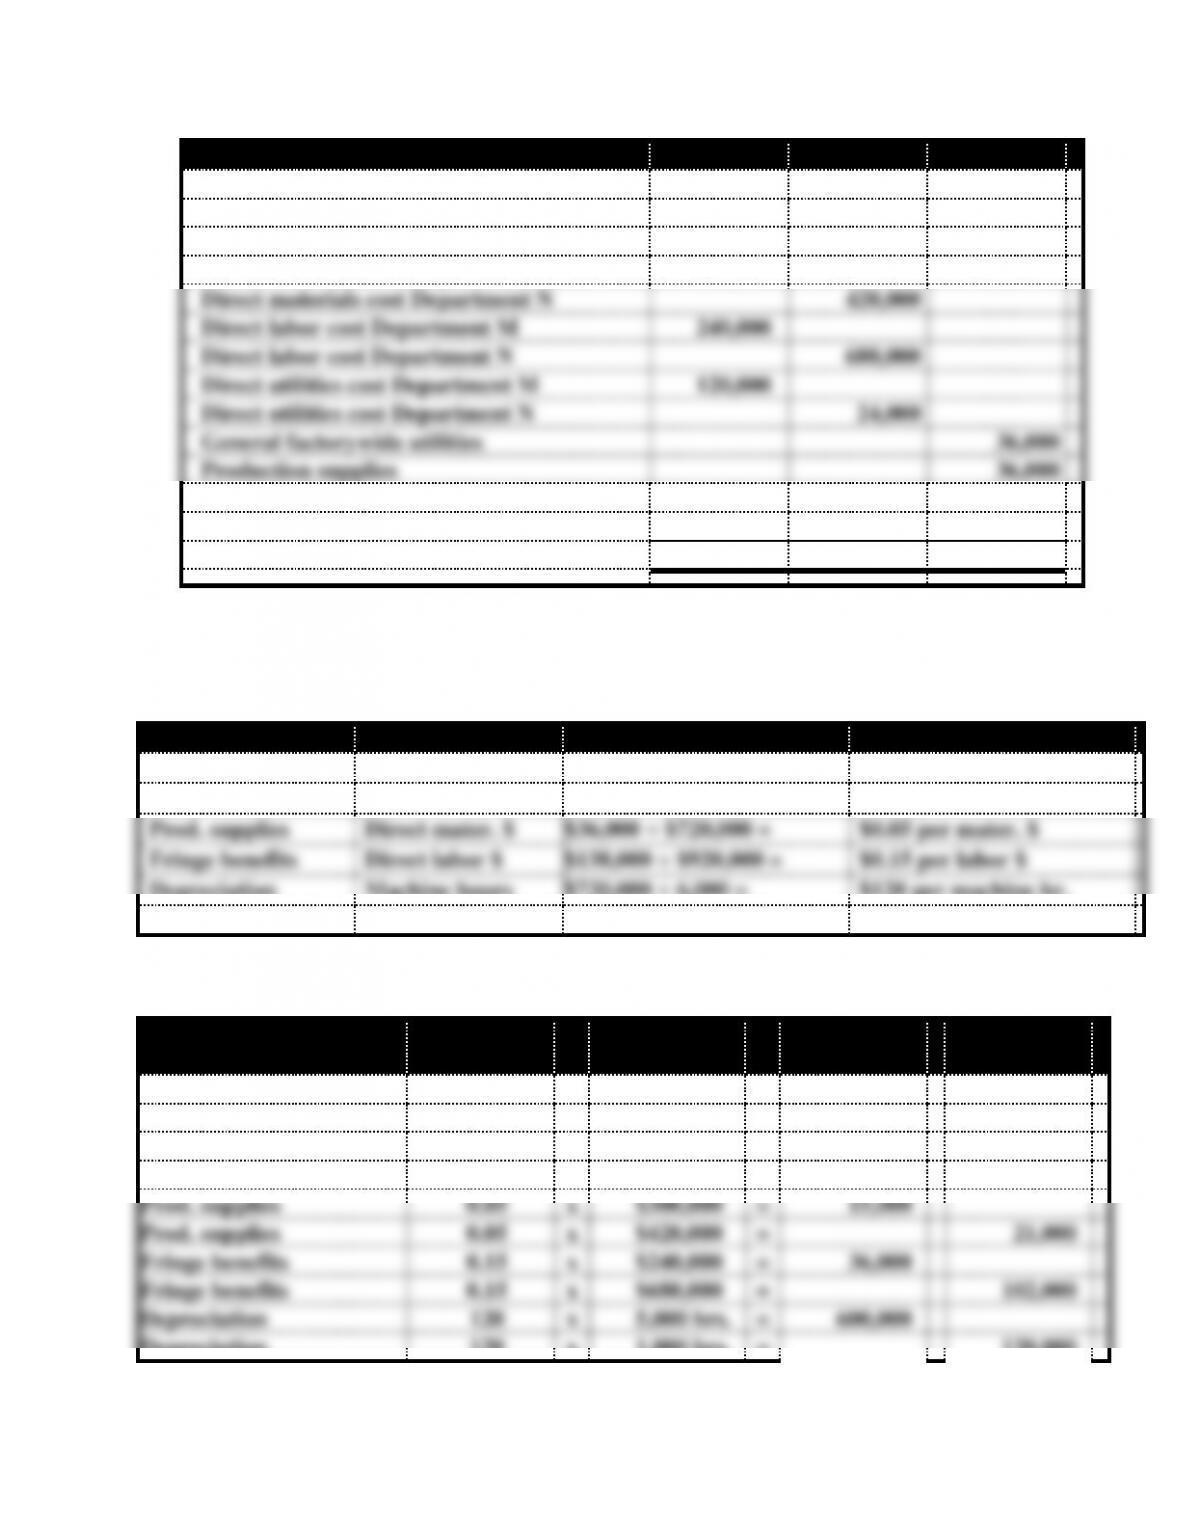
Chapter 12 Cost Accumulation, Tracing, and Allocation
12-2
Cost Assignment Categories
Dept. M
Dept. N
Indirect
Salary of V. P. of production division
$ 200,000
Salary of supervisor Department M
$ 80,000
Salary of supervisor Department N
$ 60,000
Direct materials cost Department M
300,000
Direct materials cost Department N
420,000
Direct labor cost Department M
240,000
Direct labor cost Department N
680,000
Direct utilities cost Department M
120,000
Direct utilities cost Department N
24,000
General factorywide utilities
36,000
Production supplies
36,000
Fringe benefits
138,000
Depreciation
720,000
Total costs
$740,000
$1,184,000
$1,130,000
b. The following bases were used to allocate the various indirect costs. Logical
arguments for other bases may be possible. The bases and computations used
herein are as follows:
Cost
Base
Computation
Allocation Rate
Salary of VP
No. of depts.
$200,000 ÷ 2 =
$100,000 per dept.
General utilities
Direct utility $
$36,000 ÷ $144,000 =
$0.25 per utility $
Prod. supplies
Direct mater. $
$36,000 ÷ $720,000 =
$0.05 per mater. $
Fringe benefits
Direct labor $
$138,000 ÷ $920,000 =
$0.15 per labor $
Depreciation
Machine hours
$720,000 ÷ 6,000 =
$120 per machine hr.
Problem 12-14 (continued)
Indirect
Costs
Allocation
Rate
x
Weight
of Base
=
Allocated
To Dept. M
Allocated
To Dept. N
Salary of VP
$100,000
x
1 dept.
=
$100,000
Salary of VP
100,000
x
1 dept.
=
$100,000
General utilities
0.25
x
$120,000
=
30,000
General utilities
0.25
x
$24,000
=
6,000
Prod. supplies
0.05
x
$300,000
=
15,000
Prod. supplies
0.05
x
$420,000
=
21,000
Fringe benefits
0.15
x
$240,000
=
36,000
Fringe benefits
0.15
x
$680,000
=
102,000
Depreciation
120
x
5,000 hrs.
=
600,000
Depreciation
120
x
1,000 hrs.
=
120,000
a.
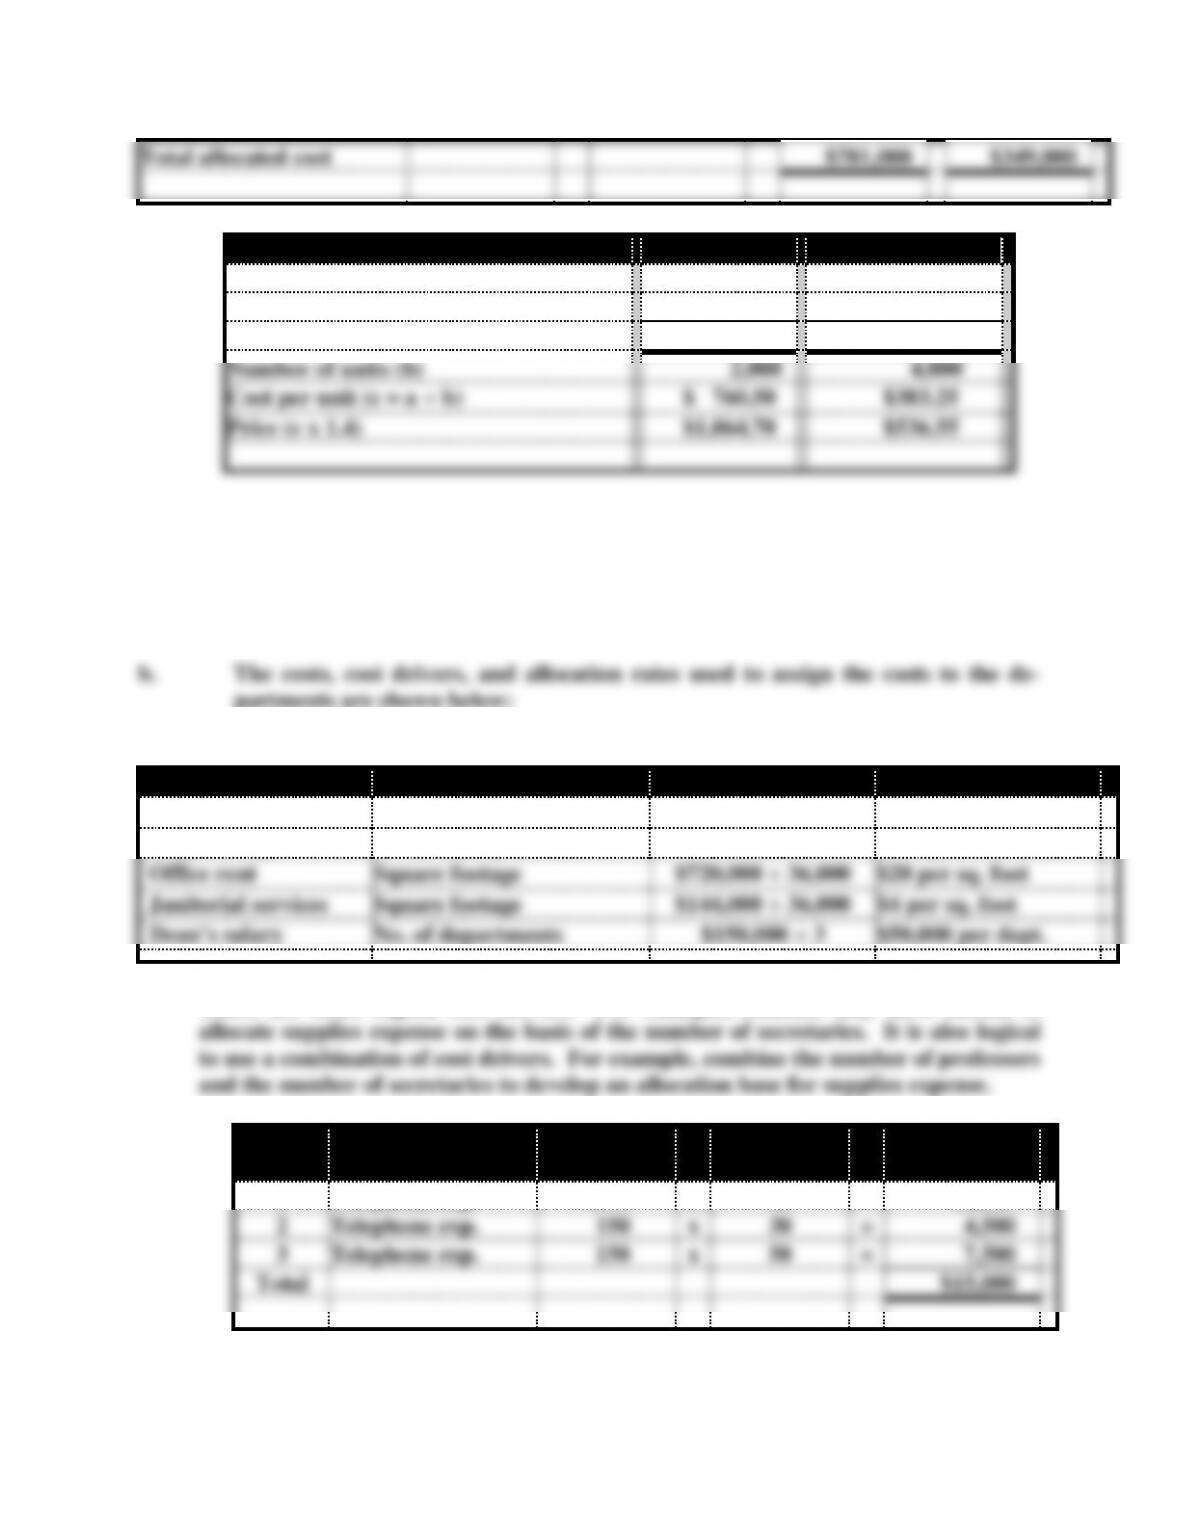
Chapter 12 Cost Accumulation, Tracing, and Allocation
12-3
Total allocated cost
$781,000
$349,000
Department
M
N
Total direct cost
$ 740,000
$1,184,000
Total indirect cost
781,000
349,000
Total production costs (a)
$1,521,000
$1,533,000
Number of units (b)
2,000
4,000
Cost per unit (c = a ÷ b)
$ 760.50
$383.25
Price (c x 1.4)
$1,064.70
$536.55
Problem 12-15
a. The objective is to determine the cost of operating each department. According-
ly, the cost objects are Departments 1, 2, and 3.
Problem 12-15 (continued)
Cost
Base
Computation
Allocation Rate
Telephone exp.
Number of telephones
$15,000 ÷ 100 =
$150 per telephone
Supplies exp.
No. of faculty members
$24,000 ÷ 60 =
$400 per instructor
Office rent
Square footage
$720,000 ÷ 36,000
$20 per sq. foot
Janitorial services
Square footage
$144,000 ÷ 36,000
$4 per sq. foot
Dean’s salary
No. of departments
$150,000 ÷ 3
$50,000 per dept.
There are other logical cost drivers. For example, students may have chosen to
c.
Dept.
Cost to be
Allocated
Allocation
Rate
x
Weight
of Base
=
Amount
Allocated
1
Telephone exp.
$150
x
20
=
$3,000
2
Telephone exp.
150
x
30
=
4,500
3
Telephone exp.
150
x
50
=
7,500
Total
$15,000
c.
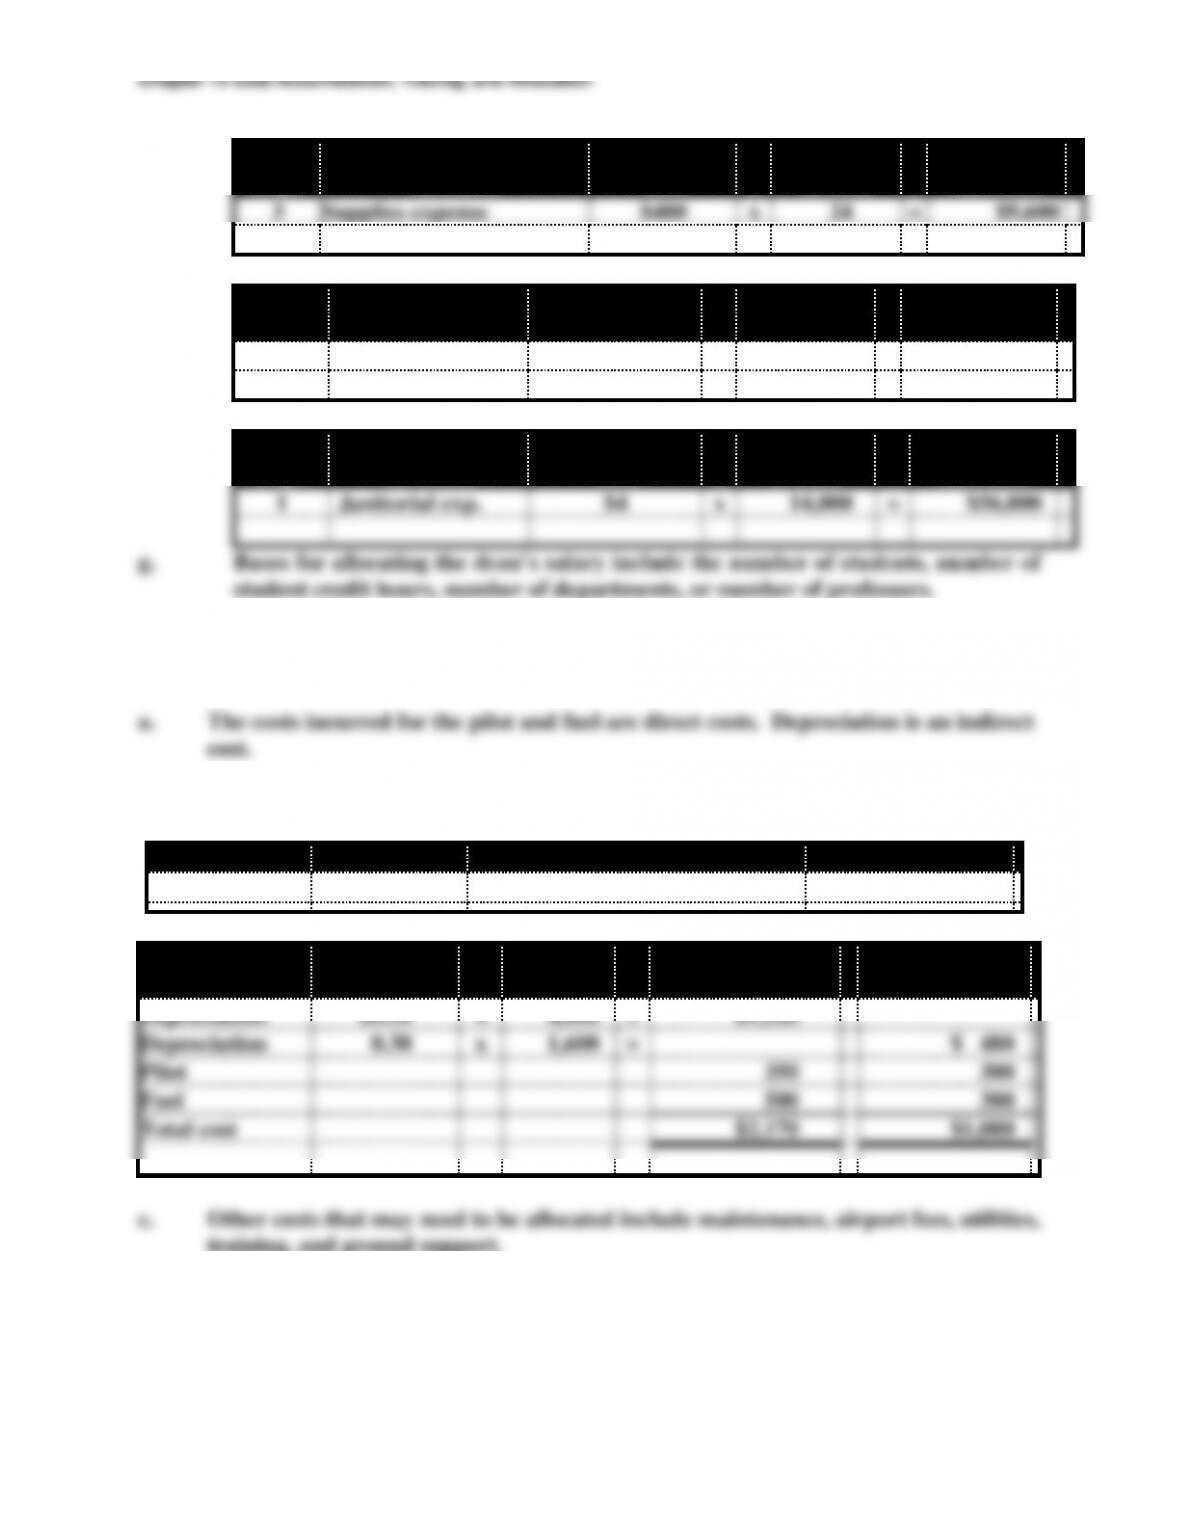
12-4
d.
Dept.
Cost to be
Allocated
Allocation
Rate
x
Weight
of Base
=
Amount
Allocated
3
Supplies expense
$400
x
24
=
$9,600
e.
Dept.
Cost to be
Allocated
Allocation
Rate
x
Weight
of Base
=
Amount
Allocated
2
Office rent
$20
x
8,000
=
$160,000
f.
Dept.
Cost to be
Allocated
Allocation
Rate
x
Weight
of Base
=
Amount
Allocated
1
Janitorial exp.
$4
x
14,000
=
$56,000
Problem 12-16
b. The allocation rate for the depreciation is determined as follows:
Cost
Base
Computation
Allocation Rate
Depreciation
No. of miles
$6,000,000 ÷ 20,000,000 =
$0.30 per mile
Costs
Allocation
Rate
x
Weight
of Base
=
Chicago to
San Francisco
Chicago to
New York
Depreciation
$0.30
x
4,400
=
$1,320
Depreciation
0.30
x
1,600
=
$ 480
Pilot
350
300
Fuel
500
300
Total cost
$2,170
$1,080
training, and ground support.
Problem 12-17
Chapter 12 Cost Accumulation, Tracing, and Allocation
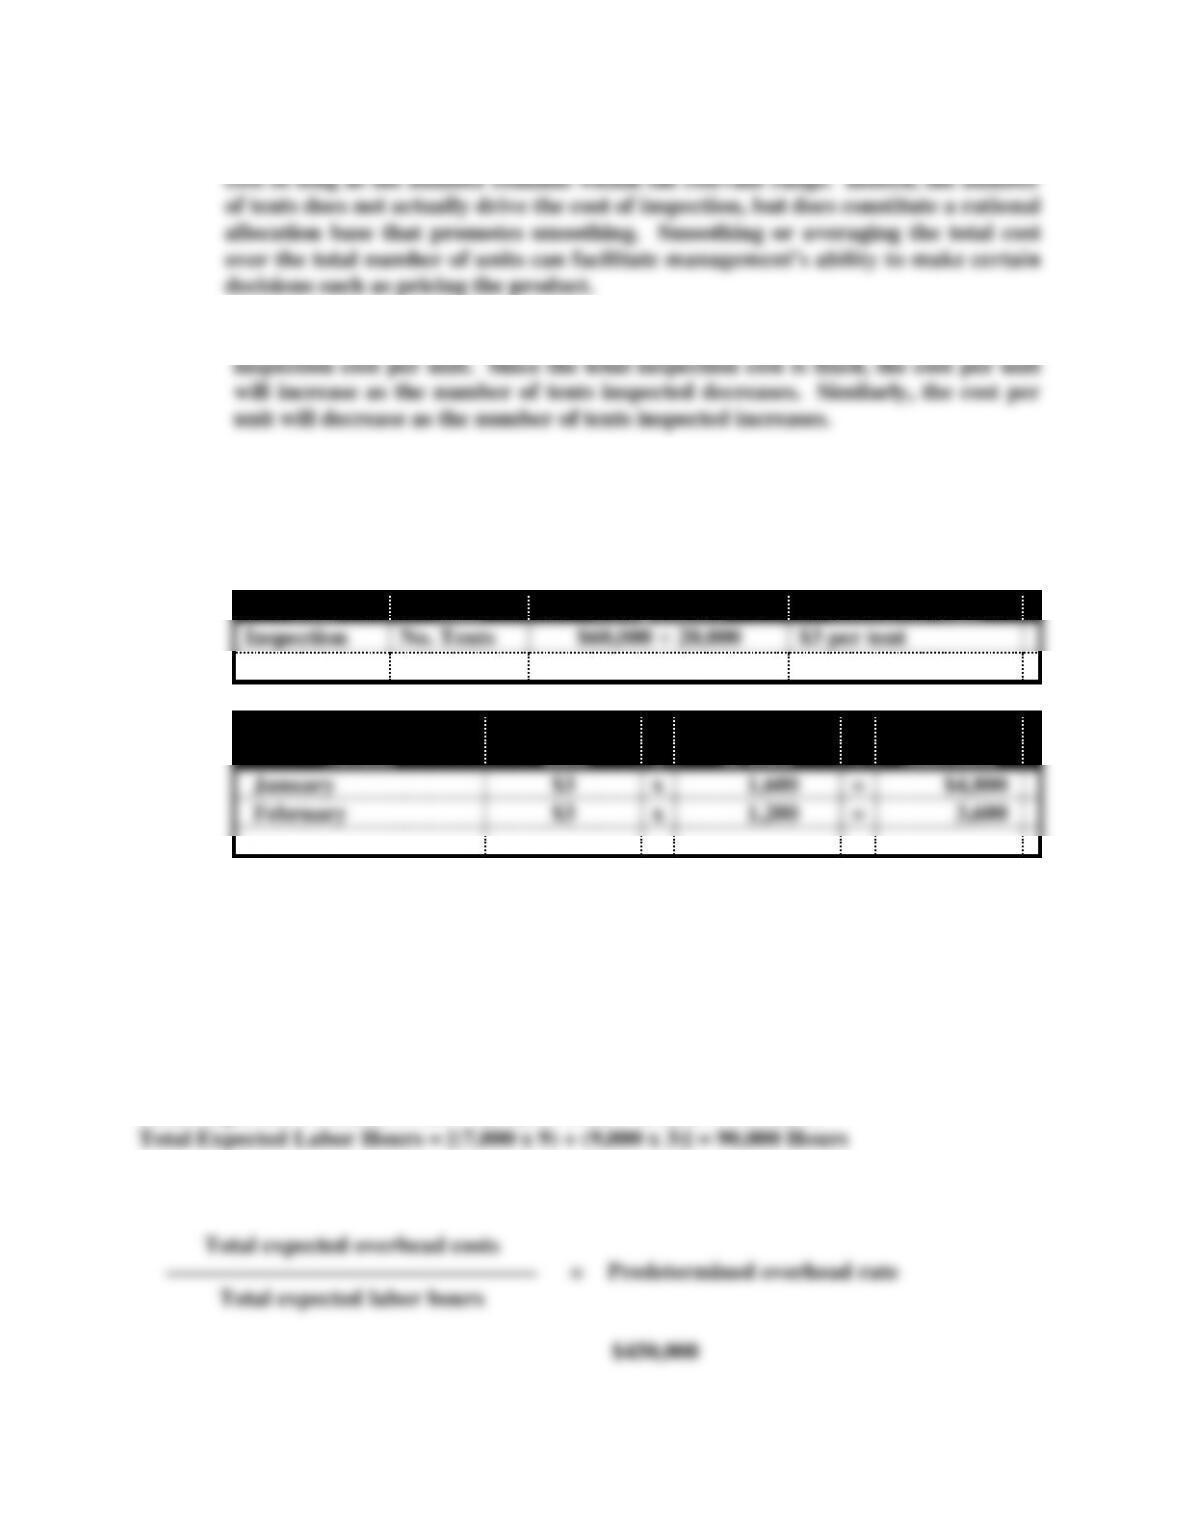
a. Changes in the number of tents inspected will not affect the total fixed inspection
b. There is an inverse relationship between the number of tents inspected and the
c. The inspector’s salary is an indirect cost. Since it is not related to the number of
units inspected, it cannot be traced to any particular unit.
d. First determine the allocation rate:
Cost
Base
Computation
Allocation Rate
Inspection
No. Tents
$60,000 ÷ 20,000
$3 per tent
Month
Allocation
Rate
x
Weight
of Base
=
Amount
Allocated
January
$3
x
1,600
=
$4,800
February
$3
x
1,200
=
3,600
Problem 12-18
a. The items used to compute the predetermined overhead rate are:
Total Expected Overhead Costs = ($30,000 x 12) + $90,000 = $450,000
The rate is computed as follows:
Total expected overhead costs
––––––––––––––––––––––––––––––––
=
Predetermined overhead rate
Total expected labor hours
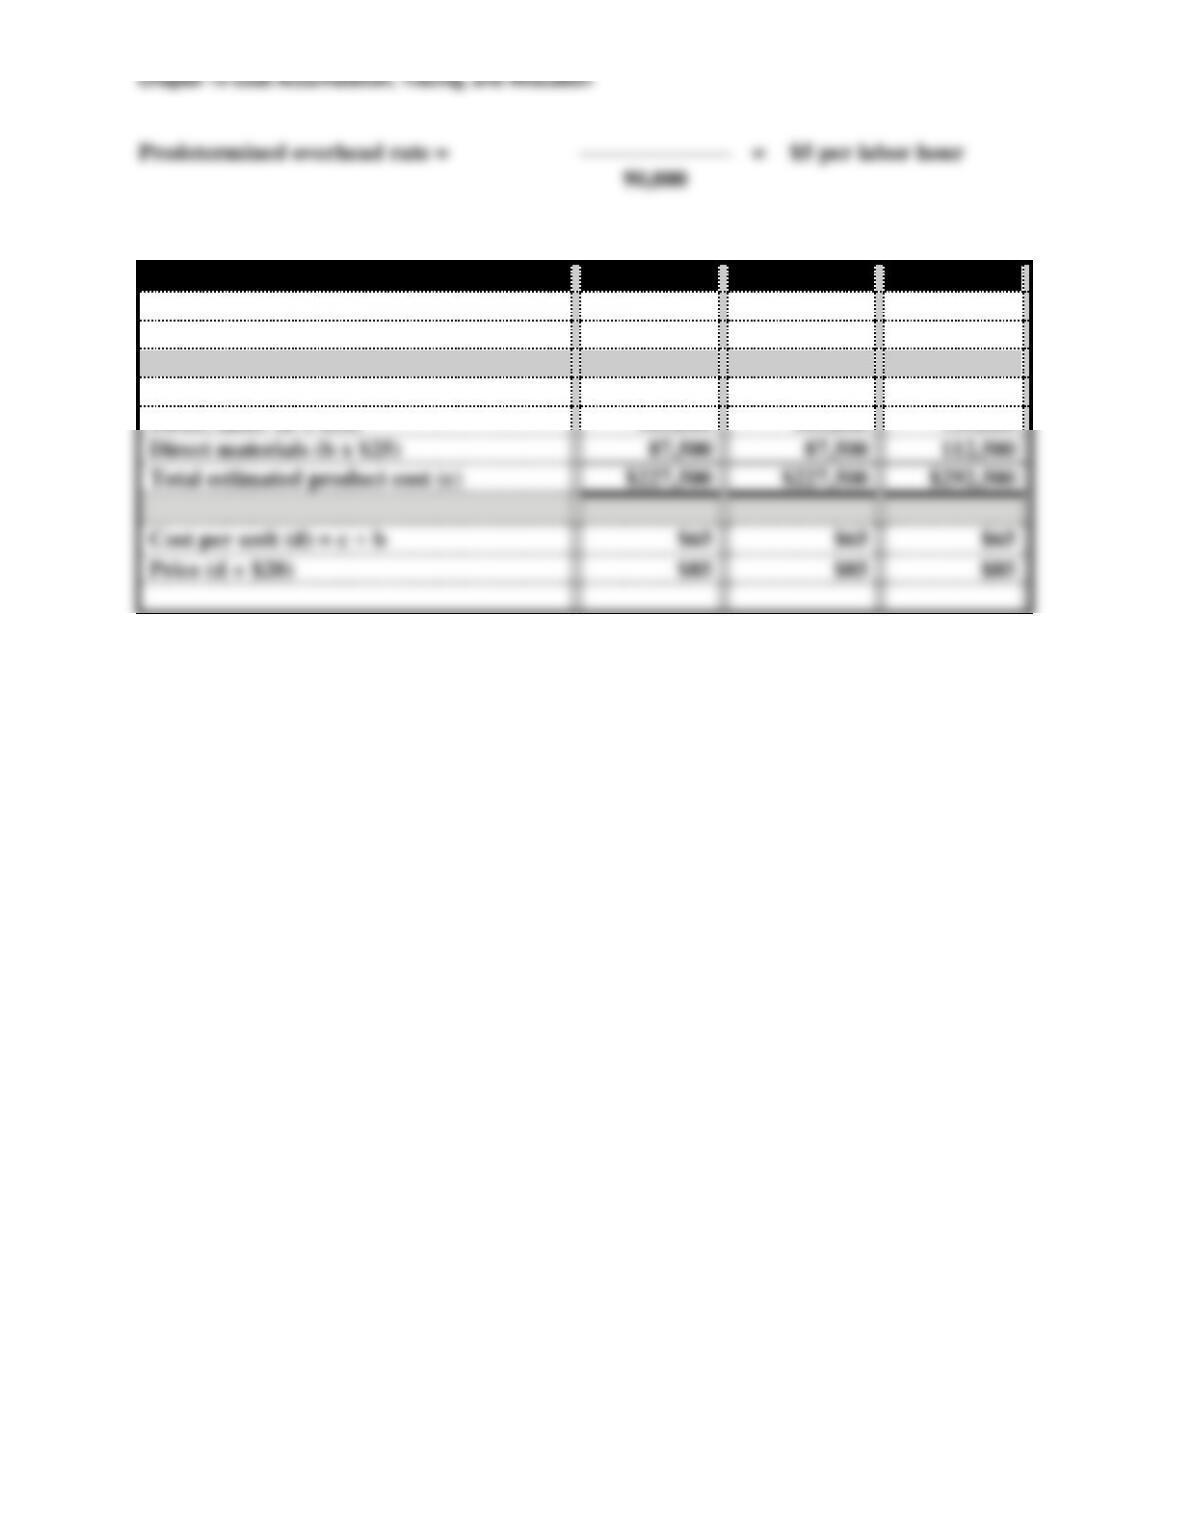
12-6
Predetermined overhead rate =
–––––––––––––
=
$5 per labor hour
90,000
b. c. & d.
January
March
August
Direct labor hours (a)
7,000
7,000
9,000
Units produced (b)
3,500
3,500
4,500
Allocated overhead cost (a x $5)
$ 35,000
$ 35,000
$ 45,000
Direct labor (b x $30)
105,000
105,000
135,000
Direct materials (b x $25)
87,500
87,500
112,500
Total estimated product cost (c)
$227,500
$227,500
$292,500
Cost per unit (d) = c ÷ b
$65
$65
$65
Price (d + $20)
$85
$85
$85
Chapter 12 Cost Accumulation, Tracing, and Allocation
12-7
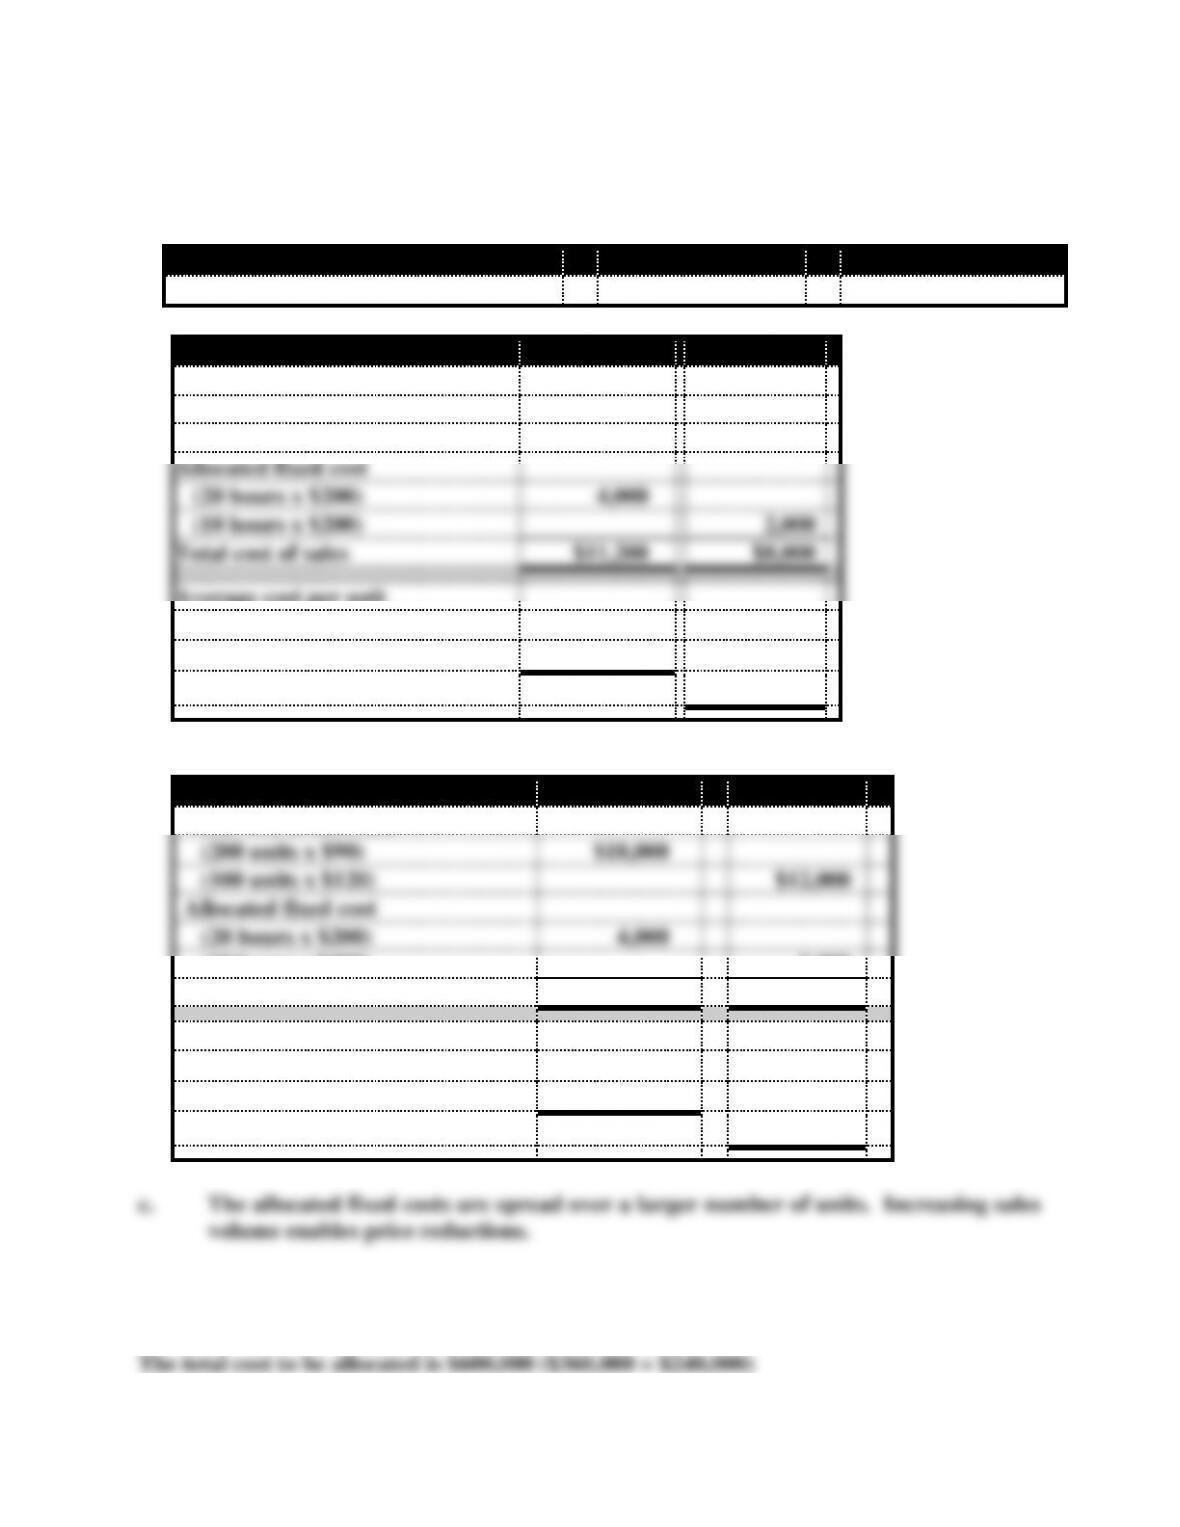
Problem 12-19
a. Determine the predetermined overhead allocation rate:
Total Estimated Overhead Cost
÷
Allocation Base
=
Allocation Rate
$6,000
÷
30 hours
=
$200 per hour
Software Package
EZRecords
ProOffice
Total cost of software
(80 units x $90)
$ 7,200
(50 units x $120)
$6,000
Allocated fixed cost
(20 hours x $200)
4,000
(10 hours x $200)
2,000
Total cost of sales
$11,200
$8,000
Average cost per unit
Total cost ÷ Number of units
($11,200 ÷ 80 units)
$140
($8,000 ÷ 50 units)
$160
b.
Software Package
EZRecords
ProOffice
Total cost of software
(200 units x $90)
$18,000
(100 units x $120)
$12,000
Allocated fixed cost
(20 hours x $200)
4,000
(10 hours x $200)
2,000
Total cost of sales
$22,000
$14,000
Average cost per unit
Total cost ÷ Number of units
($22,000 ÷ 200 units)
$110
($14,000 ÷ 100 units)
$140
Problem 12-20
Computation of allocation rates for total overhead cost
The total cost to be allocated is $600,000 ($360,000 + $240,000)
Chapter 12 Cost Accumulation, Tracing, and Allocation
12-8
Cost
÷
Base
Computation
Allocation Rate
Overhead
÷
Machine hours
$600,000 ÷ 24,000
$25 per mach. hr.
Overhead
÷
Labor hours
$600,000 ÷ 16,000
$37.50 per labor hr.
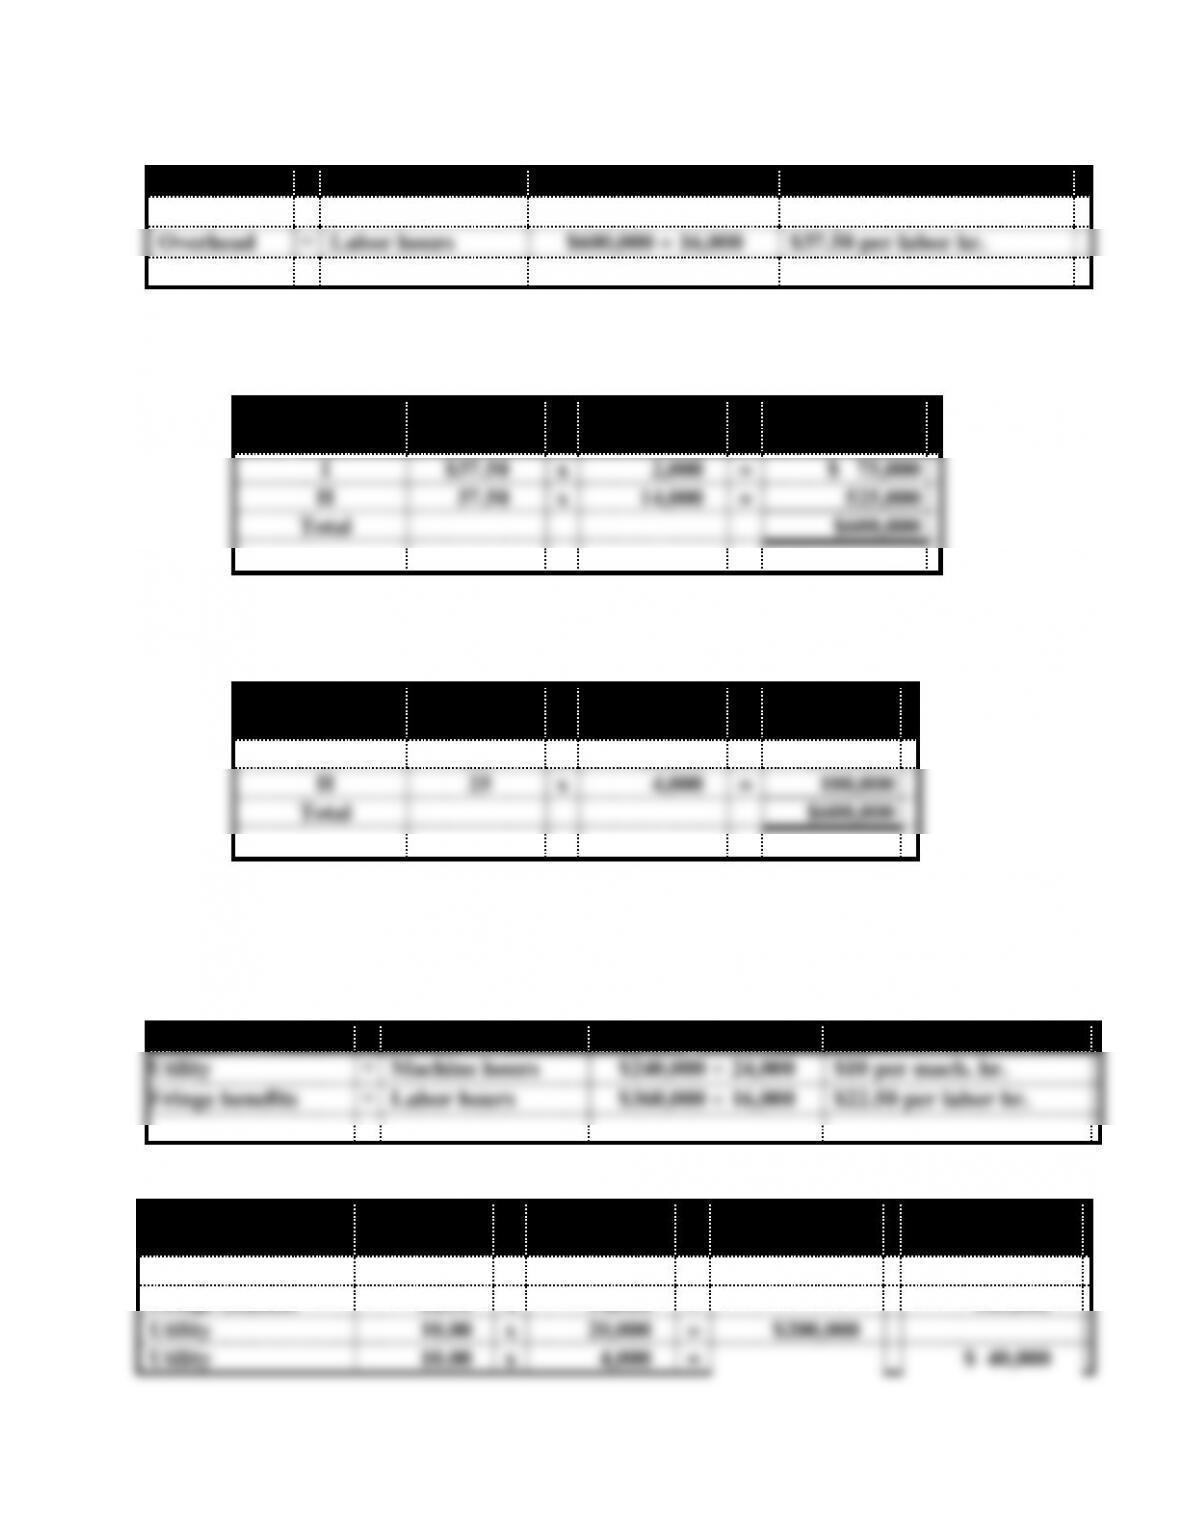
a. Since Department I uses fewer labor hours, that base will minimize the amount of
overhead cost allocated to the department.
Department
Allocation
Rate
x
Weight
of Base
=
Allocated
Cost
I
$37.50
x
2,000
=
$ 75,000
II
37.50
x
14,000
=
525,000
Total
$600,000
b. Since Department II uses less machine hours, that base will minimize the amount of
overhead costs allocated to the department.
Department
Allocation
Rate
x
Weight
of Base
=
Allocated
Cost
I
$25
x
20,000
=
$500,000
II
25
x
4,000
=
100,000
Total
$600,000
Problem 12-20 (continued)
c. Since fringe benefit costs are driven by labor hours and utility costs are driven by
machine hours, it would be fair to allocate the individual costs using separate al-
location bases. Allocation rates using separate bases are shown below:
Cost
÷
Base
Computation
Allocation Rate
Utility
÷
Machine hours
$240,000 ÷ 24,000
$10 per mach. hr.
Fringe benefits
÷
Labor hours
$360,000 ÷ 16,000
$22.50 per labor hr.
Allocations for the respective departments:
Costs
Allocation
Rate
x
Weight
of Base
=
Department I
Department II
Fringe benefits
$22.50
x
2,000
=
45,000
Fringe benefits
22.50
x
14,000
=
315,000
Utility
10.00
x
20,000
=
$200,000
Utility
10.00
x
4,000
=
$ 40,000
Chapter 12 Cost Accumulation, Tracing, and Allocation
12-9
Total
$245,000
$355,000
d. The fringe benefits and utility costs have different cost drivers. In other words,
while machine usage is causing the company to incur utility cost, the number of