Chapter 11 – Cost Behavior, Operating Leverage, and Profitability Analysis
11-1
Copyright © 2015 McGraw-Hill Education. All rights reserved. No reproduction or distribution without the prior written consent of
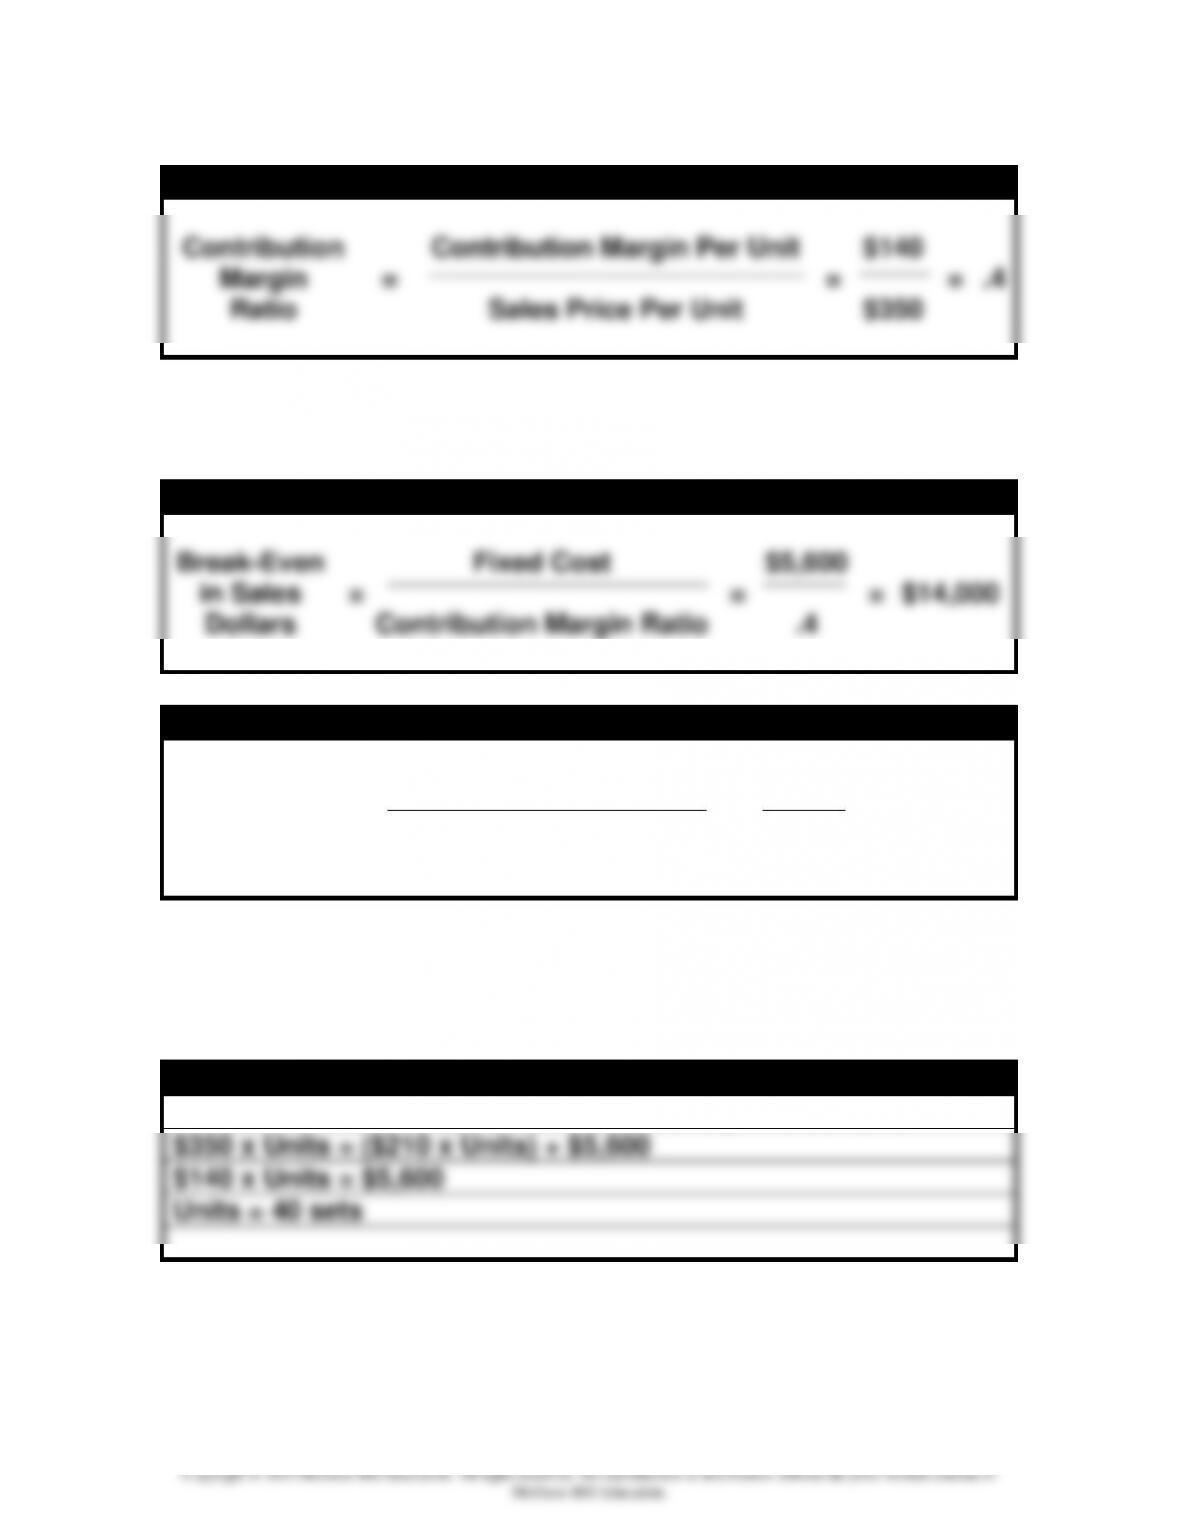
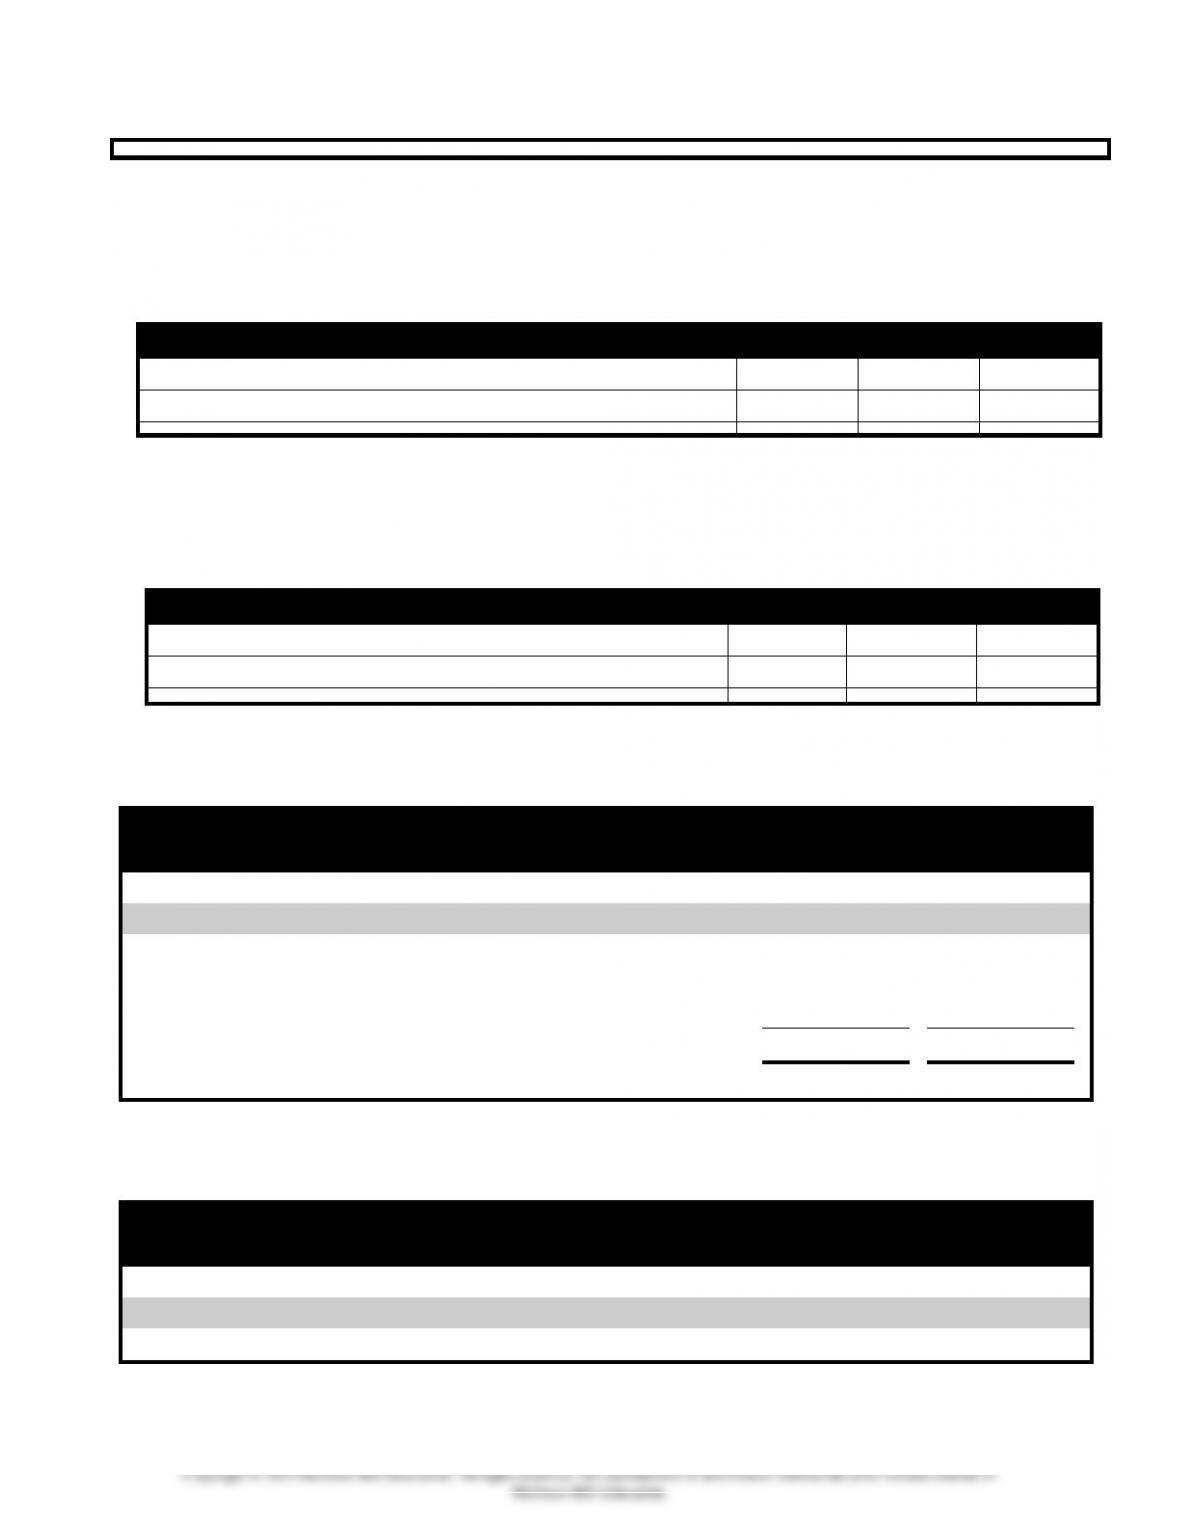
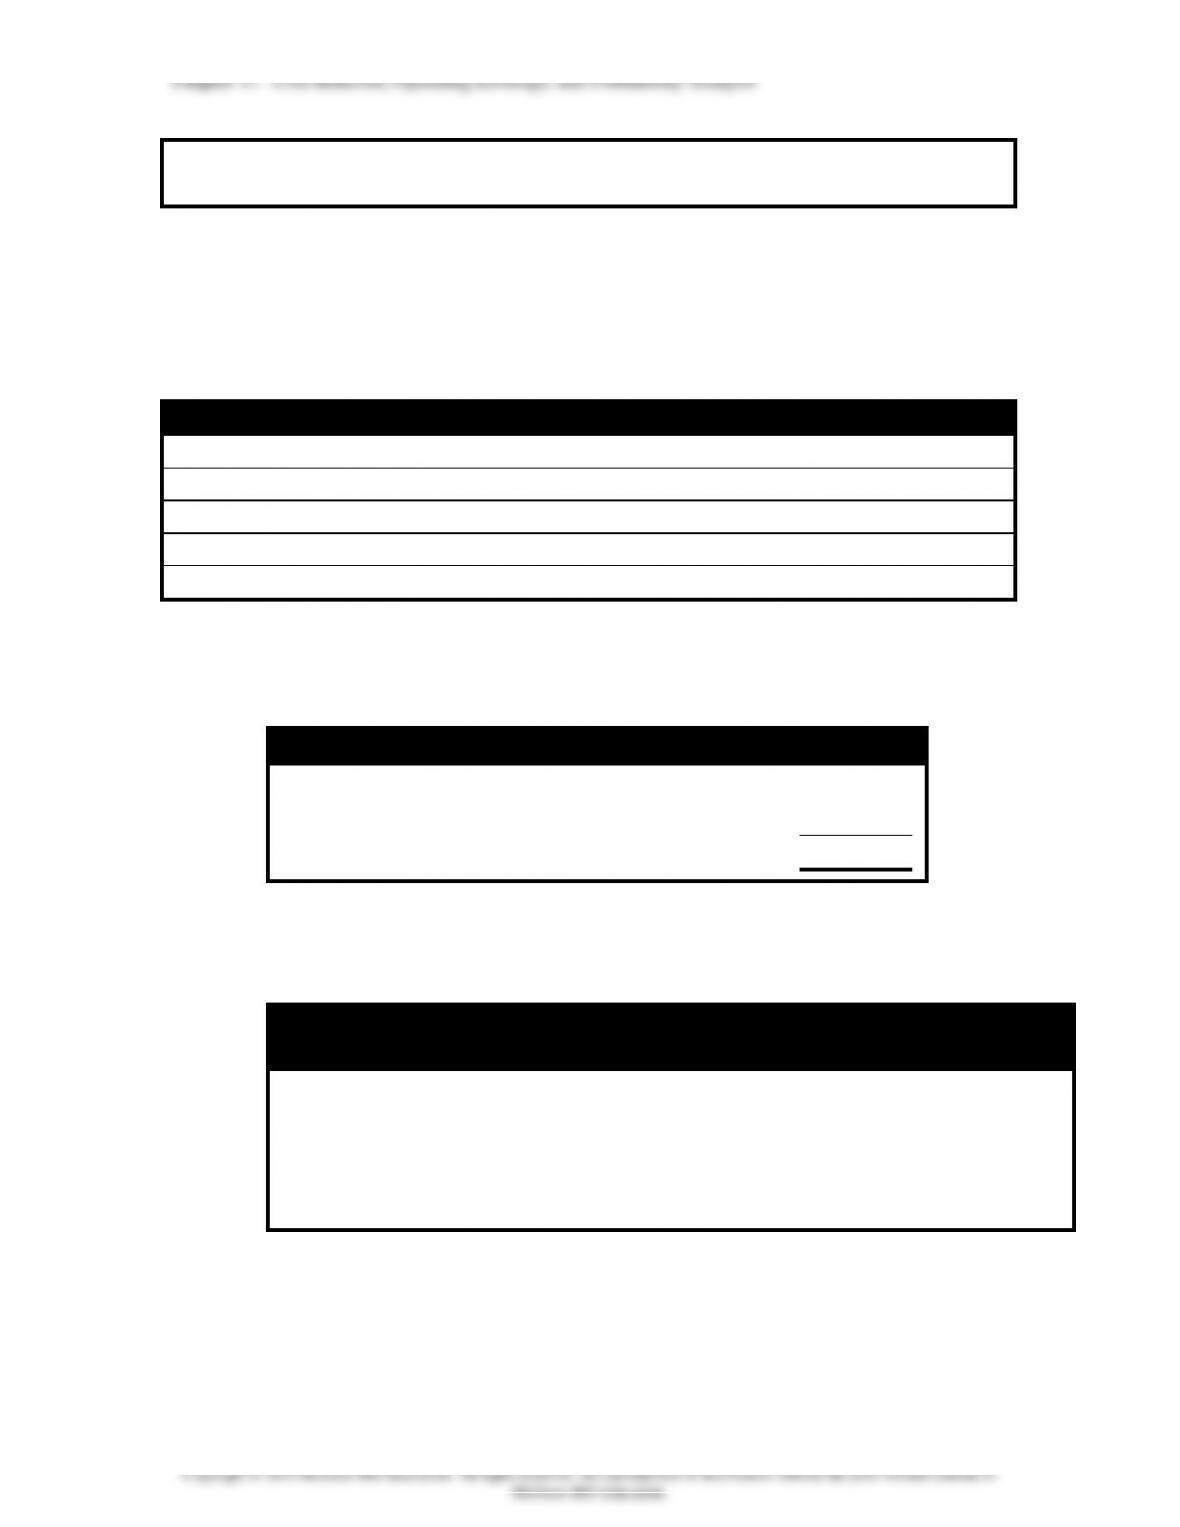
Contribution Margin Ratio
Contribution
Contribution Margin Per Unit
$140
Margin
=
=
=
.4
Ratio
Sales Price Per Unit
$350
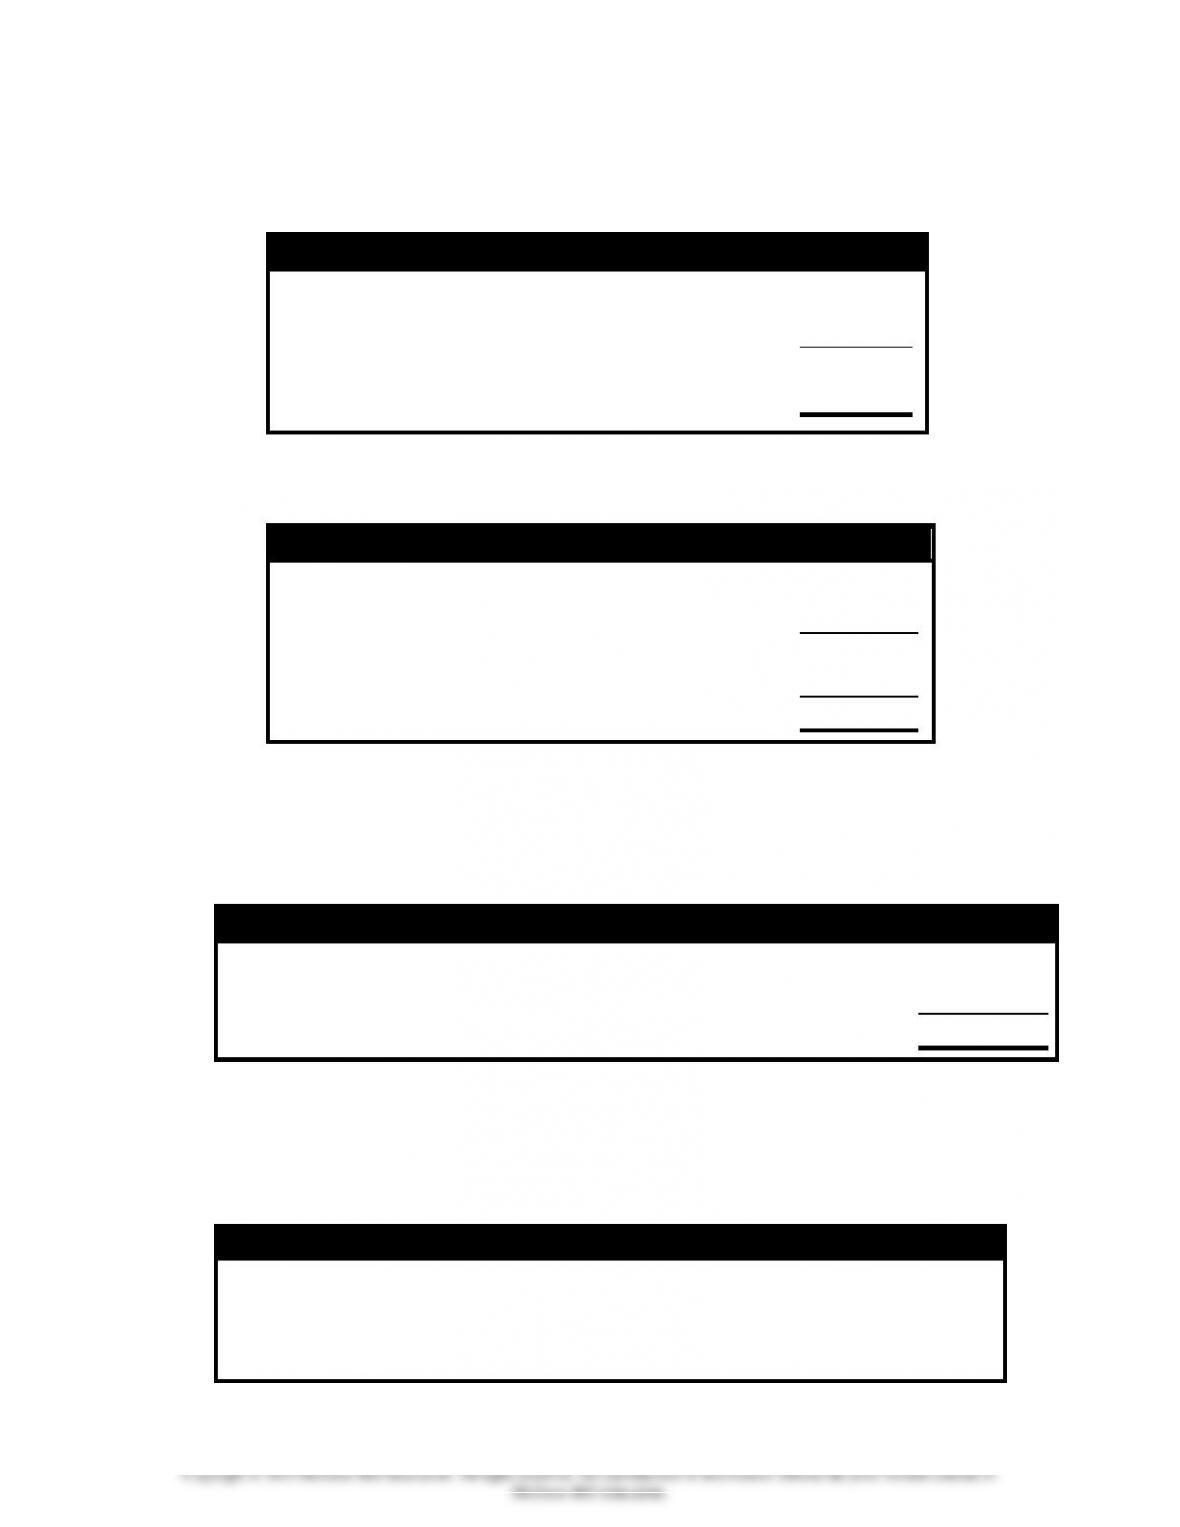
(b) Using the contribution margin ratio, calculate the break–
even point in sales dollars and units.
Break-Even Point in Sales Dollars
Break-Even
Fixed Cost
$5,600
in Sales
=
=
=
$14,000
Dollars
Contribution Margin Ratio
.4
Break-Even Point in Number of Units
Break-Even
Total Sales
$14,000
in Units
=
=
=
40 Units
Sales Price Per Unit
$350
Demonstration Problem 11-4 Solution continued
(3) Equation Approach
(a) Use the break-even equation and solve for number of units:
Break-Even Equation
Sales Price x Units = (Variable Cost x Units) + Fixed Cost
$350 x Units = ($210 x Units) + $5,600
$140 x Units = $5,600
Units = 40 sets
(b) Compute the break-even point in dollars as in part a3
above:
Chapter 11 – Cost Behavior, Operating Leverage, and Profitability Analysis
11-2
Copyright © 2015 McGraw-Hill Education. All rights reserved. No reproduction or distribution without the prior written consent of
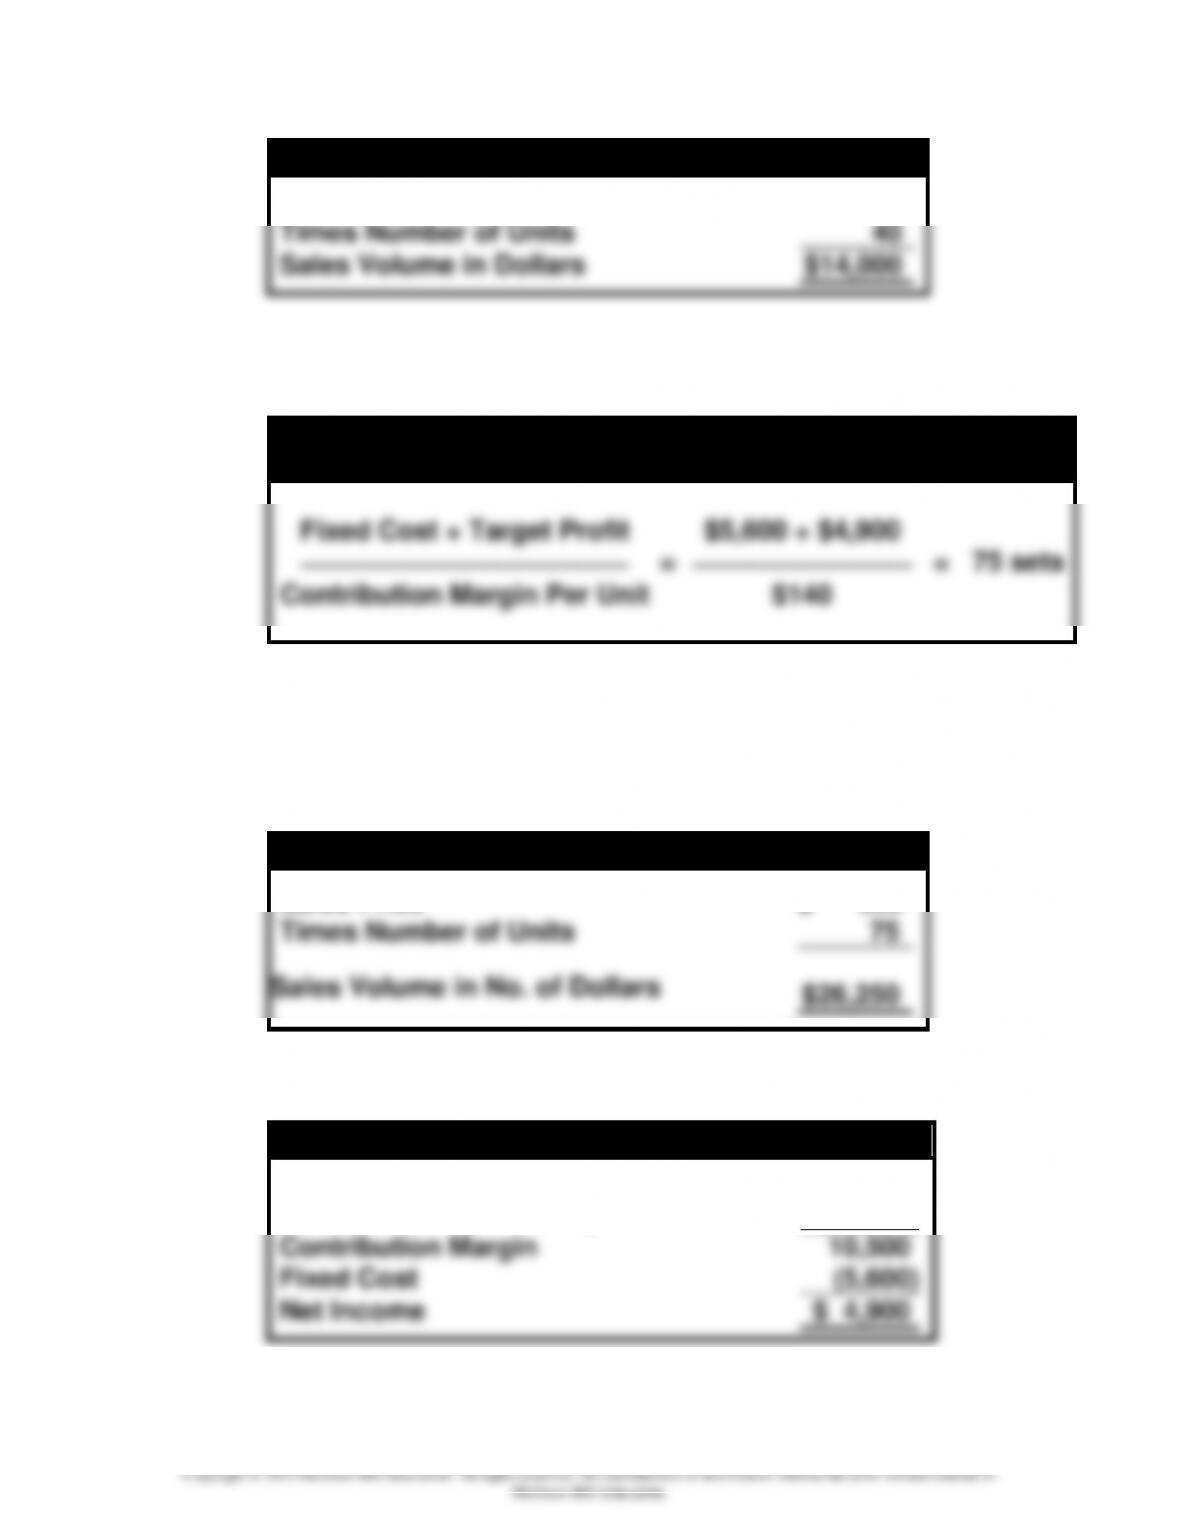
Break-Even Point in Sales Dollars
Sales Price
$ 350
Times Number of Units
40
Sales Volume in Dollars
$14,000
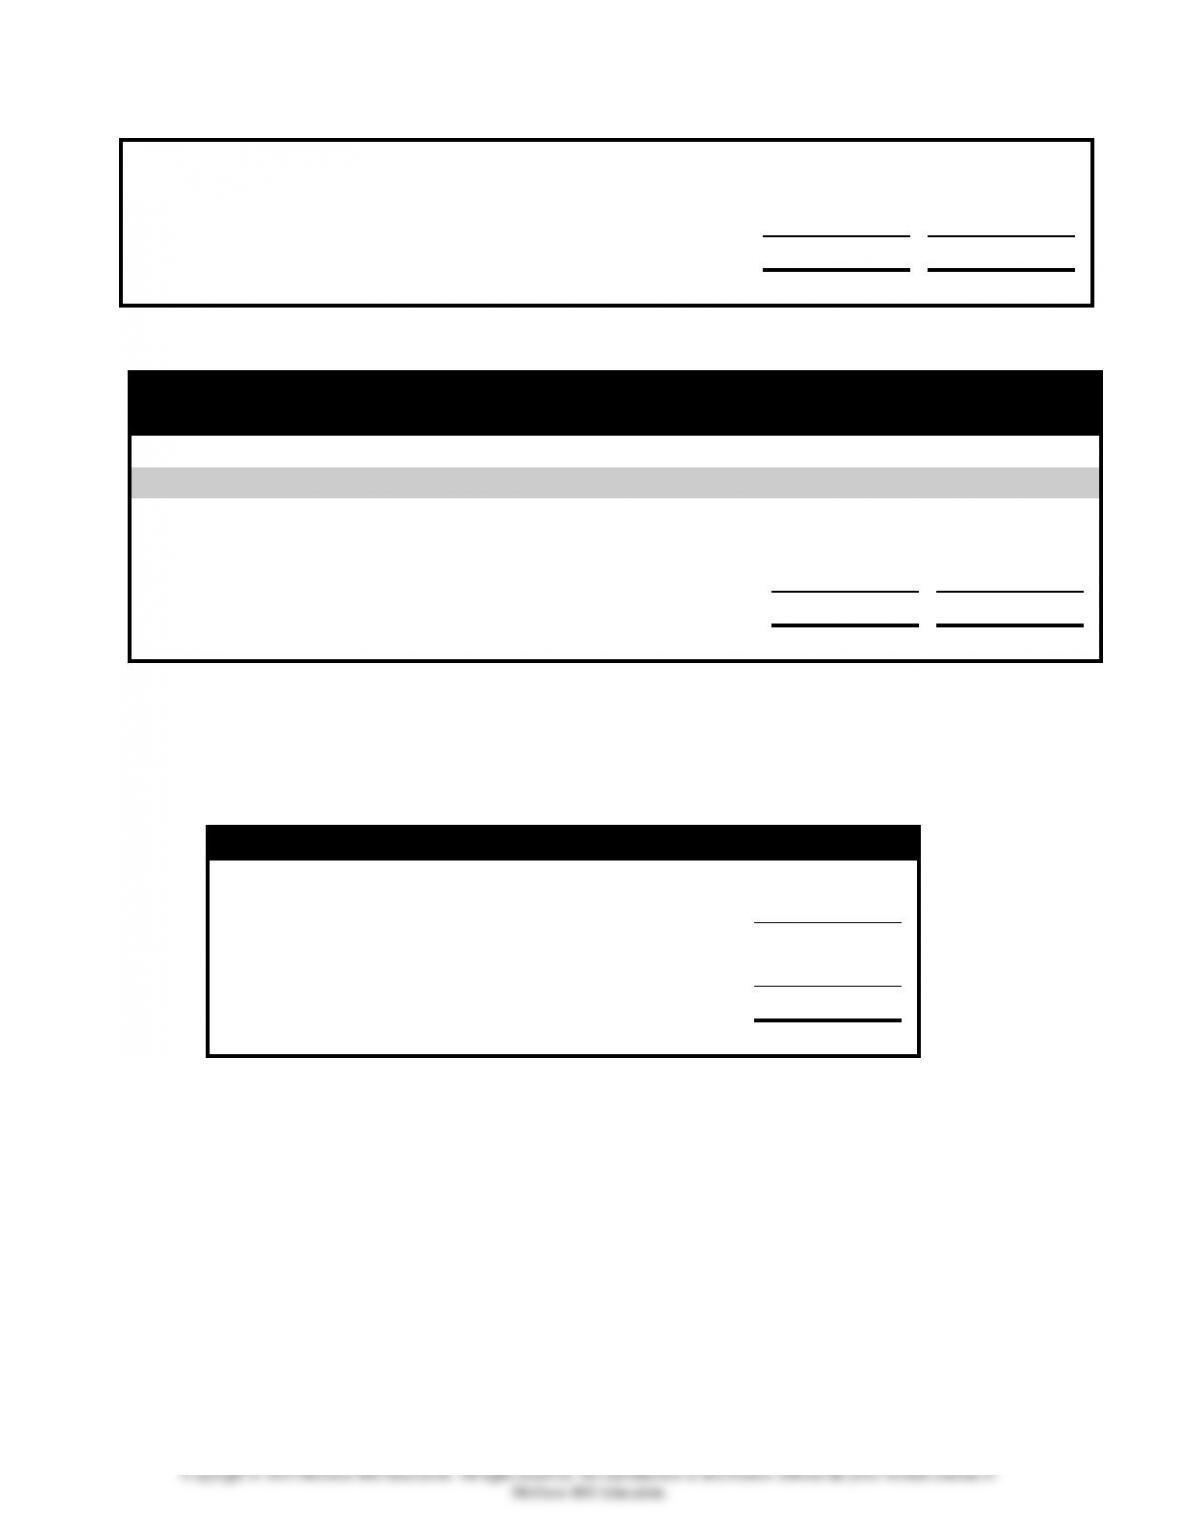
b. Target profit
(1) Sales Volume Required to Earn a Desired Profit
Formula for Computation of Sales Volume Necessary to Earn
a Target Profit of $4,900
Fixed Cost + Target Profit
$5,600 + $4,900
⎯⎯⎯⎯⎯⎯⎯⎯⎯⎯⎯⎯
=
⎯⎯⎯⎯⎯⎯⎯⎯
=
75 sets
Contribution Margin Per Unit
$140
Demonstration Problem 11-4 Solution continued
(2) Determine the sales volume in dollars required to earn the
desired profit.
Required Sales in Number of Dollars
Sales Price
$ 350
Times Number of Units
75
Sales Volume in No. of Dollars
$26,250
(3) Confirm the answers by preparing an income statement.
Income Statement
Sales
$26,250
Variable Cost (75 x $210)
(15,750)
Contribution Margin
10,500
Fixed Cost
(5,600)
Net Income
$ 4,900
Chapter 11 – Cost Behavior, Operating Leverage, and Profitability Analysis
11-3
Copyright © 2015 McGraw-Hill Education. All rights reserved. No reproduction or distribution without the prior written consent of
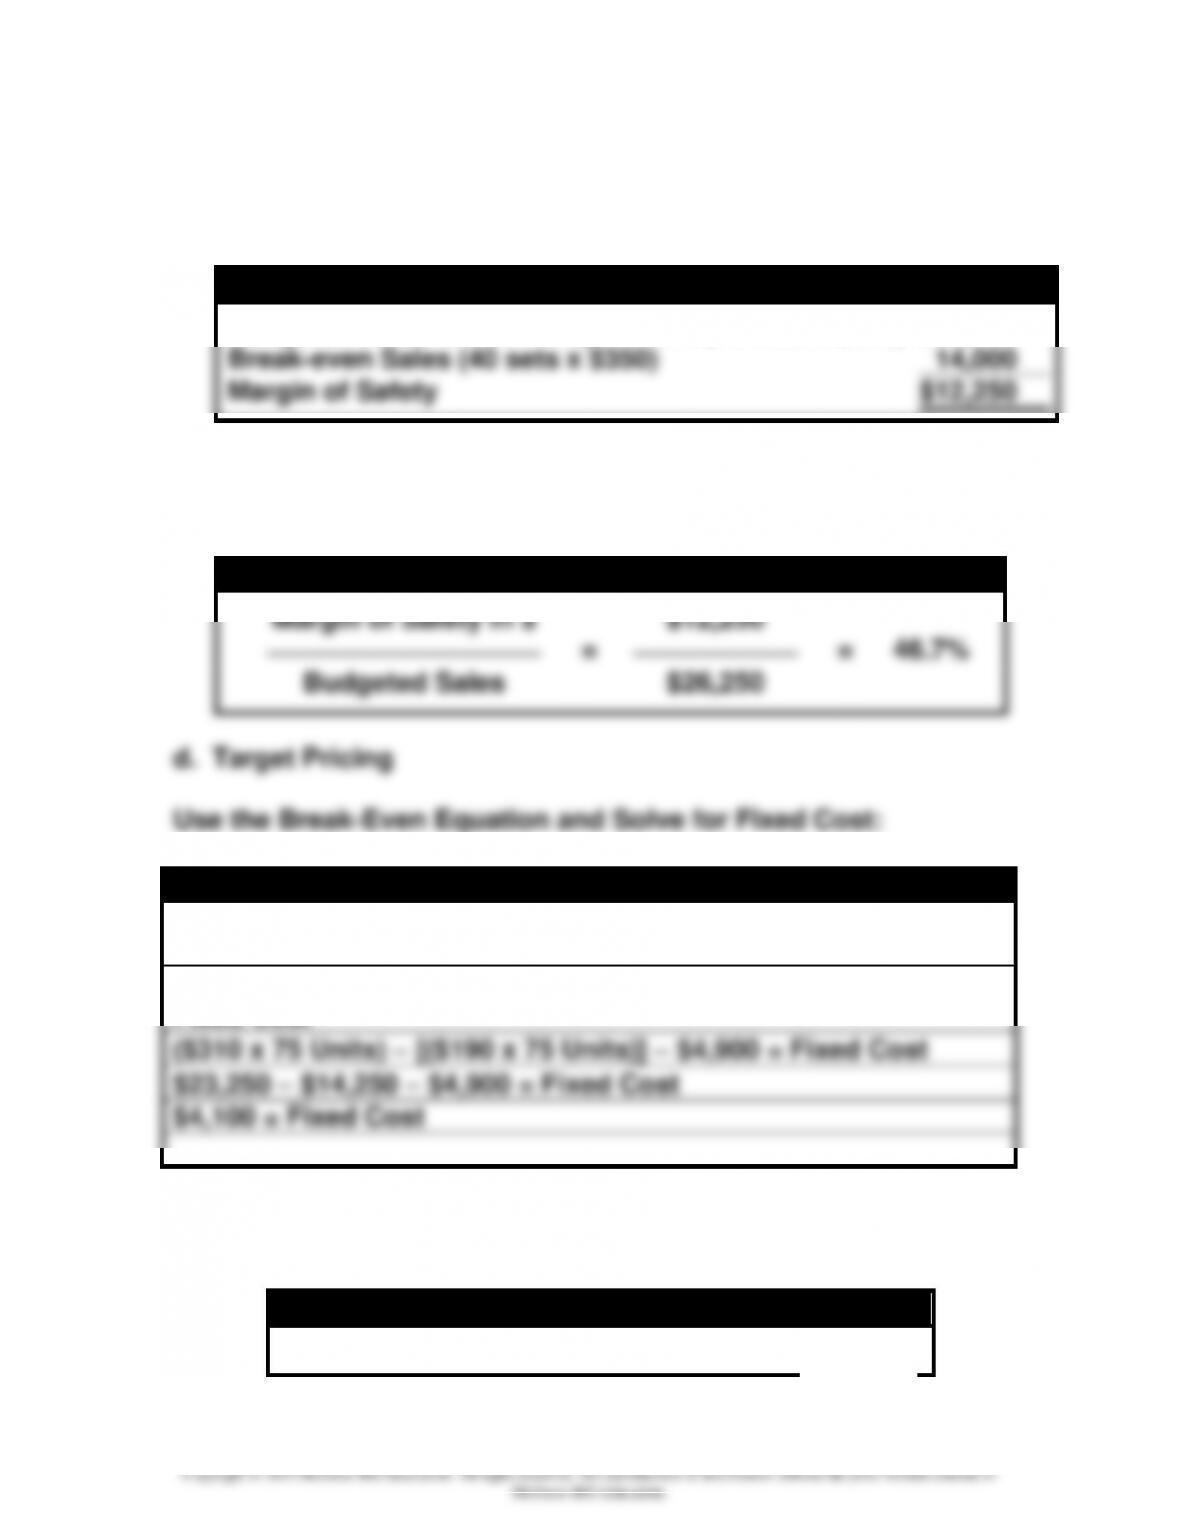
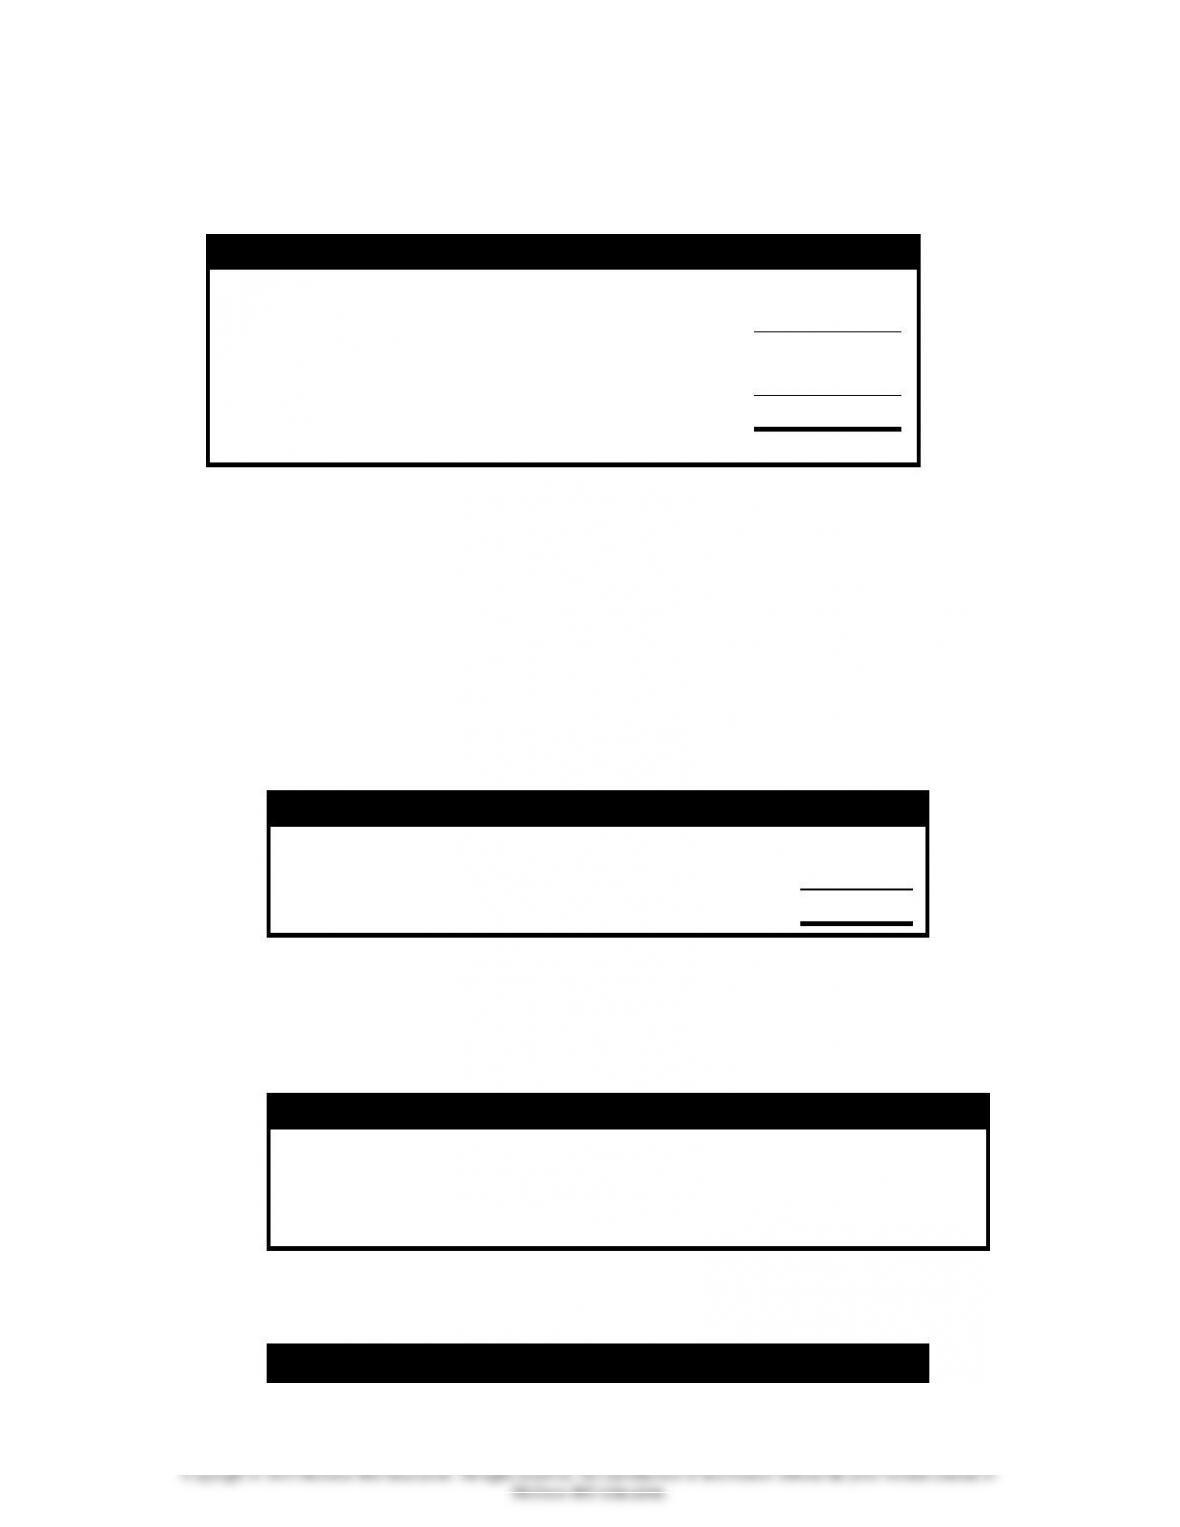
c. Margin of Safety
(1) Margin of Safety Expressed in Sales Dollars:
Margin of Safety
Budgeted Sales to Earn Target Profit (75 sets x $350)
$26,250
Break-even Sales (40 sets x $350)
14,000
Margin of Safety
$12,250
Demonstration Problem 11-4 Solution continued
(2) Margin of Safety Expressed as a Percentage:
Margin of Safety Percentage
Margin of Safety in $
$12,250
⎯⎯⎯⎯⎯⎯⎯⎯⎯⎯
=
⎯⎯⎯⎯⎯⎯
=
46.7%
Budgeted Sales
$26,250
d. Target Pricing
Use the Break-Even Equation and Solve for Fixed Cost:
Equation Approach to Compute Fixed Cost
Sales Price x Units = Fixed Cost + (Variable Cost Per Unit x
Units) + Profit
(Sales Price x Units) − [(Variable Cost Per Unit x Units)] − Profit =
Fixed Cost
($310 x 75 Units) − [($190 x 75 Units)] − $4,900 = Fixed Cost
$23,250 − $14,250 − $4,900 = Fixed Cost
$4,100 = Fixed Cost
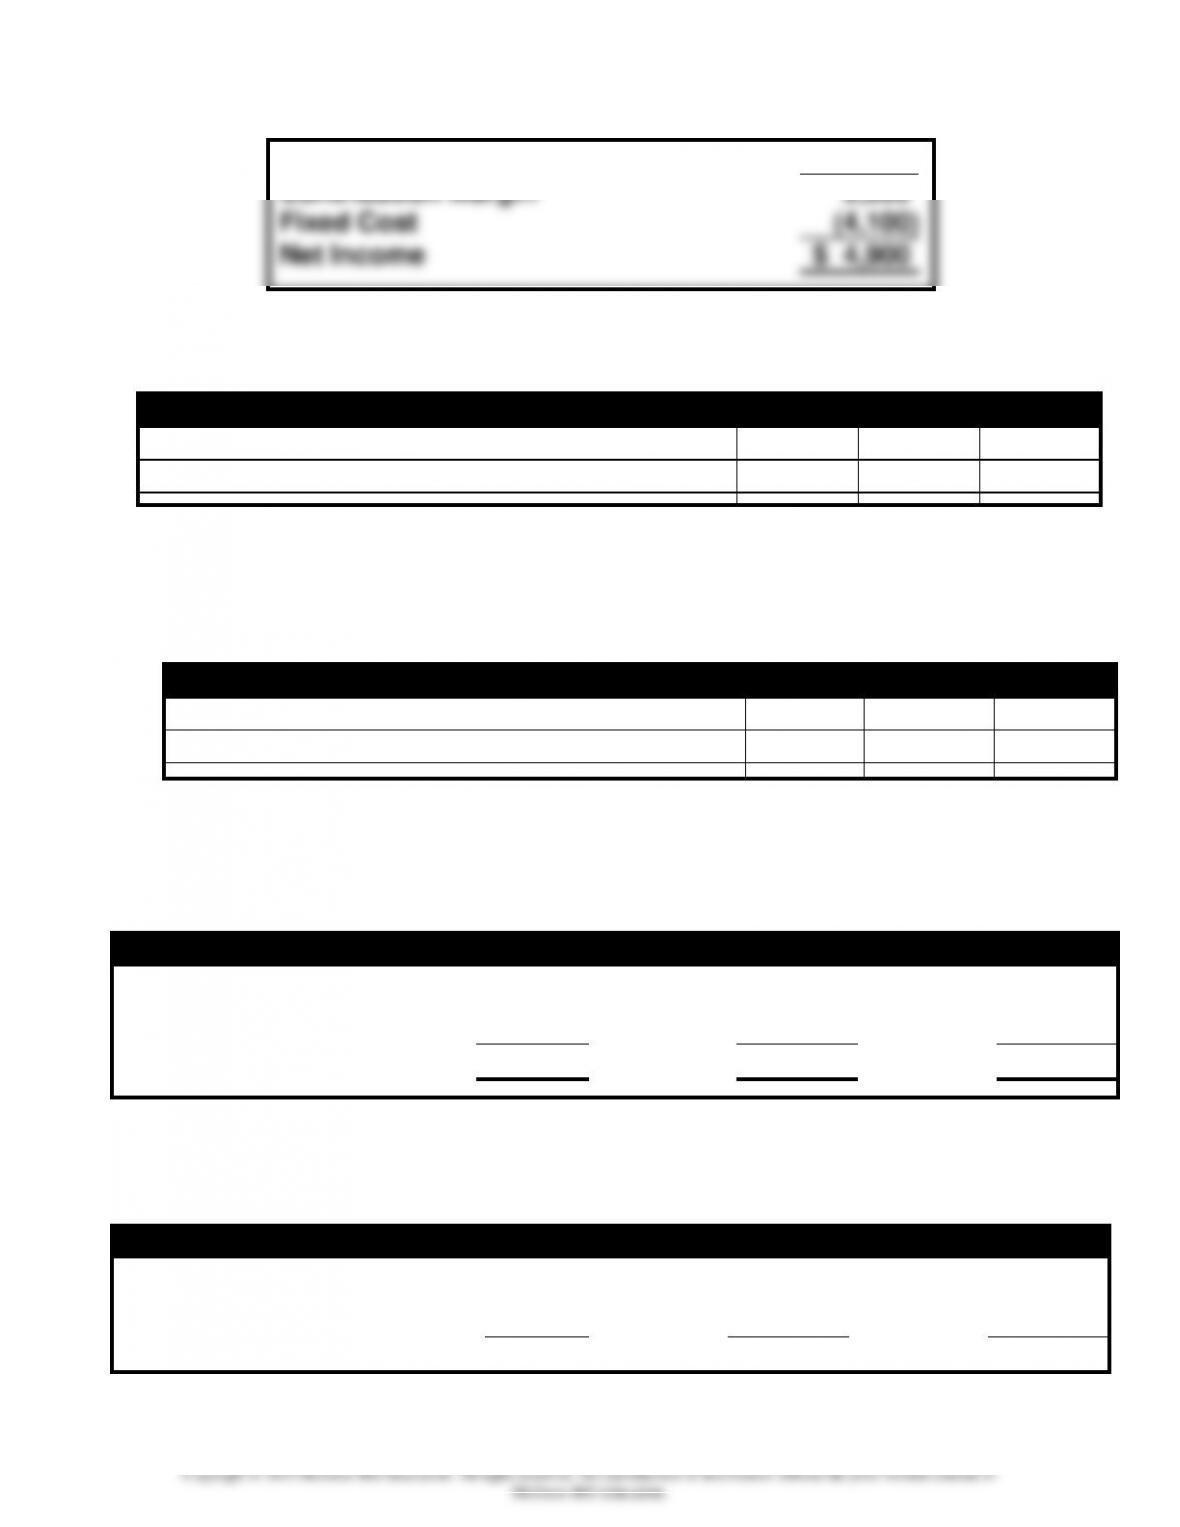
Confirm the computations by preparing an income
statement.
Income Statement
Sales (75 x $310)
$23,250
Chapter 11 – Cost Behavior, Operating Leverage, and Profitability Analysis
11-4
Copyright © 2015 McGraw-Hill Education. All rights reserved. No reproduction or distribution without the prior written consent of
Variable Cost (75 x $190)
(14,250)
Contribution Margin
9,000
Fixed Cost
(4,100)
Net Income
$ 4,900
Demonstration Problem 11-1 Work Papers
a.1.
Number of People Attending
1,000
2,000
4,000
Total Commission Cost
Average Commission Cost Per Person
Type of cost:
a.2.
Number of People Attending
1,000
2,000
4,000
Total Cost of Books
Average Per Unit Book Cost
Type of cost:
b.1.
Number of Tickets Sold
3,600
% Change
4,000
% Change
4,400
Revenue ($6 Per Ticket)
( %)
+ %
Commission Cost (Fixed)
Net Income
$ 1,600
( %)
$ 4,000
+ %
$ 6,400
Percentage Change in Revenue:
Percentage Change in Net Income:
b.2.
Number of Tickets Sold
3,600
% Change
4,000
% Change
4,400
Revenue ($6 Per Ticket)
( %)
$24,000
+ %
Commission Cost (Variable)
20,000
Net Income
$ 3,600
( %)
$ 4,000
+ %
$ 4,400
Chapter 11 – Cost Behavior, Operating Leverage, and Profitability Analysis
11-5
Copyright © 2015 McGraw-Hill Education. All rights reserved. No reproduction or distribution without the prior written consent of
Percentage Change in Revenue:
Percentage Change in Net Income:
Demonstration Problem 11-1 Work Papers, continued
c.1. (Same as part a.1.)
Number of People Attending
1,000
2,000
4,000
Total Commission Cost
Average Commission Cost Per Person
Type of cost:
c.2.
Number of Exhibitions (a)
1
2
3
Total Expected Commission Cost
Cost Per Exhibition
Type of cost: Demonstration Problem 11-2 Work Papers
a.
My
Company
Your
Company
Number of Rafters
4,000
4,000
Revenue
Cost of Guides My Company
Fixed
Cost of Guides Your Company
Variable
Net income
b.
My
Company
Your
Company
Number of Rafters (a)
6,000
2,000
Revenue My Company
Chapter 11 – Cost Behavior, Operating Leverage, and Profitability Analysis
11-6
Copyright © 2015 McGraw-Hill Education. All rights reserved. No reproduction or distribution without the prior written consent of
Revenue Your Company
Cost of Guides My Company
Fixed
Cost of Guides Your Company
Variable
Net Income
d.
My
Company
Your
Company
Number of Rafters
4,000
4,000
Revenue
Cost of Guides My Company
Fixed
Cost of Guides Your Company
Variable
Net Loss
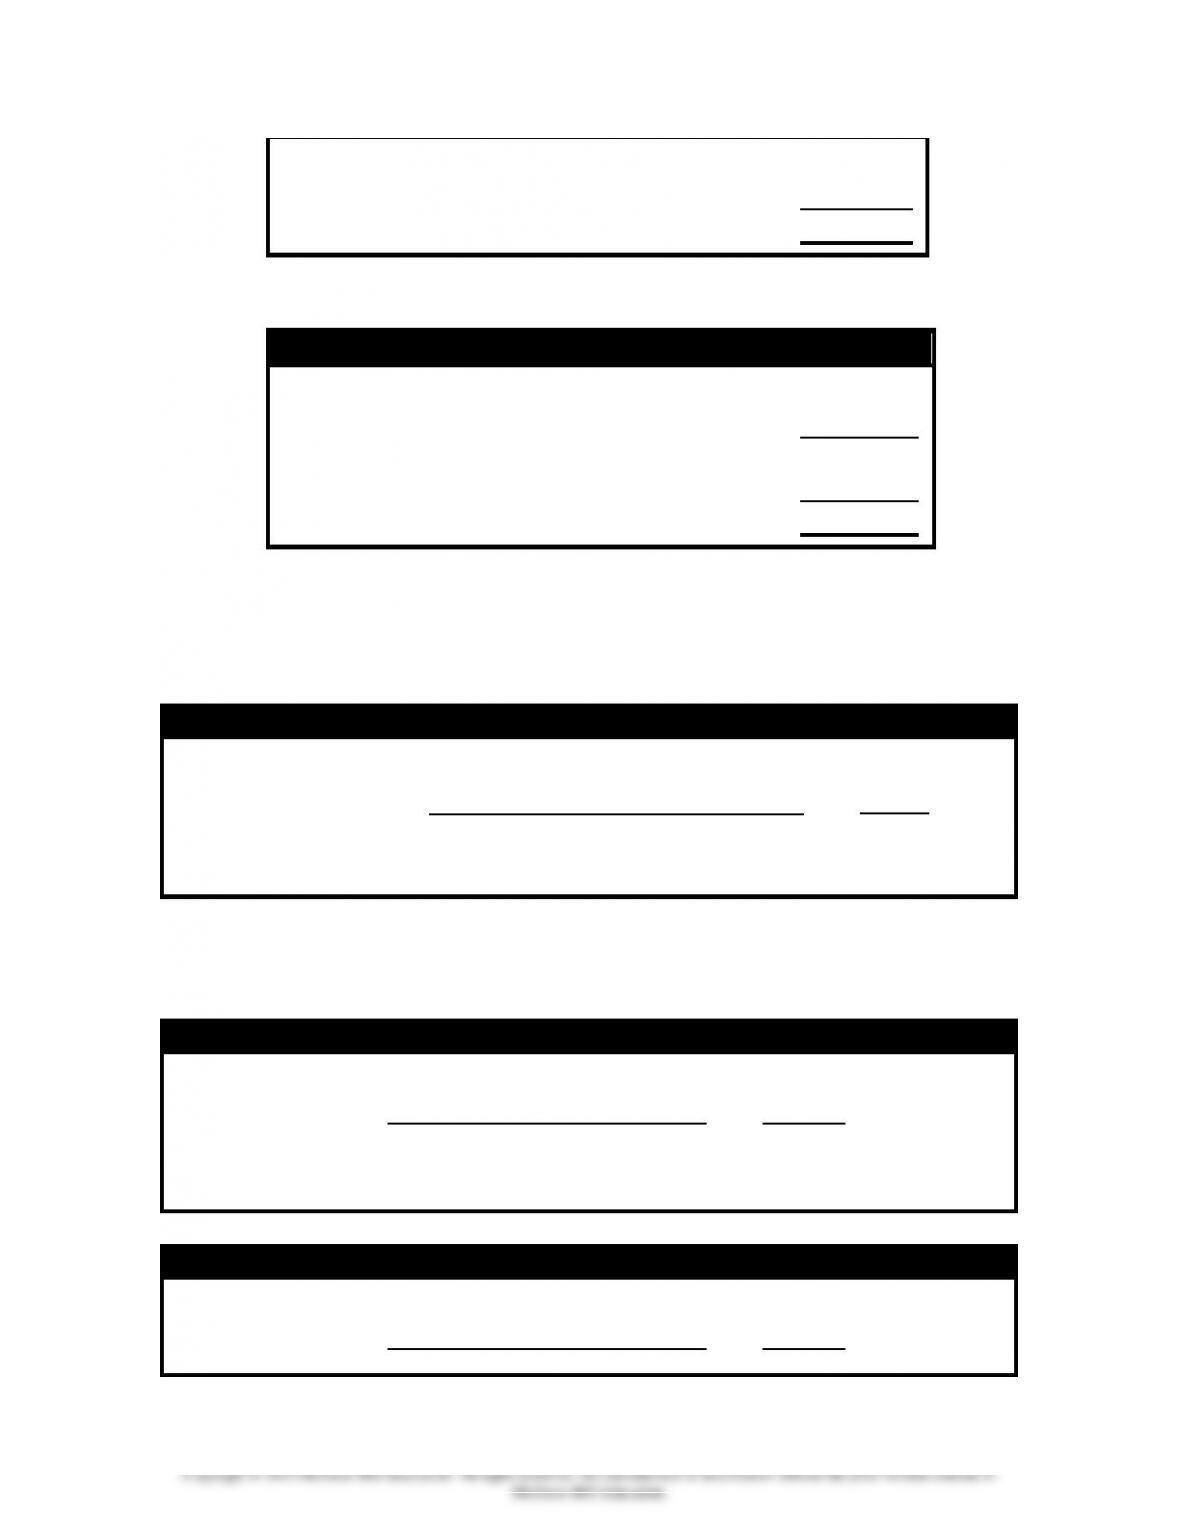
Demonstration Problem 11-3 Work Papers
a. Income Statement Using a Contribution Margin Format,
Volume of 100 Deliveries
Revenue
Variable Expenses
Contribution Margin
Fixed Expenses
Net Income
b. Magnitude of Operating Leverage = Contribution Margin ÷
Net Income:
$________ ÷ $_________ = ___ times.
Therefore, a 10% increase in sales will produce a _________
increase in net income. Similarly, a 10% decrease in sales
will produce a __________ decrease in net income.
Chapter 11 – Cost Behavior, Operating Leverage, and Profitability Analysis
11-7
Copyright © 2015 McGraw-Hill Education. All rights reserved. No reproduction or distribution without the prior written consent of
c. Income Statement Using a Contribution Margin Format,
Volume of 110 Deliveries
Revenue
Variable Expenses
Contribution Margin
Fixed Expenses
Net Income
(Alternative Net Income − Base Net Income) ÷ Base:
($______ − $______) ÷ $______ = _____%
Demonstration Problem 11-4 Work Papers
a. Break-even point
(1) Contribution Margin Per Unit Approach
(a) Determine the contribution margin per unit.
Per Unit Contribution Margin
Sales Price
$
$
(b) When the total contribution margin is sufficient to pay for
the fixed costs, Mr. Jamail will break even. The number of
units required to break even can be computed as follows:
Formula for Computation of Break-Even Point in Units
$
⎯⎯⎯⎯⎯⎯⎯⎯⎯⎯⎯⎯⎯
=
⎯⎯⎯⎯
=
$
(c) The break-even point in number of dollars can be
computed as follows:
Break-Even Point in Sales Dollars
Chapter 11 – Cost Behavior, Operating Leverage, and Profitability Analysis
11-8
Copyright © 2015 McGraw-Hill Education. All rights reserved. No reproduction or distribution without the prior written consent of
Sales Price Per Unit
$
$
(d) Confirm the results by preparing an income statement.
Income Statement
Sales
$
( )
( )
Net Income
$ 0
Demonstration Problem 11-4 Work Papers, continue
(2) Contribution Margin Ratio Approach
(a) The contribution margin ratio is computed as follows.
Contribution Margin Ratio
Contribution
$
Margin
=
=
=
Ratio
$
(b) Using the contribution margin ratio, calculate the break–
even point in sales dollars and units.
Break-Even Point in Sales Dollars
Break-Even
$
in Sales
=
=
=
$
Dollars
Break-Even Point in Number of Units
Break-Even
$
in Units
=
=
=
11-9
Copyright © 2015 McGraw-Hill Education. All rights reserved. No reproduction or distribution without the prior written consent of
$
Demonstration Problem 11-4 Work Papers, continued
(3) Equation Approach
(a) Use the break-even equation and solve for number of units:
Break-Even Equation
(b) Compute the break-even point in dollars as in part a3
above:
Break-Even Point in Sales Dollars
Sales Price
$
$
b. Target profit
(1) Sales Volume Required to Earn a Desired Profit
Formula for Computation of Sales Volume Necessary to Earn
a Target Profit of $4,900
⎯⎯⎯⎯⎯⎯⎯⎯⎯⎯⎯⎯
=
⎯⎯⎯⎯⎯⎯⎯⎯
=
Demonstration Problem 11-4 Work Papers, continued
Chapter 11 – Cost Behavior, Operating Leverage, and Profitability Analysis
11–10
Copyright © 2015 McGraw-Hill Education. All rights reserved. No reproduction or distribution without the prior written consent of
(2) Determine the sales volume in dollars required to earn the
desired profit.
Required Sales in Number of Dollars
Sales Price
$
$
(3) Confirm the answers by preparing an income statement.
Income Statement
Sales
$
( )
( )
Net Income
$
c. Margin of Safety
(1) Margin of Safety Expressed in Sales Dollars:
Margin of Safety
$
$12,250
Demonstration Problem 11-4 Work Papers, continued
(2) Margin of Safety Expressed as a Percentage:
Margin of Safety Percentage
$
⎯⎯⎯⎯⎯⎯⎯⎯⎯⎯
=
⎯⎯⎯⎯⎯⎯
=
$

Chapter 11 – Cost Behavior, Operating Leverage, and Profitability Analysis
11–11
Copyright © 2015 McGraw-Hill Education. All rights reserved. No reproduction or distribution without the prior written consent of
d. Target Pricing
Use the Break-Even Equation and Solve for Fixed Cost:
Equation Approach to Compute Fixed Cost
Confirm the computations by preparing an income
statement.
Income Statement
Sales
$
( )
( )
Net Income
$ 4,900