
CHAPTER 13
THE BETA FOR COLGATE-PALMOLIVE
NOTE: The example below shows the results from late 2013. The actual answer to the case will
change based on current market conditions
1. The information used for the analysis is presented below. Note that the risk-free rate (3-month T-bill
rate) is expressed as an annual rate. It is necessary to find the monthly rate, so this rate is divided by
12.
Risk-
free
Monthly
Risk-
free
Stock
price Return
S&P
500
S&P 500
return
Stock
risk
premium
S&P risk
premium
Nov–08 $28.74 896.24
Dec–08 0.0003 0.00003 $30.27 0.0532 903.25 0.0078 0.0532 0.0078
Jan–09 0.0013 0.00011 $28.91 –0.0449 825.88 –0.0857 –0.0450 –0.0858
Feb–09 0.003 0.00025 $26.75 –0.0747 735.09 –0.1099 –0.0750 –0.1102
Mar–09 0.0022 0.00018 $26.21 –0.0202 797.87 0.0854 –0.0204 0.0852

CHAPTER 13 C-2
Mar–11 0.001 0.00008 $37.76 0.0283 1325.83 –0.0010 0.0282 –0.0011
Apr–11 0.0006 0.00005 $39.73 0.0522 1363.61 0.0285 0.0521 0.0284
May–11 0.0004 0.00003 $41.22 0.0375 1345.2 –0.0135 0.0375 –0.0135
Jun–11 0.0004 0.00003 $41.17 –0.0012 1320.64 –0.0183 –0.0012 –0.0183
Jul–11 0.0004 0.00003 $40.00 –0.0284 1292.28 –0.0215 –0.0285 –0.0215
Using the Excel functions for the average return and standard deviation, the table below shows the
averages and standard deviations for each of the series.
Last 36 months Risk-free Colgate S&P 500
Average return 0.01% 1.78% 1.25%

CHAPTER 13 C-3
Last 60 months Risk-free Colgate S&P 500
2. Jensen’s alpha represents the excess return not explained by the beta of the stock. A positive alpha
3. The relevant output from Excel for this period is:
SUMMARY OUTPUT
Regression Statistics
Multiple R 0.577395
ANOVA
df SS MS F Significance F
Regression 1 0.036236 0.036236 17.00394 0.000227
Coefficients Standard Error t Stat P-value
Intercept 0.003475 0.007694 0.45161 0.654418
The is insignificant at a realistic significance level, while the estimate is .51 and is significant.
The residual plot is:

CHAPTER 13 C-4
-0.1000 -0.0500 0.0000 0.0500 0.1000 0.1500
-0.1000
-0.0500
0.0000
0.0500
0.1000
0.1500
X Variable 1 Line Fit Plot
Y
Predicted Y
X Variable 1
Y
4. The relevant output from Excel for this period is:
SUMMARY OUTPUT
Regression Statistics
Multiple R 0.537056
R Square 0.288429
Adjusted R Square 0.27616
Standard Error 0.040085
Observations 60
ANOVA
df SS MS F Significance F
Regression 1 0.037775 0.037775 23.50976 9.69E-06
Coefficients Standard Error t Stat P-value
Intercept 0.007093 0.005175 1.370679 0.175756
The is insignificant at a realistic significance level, while the estimate is .49 and is significant.
The residual plot is:
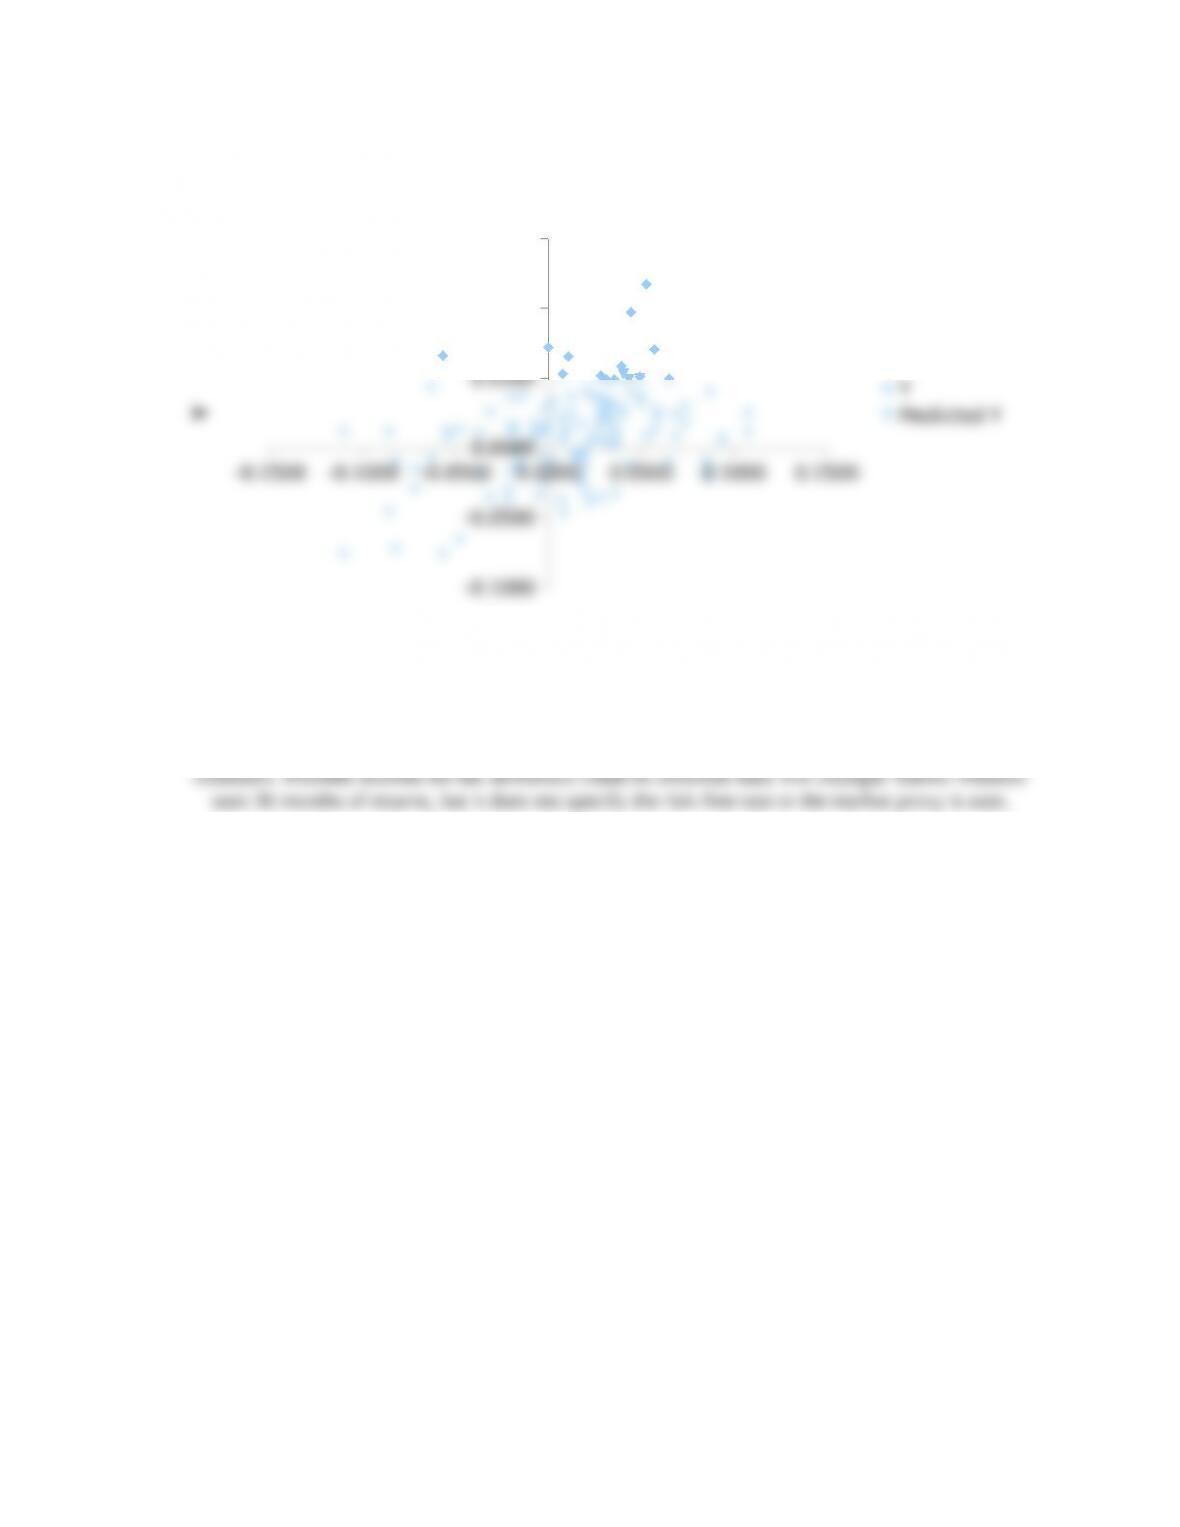
CHAPTER 13 C-5
-0.1500 -0.1000 -0.0500 0.0000 0.0500 0.1000 0.1500
-0.1000
-0.0500
0.0000
0.0500
0.1000
0.1500
X Variable 1 Line Fit Plot
Y
Predicted Y
X Variable 1
Y
5. The beta for Colgate-Palmolive on Yahoo! Finance at the time was .30, which is lower than these
estimates. Possible reasons for the difference could be different data. For example Yahoo! Finance
uses 36 months of returns, but it does not specify the risk-free rate or the market proxy it uses.
