1
Teaching Note for “The Westerville Physician Practice”
Discussion Questions
1. What are the problems in this case?
2. Draw a current state value stream map indicating the customer, supplier, information
flow and relevant metrics
• What is the takt time?
• What is the total lead time (processing + waiting)?
• What is the total value added and non-value added time?
• What is the VA/NVA percentage?
3. How can the system be improved and draw a new value stream map.
The case requires at least 80 minutes of discussion time to develop the current state map and
discuss the future state plans for patient throughput in a clinic. Typically the instructor begins the
class by asking the students to describe the problem the Schmidts are facing. It is a good practice
to encourage students to identify the problem as a measurable gap and indicate that with a visual.
The instructor gives an overview of value stream mapping concepts and the seven wastes
(Transportation, Inventory, Motion, Wait, Overproduction, Over-processing and Defect) The
instructor then asks the students to identify the inefficiencies in the clinic. The following lists of
issues are often identified as the major issues by the students:
• Excess waiting before each step
2
• Redundant steps performed by Registrar and MA
• Patients feel neglected
• Unnecessary motion
• Inventory issues
• Completing physician notes after hours
The instructors are welcome to identify other issues in the case. Once these issues are outlined,
the students are encouraged to construct a current state map of the clinic patient flow.
Constructing the current state map requires collecting the process times, number of employees
and full-time equivalent (FTE) for each of the clinic process steps. After collecting these data,
students then compute the cycle time, utilization and wait times for each step as described below.
Drawing the Current state Map
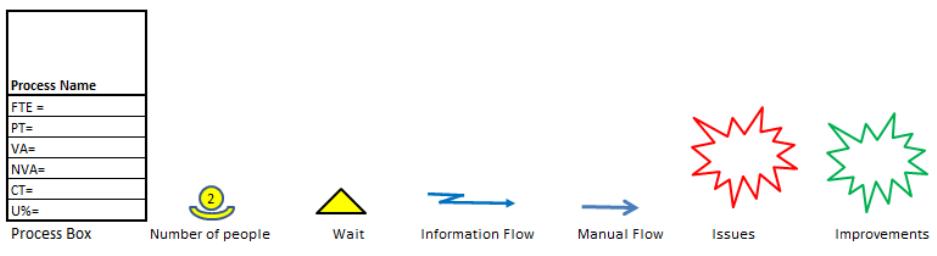
See Figure 1 for the symbols to depict different aspects of the value stream map.
Figure 1: Value Stream Mapping Symbols
Draw Customer Demand:
The customer box is drawn on the top right side of the Value Stream Map. Figure 2 shows the
current state value stream map. To understand the inefficiencies in any process it is important to
3
understand the Takt time or the pace of production. In this case, the pace at which patients
should be seen. Takt time is calculated as follows:
Hours of operation per day= 8am-4pm= 8 hours
Available Time per day = 7 hours (8 hours minus 30 minutes lunch and two 15 minutes breaks) x
60 minutes = 420 minutes
Patients= 88-90/day. Average demand = (88+90)/2= 89 patients / day
Takt Time = Available Time per Day / Total Patients per day = 420 / 89= 4.7 minutes per patient
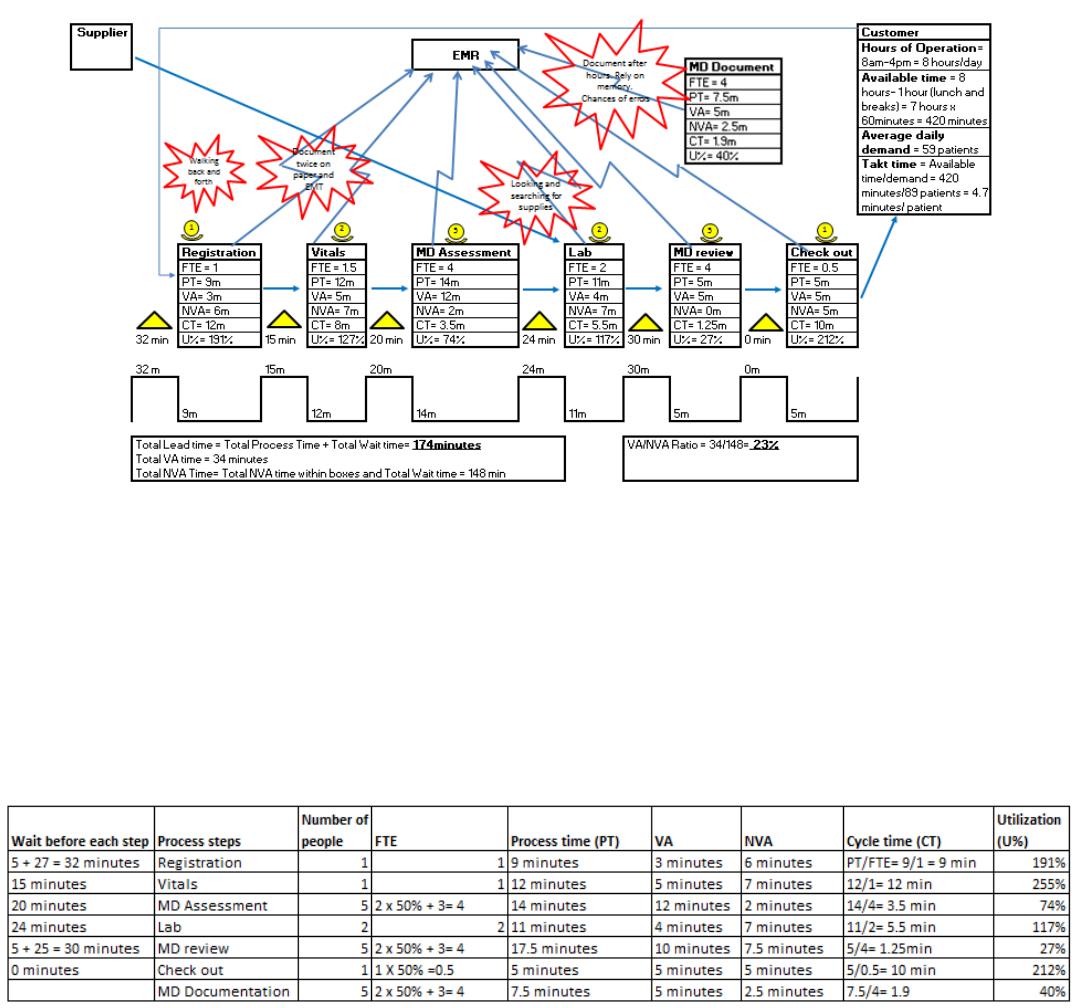
Figure 2: Current State Value Stream Map
The difference between a process map and value stream map is that a process map simply
indicates the process steps with decision points. A value stream map helps to quantify the
inefficiencies in the process. Figure 3 provides the metrics for each process step. Note that there
is waiting before almost all the steps.
Figure 3: Value Stream Metrics
4
Draw Wait Before Registration:
5 minutes of searching + 27 minutes waiting = 32 minutes
Explain how to recognize a process step:
Separated from other steps by time, people, or inventory
Activities that one person does before passing it to another person
Draw Registration Process:
Employees = 1 Registrar. The register is spending 100% of the time to registration. Therefore,
FTE= 1
Process Time = 9 minutes per patient
Value added time (touch time) = 3 minutes
Non- value added (time spent on walking back and forth to the printer) = 6 minutes
Cycle Time = 9 minutes / 1 FTE = 9 minutes
Explain how cycle time is the time between patients as observed by the next process.
Utilization = Cycle time/Takt Time = 9 minutes / 4.7 minutes = 191%
Is this high or low value? Discuss the tradeoffs of having high vs. low utilization in a service
context
• Identify the steps involved in this process. Document any information regarding
improvement opportunities listed in the case.
o Example – 6 minutes of 9 minutes is spent walking back and forth from the printer
Draw Wait between Registration and Triage
15 minutes – Is this too long? Discuss strategies to minimize wait times —
Draw Vitals Process:
Employees = 1 MA = 1 FTE (full-time)
Process Time = 12 minutes per patient
Value added time (touch time) = 5 minutes
Non- value added (walking, writing on post it note and then typing in the computer) = 6 minutes
Cycle Time = 12 minutes / 1 FTE = 12 minutes
Utilization = Cycle time/Takt Time = 12 minutes / 4.7 minutes = 255%
5
• Identify the steps involved in this process. Document any information regarding
improvement opportunities listed in the case.
o Documents first on paper and then into EMR – 7 minutes of 12 minutes
processing time. Discuss if documentation Non-value added or incidental value
added?
o Why is the MA writing on a post-it first? Training issues? What are the risks of
not directly documenting in the EMR? HIPAA violation could cause a big
problem to any clinic or hospital for failing to maintain privacy of patients.
Chances of medical errors by entering information for the wrong patient.
Draw Wait before MD Assessment
20 minutes – why this wait? Is the patient late? Is the doctor late? Could doctors be unaware that
the patient has arrived? Could some sort of visual help?
Draw MD (Doctor) Assessment
Employees = 5MDs = 4 FTE (full-time). 3 Full time MDs plus 50% times 2 (Pam and Pat
Schmidt’s time) = 3+1
Process Time = 14 minutes per patient
Value added time (touch time) = 12 minutes
Non- value added time = 2 minutes
Cycle Time = 14 minutes / 4 FTE = 3.5 minutes
Utilization = Cycle time/Takt Time = 3.5 minutes / 4.7 minutes = 74%
Draw Wait before Lab
24 minutes
Draw Lab
Employees= The case study does not spell explicitly the number of people working in the lab but
from the conversation it is implied that there are 2 full time lab technicians = 2 FTE
Processing Time = 11 minutes
Value added time (touch time) = 4 minutes
Non- value added time (unnecessary motion, walking and searching for supplies) = 7 minutes
Cycle time = 11minutes/2 = 5.5 minutes
Utilization = Cycle time/Takt Time = 5.5 minutes / 4.7 minutes = 117%
6
• Why is the technician searching for supplies? Is there a need for 5S and inventory
management system?
Draw Wait before MD review
30 minutes= Patient cannot find way back to the room from the lab (5m) Waiting for doctor for
25 minutes
• How can this wait be eliminated? Is there a need for Visuals to make it easier for patient to
find their way?
Draw MD review
Employees= 5MDs = 4 FTE (full-time). 3 Full time MDs plus 50% times 2 (Pam and Pat
Schmidt’s time) = 3+1
Processing Time = 5 minutes
Value added time (touch time) = 10 minutes (5 minutes review results and treatment with patient
and 5 minutes documentation if they completed real time)
Non- value added time (relying on memory, variable Internet speed at home) = 7.5 minutes
Cycle time = 5minutes/4 = 1.25 minutes
Utilization = Cycle time/Takt Time = 1.25 minutes / 4.7 minutes = 27%
• Even though utilization is less than 100%, this step can be improved so MDs can spend more
time with the patient and answer any questions.
MD Documentation (After hours)
Employees= 5MDs = 4 FTE (full-time). 3 Full time MDs plus 50% times 2 (Pam and Pat
Schmidt’s time) = 3+1
Processing Time = (10+15)/2= 7.5 minutes
Value added time (touch time) = 5 minutes (5 minutes if they completed the documentation in
real time while they are with the patient)
Non- value added time (relying on memory, variable Internet speed at home) = 2.5 minutes
Cycle time = 7.5minutes/4 = 1.9 minutes
Utilization = Cycle time/Takt Time = 1.9 minutes / 4.7 minutes = 40%
• Even though utilization is less than 100%, documentation done in real time can eliminate
relying on memory. Documenting real time also prevents potential documentation errors.
7
Draw Wait before Check Out
0 minutes
Draw Check Out
Employees= 1 = 0.5 FTE
Processing Time = 5 minutes
Value added time (touch time) = 5 minutes
Non- value added time = 0 minutes
Cycle time = 5minutes/0.5 = 10 minutes
Utilization = Cycle time/Takt Time = 10 minutes / 4.7 minutes = 212%
• Now this is interesting because there is no non-value added time and yet, the utilization is
very high. Here there is truly a need for another 0.6 FTE to help with this process.
• Use a line balance chart (Figure 4) to understand the utilizations of all the steps. After
eliminating wastes can someone be cross-trained to help the check- out person? Could it be
the registrar?
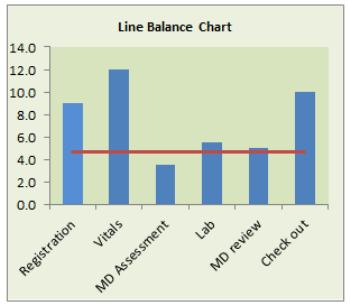
Figure 4: Line Balance Chart
In a line balance chart, the Y-axis indicates cycle time and X-axis indicates the process steps.
The red line across the bars is the takt time. Bars that are above the red line indicate overutilized
steps. The usual response after seeing such a graph is to hire more people. The Value Stream
Map tells us if there is truly a need for hiring more people or there is too much “waste” in the
process. The first thing to do improve a process therefore is to eliminate sources of wastes. After
eliminating waste, redraw the line balance chart. The steps that indicate capacity or
8
underutilization can be cross trained to help the steps that are over-utilized. It is important to
keep in mind though in healthcare, only certain roles can be cross-trained for certain jobs. E.g. It
will not be possible to cross-train a registrar to be a doctor and we would not want a doctor to
perform a registrar’s job.
Total Times
Total Process Time = 56 minutes
Total Wait Time = 121 minutes
Total Lead Time = Total Process Time + Total Wait Time= 56 minutes + 121 minutes = 174
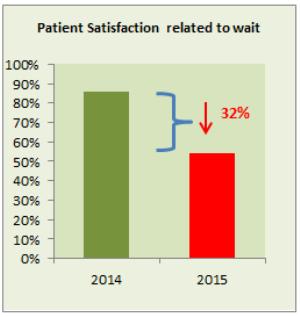
minutes. The patient throughput time is approximately 3 hours! Is that a surprise then that the
patient satisfaction related to wait time is low?
Total Value Added Time= 34 minutes
Total Non-Value Added Time= 30 minutes (Within the process boxes) + 121 minutes (wait in
between the steps) = 148 minutes
VA/NVA Ratio= 34/151= 23%
The goal of process improvement is to strive for increasing the VA/NVA ratio.
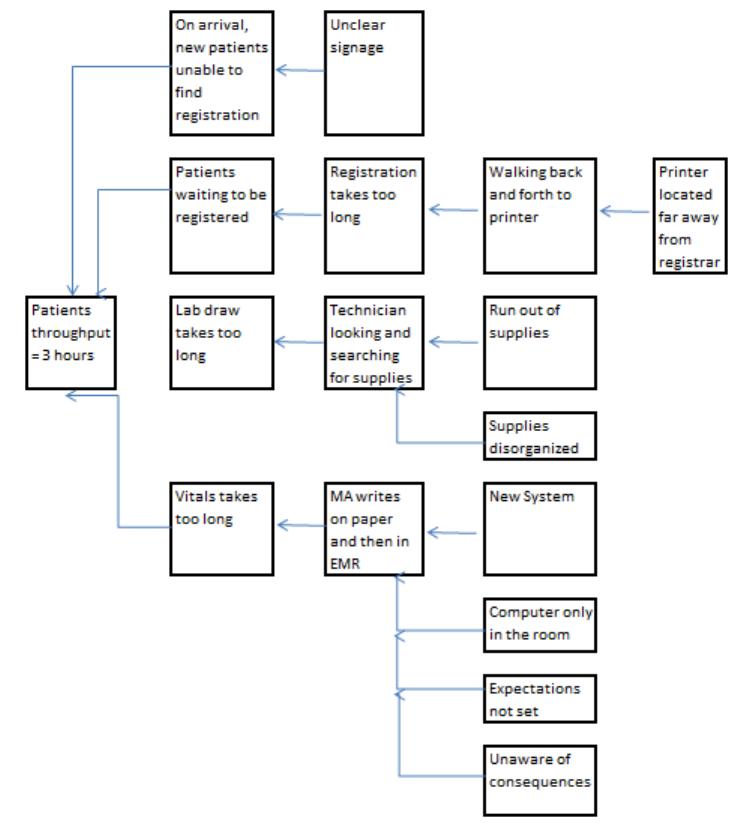
Before the students can draw the Future State Map, it is recommended that they do a root cause
analysis to really understand all possible causes leading to the inefficiencies in the process.
Figure 5 provides an example of a cause map. The cause map employs the 5-Why method to get
to the root causes. The reason for this approach is two-fold:
• Eliminate the source of the problem instead of implementing solutions that only address
the symptoms of the problem.
• Address the problem systemically by covering all fields- mistake-proofing the process.
9
Figure 5: Cause Map
10
The boxes to the far right in the cause map indicate some of the root causes. After you reach the
root causes, encourage students to come up with more than one up to seven countermeasures for
each root cause. The countermeasures should then be prioritized based on criteria such as effort,
impact and cost. The countermeasures with highest impact and lowest cost and effort should be
implemented first.
Future State Map
Having identified the root causes and selecting the countermeasures, the students can then
construct a future state map for the Westerville Physician Practice. There can be several different
future state maps depending on the level of investments and organizational change recommended
by the students. The instructor can use this part of the case to discuss the following issues:
• Long term vs. Short term Investments (Bringing the printer closer to registrar vs. buying
registration kiosks)
• Add resources – does it make sense to add another check out person or MA or stagger
lunch to increase the available time?
• Training – how to train doctors and MAs in this complex environment?
• Cultural shifts – how to manage cultures and hierarchies to implement changes?
• Inventory management system and 5S in the lab
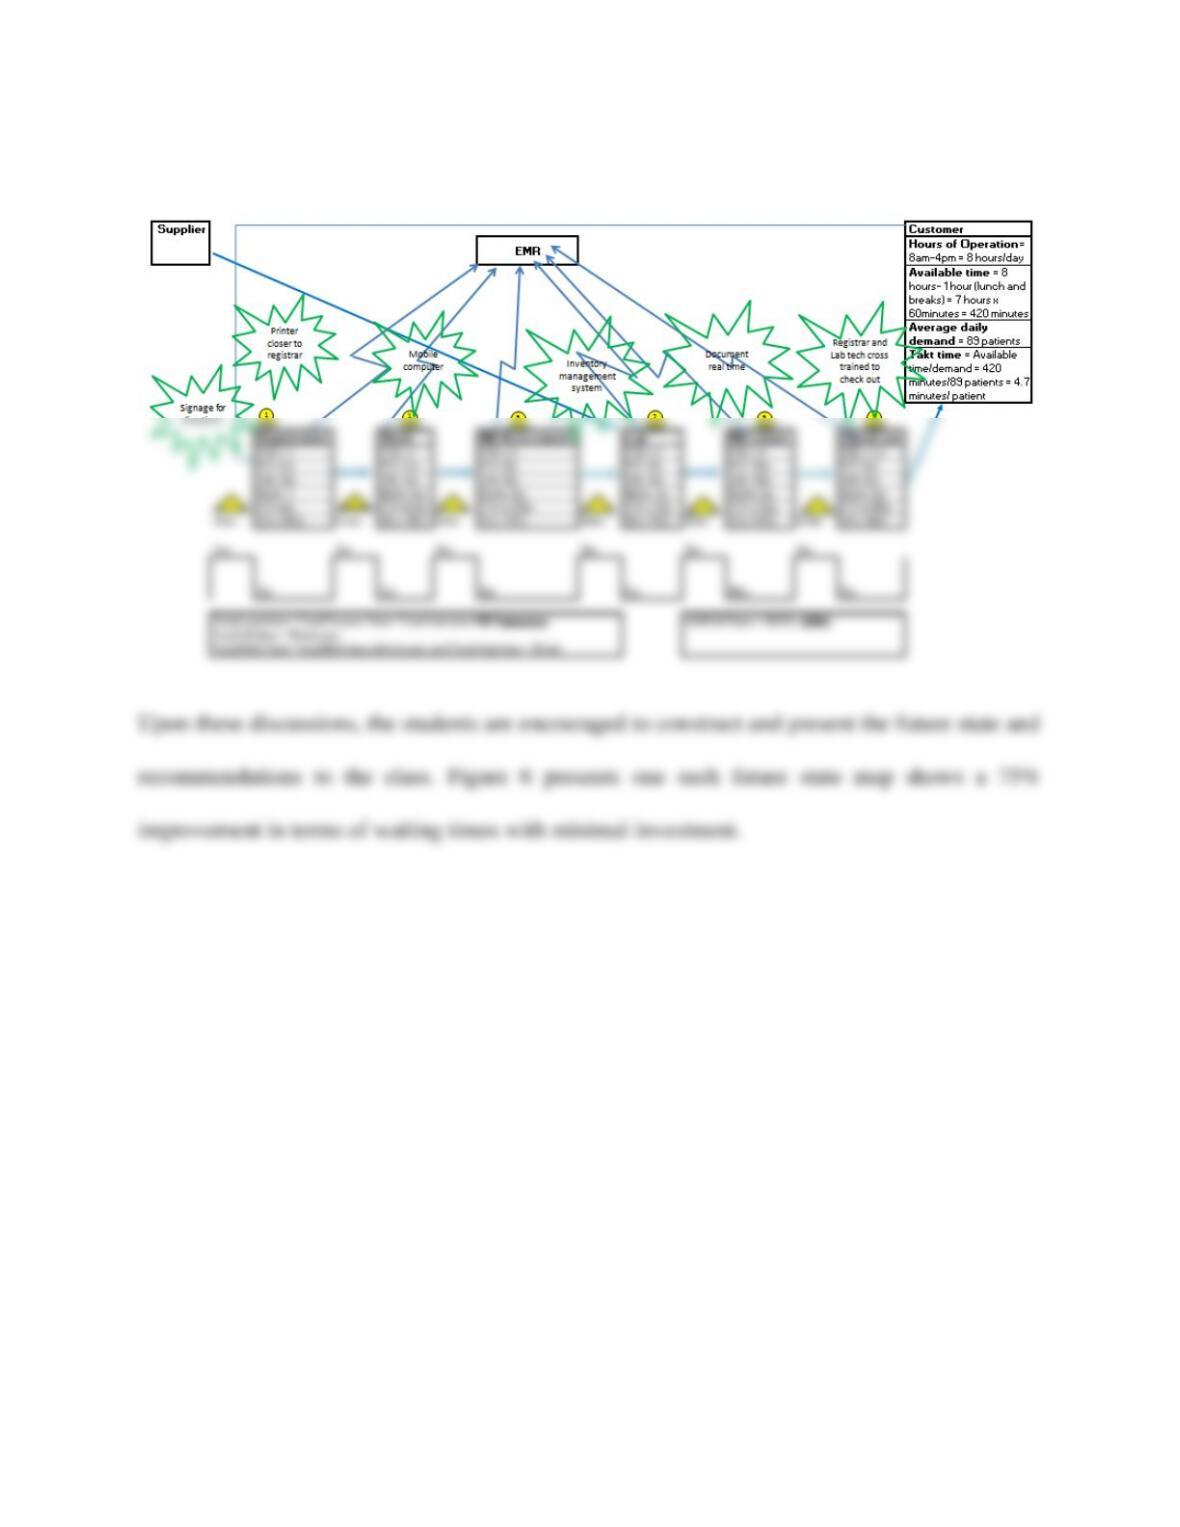
11
Figure 6: Future State Map