
ToysPlus, Inc.
Teaching Notes
1
Synopsis and Purpose
ToysPlus is a small company in the toy industry. They control the manufacturing of toys by
using an MRP System. Management wants to improve service levels and inventory turns by
doing a better job of planning and scheduling production. The case provides data on three toys
which are manufactured including the forecasts, costs, bill of materials, and planning factors for
these toys.
The purpose of this case is to illustrate the principles of scheduling with an MRP system. An
Excel spreadsheet is provided which accompanies the text to provide the MRP logic. The
student inputs forecasts, costs and a master schedule. The spreadsheet then performs detailed
parts explosions. The student must analyze the resulting schedules and re-plan until an
acceptable MRP plan is obtained. Some organizational issues are also presented in the case,
which are encountered in using a formal MRP system.
Discussion Questions
1. Calculate economic order quantities for each of the three types of toys. The EOQ
formula is recommended from the supplement to Chapter 14 that considers uniform lot
delivery of toys.
2. Prepare a master production schedule for the next 6 weeks using the EOQ‘s calculated
in Question 1 and a work force of 10 employees. What inventory turnover ratio is
achieved by this master schedule? How does this turnover compare with past levels
and with management’s goals?
3. Prepare a parts explosion to support the master schedule. What parts should be
ordered each week? Are there enough planned orders in time to support your master
schedule?
4. What should Andrea Meline do in order to meet the inventory and service goals stated
by management? Try another master schedule that is feasible using available parts and
has a turnover of 15.
5. How should Andrea deal with the organization issues presented in this case?
Analysis
The analysis of this case will be described using the Excel Worksheet provided with the text.
This analysis can be done by hand, but it is quite tedious.
The first thing the students should do is to input the forecasts into the worksheet. The forecasts
given in the case can be used directly, as shown in Exhibit 1. There is some question whether
the forecasts coming from marketing are accurate. Andrea Meline usually adjusts the marketing
forecasts, but we have no way of making any adjustments in this particular situation.
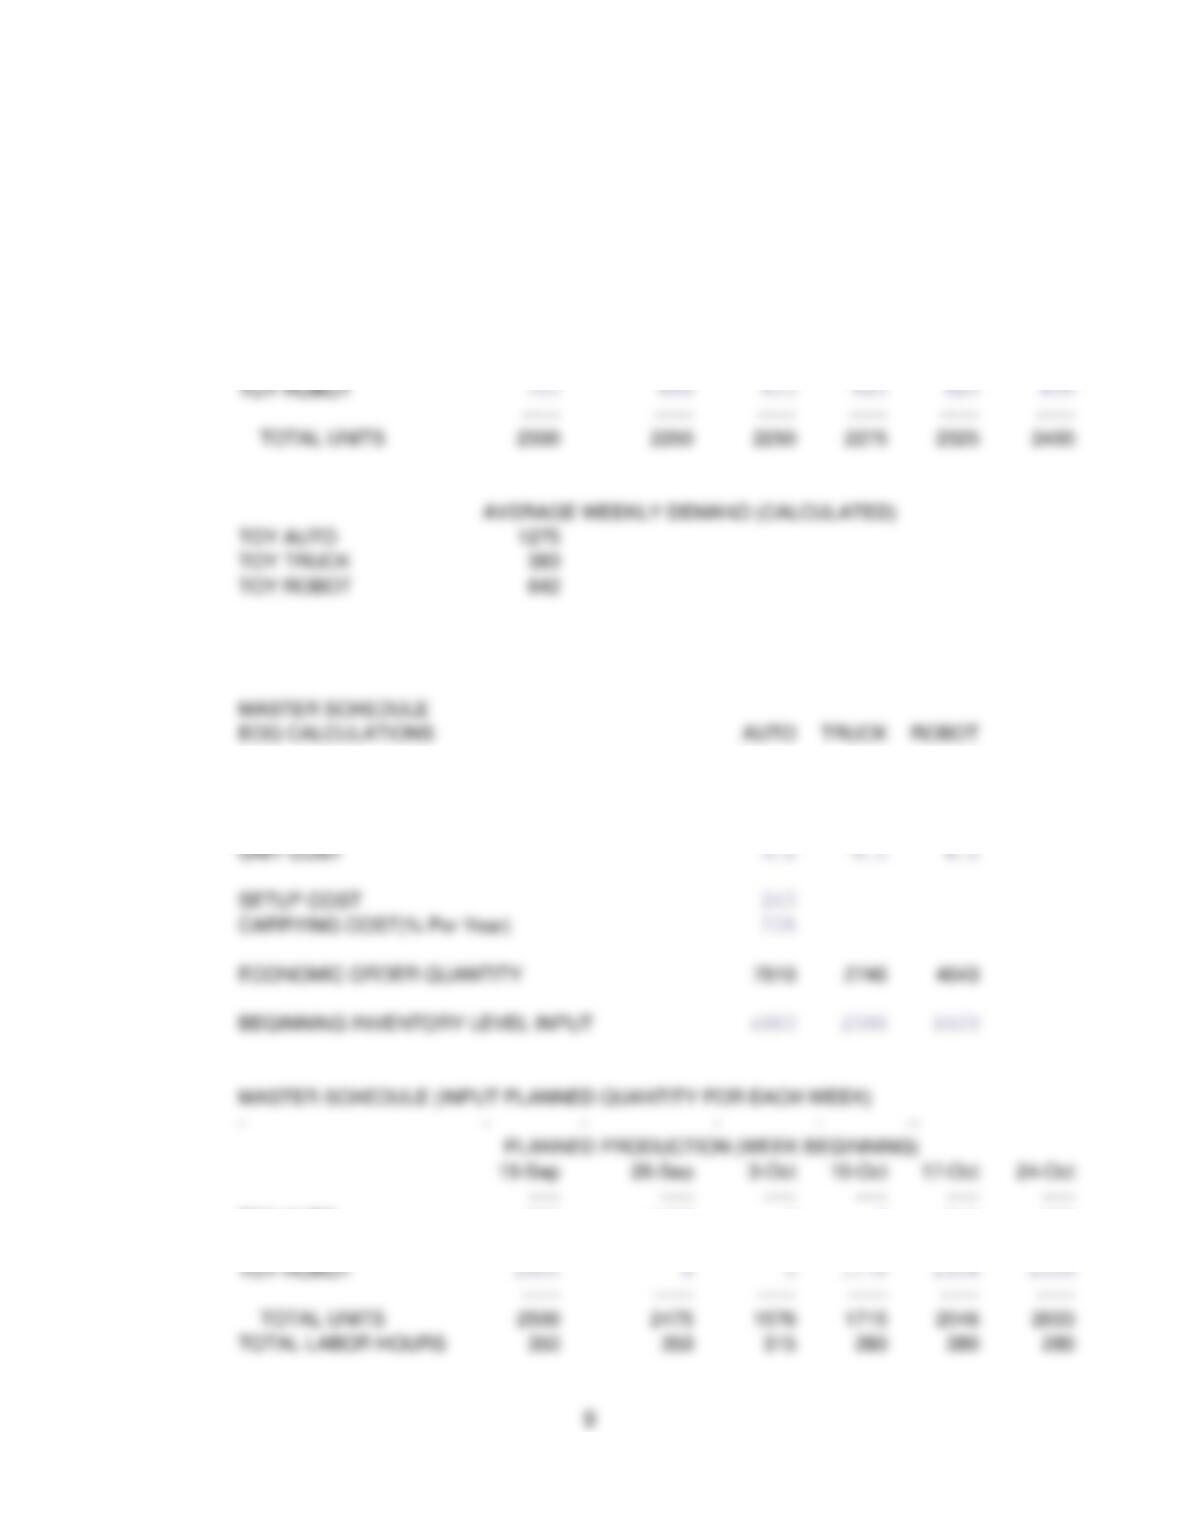
From the forecasts for each of the three toys, the spreadsheet will calculate average weekly
demand. These figures are used for EOQ and runout calculations. The next step is to calculate
the EOQ’s for each of the toys. These are calculated by entering the weekly toy production
rates and the unit costs given in the case, see Exhibit 1.
ToysPlus, Inc.
Teaching Notes
2
Next, the setup cost must be provided to the spreadsheet which is calculated as follows: Each
final assembly setup requires 1 hour of time by 10 direct labor people. The shop rate for direct
labor is $14 per hour for wages including fringe benefits. The cost of setting up the final
assembly line is therefore $140 (10 hours at $14 per hour). Each final assembly setup also
induces orders to be placed for components using a lot-for-lot procedure. As a matter of fact, 4
orders for components will be placed for each final assembly setup, since each toy has four
components. At $25 per order, this is an additional $100 for component orders. The total cost
of setup is therefore $240.
The carrying cost is given in the case as 25% per year. After entering carrying cost, the
program will calculate the EOQ’s for the three toys using the uniform lot delivery EOQ given in
the supplement to Chapter 14. The program then asks for the beginning inventory level input
for use later in the analysis.
The next step is to do master scheduling for each toy for each week. This is done by first
finding the smallest runout time which happens to occur for robots (runout time is just the
inventory level divided by demand and is interpreted as the length of time the present inventory
will last until we run out of stock). Robots are thus scheduled first with an EOQ of 4643 units.
Only 2267 units can be scheduled in the first week and stay within the capacity constraint of 350
hours (each robot takes .15 assembly hours). Only 2333 units of robots can be scheduled in
week 2 within the capacity constraint of 350 hours and the balance of the EOQ for robots (43
units) is scheduled for the third week. The product with the next lowest runout time, as shown
by the spreadsheet, is toy autos. We can produce 3340 of these toy autos in week 3 within the
capacity constraint of 350 hours (this includes 10 hours lost to the changeover). Then 3500
autos can be produced in week 4 and the balance of the EOQ for autos is produced in week 5.
Next, toy trucks have the lowest runout time, and we schedule the balance of the capacity for
toy trucks in week 5. This procedure is continued for week 6 to complete the master schedule.
The program then computes projected inventories and inventory turnover. Note, the turnover is
only 13.4 which does not meet management’s objective of 15 turns. This indicates that we
should revise the master schedule to reduce capacity and thus inventory. We will do this later,
but first we wish to check the feasibility of the master schedule with respect to component parts.
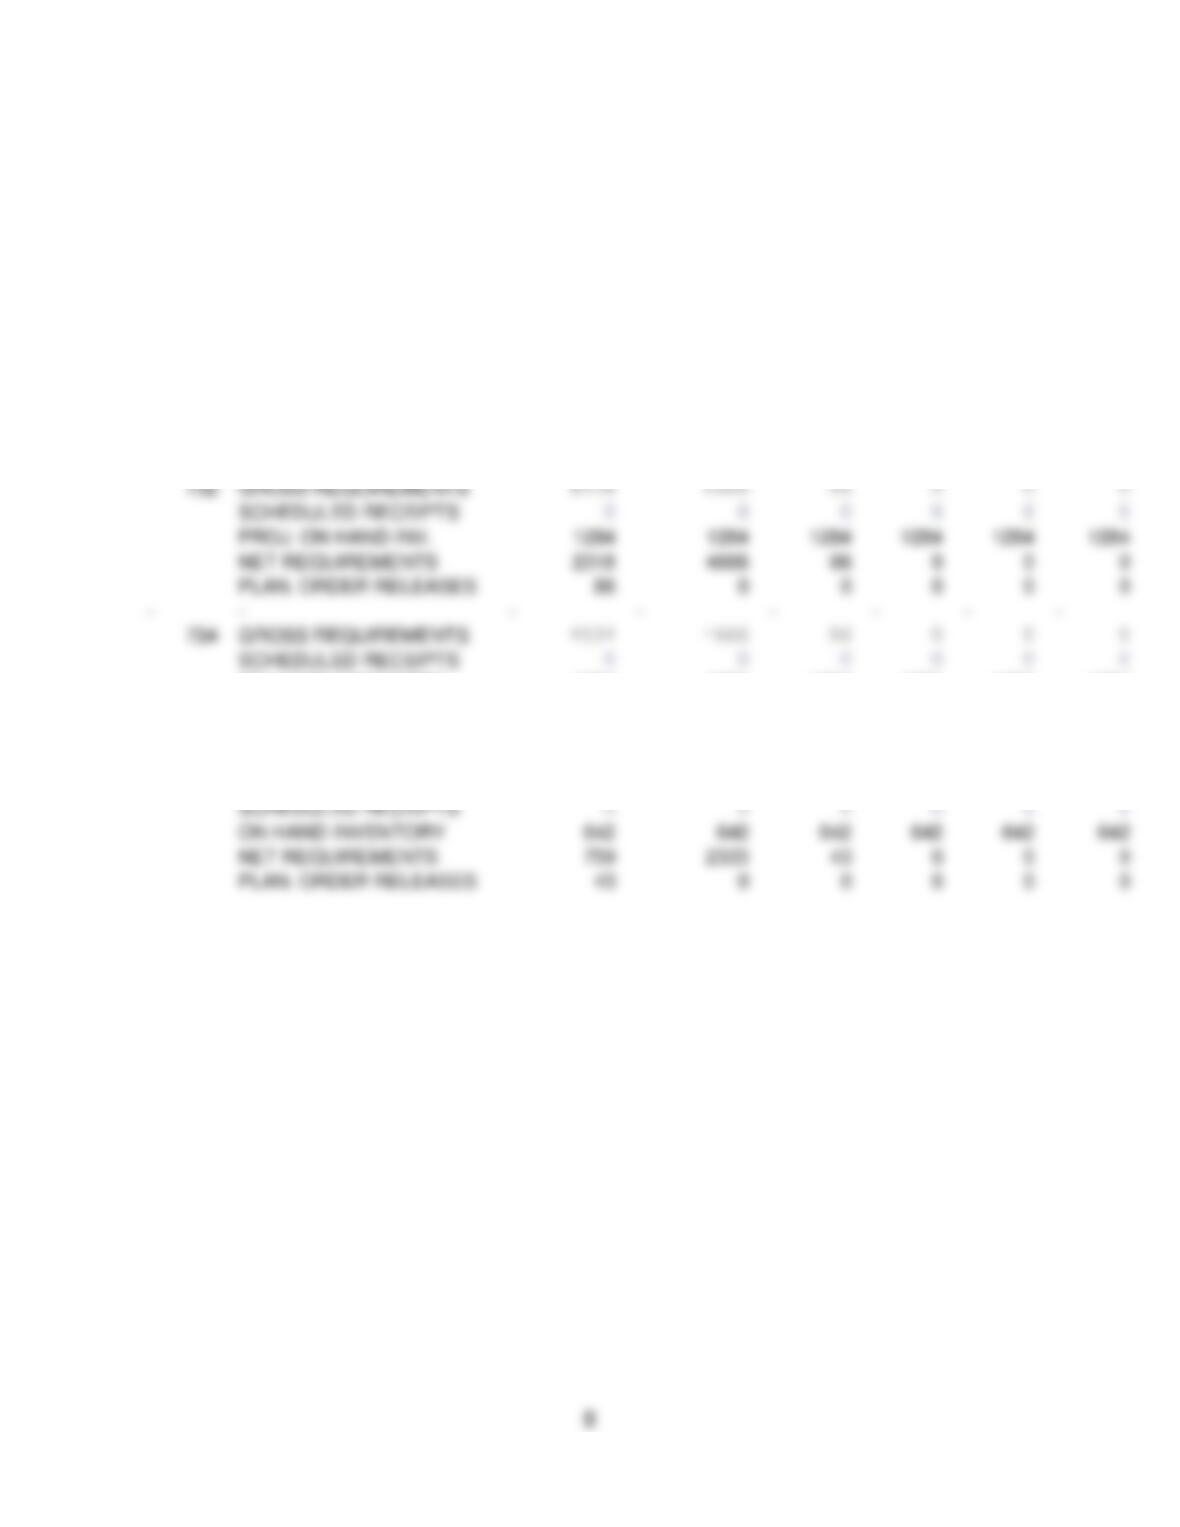
This is done by entering the safety stock levels which are desired into the spreadsheet.
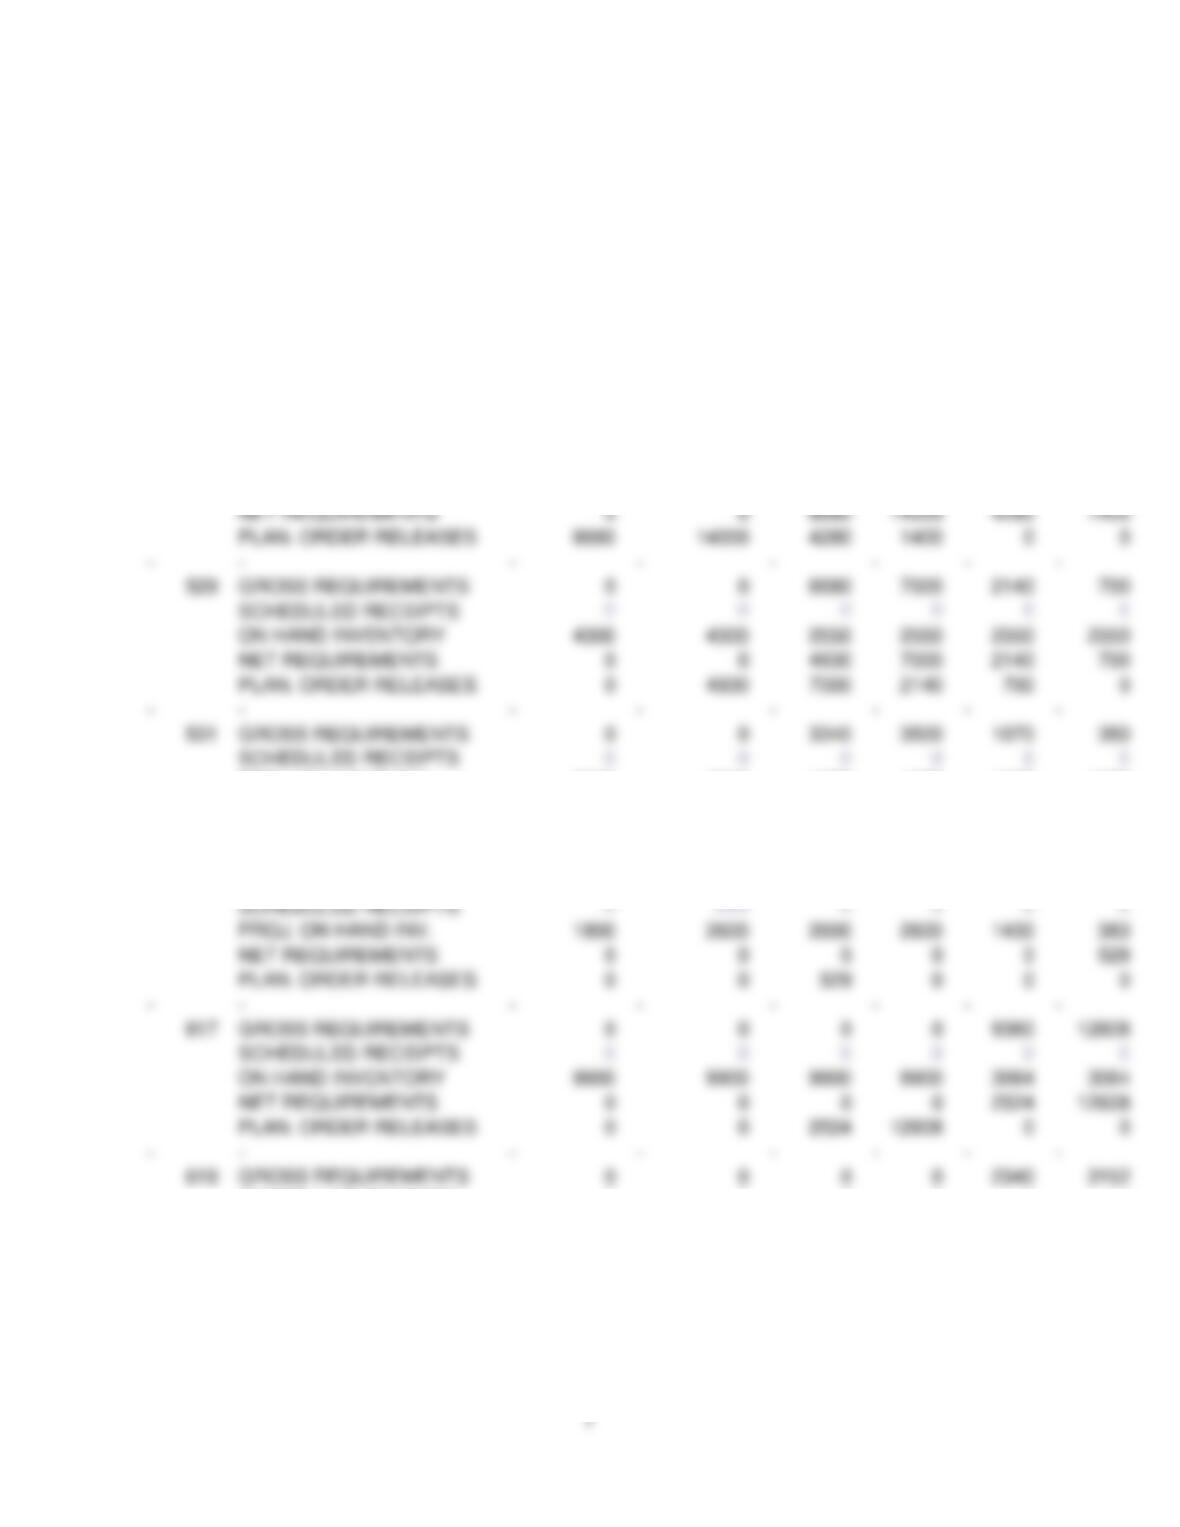
Beginning inventories, parts/unit and lead times are already shown in the spreadsheet. The
#523 has a net requirement of 2115 units on Oct 3 which is not translated into a planned order
ToysPlus, Inc.
Teaching Notes
3
release. Therefore, we will not have enough of part #523 to support the master schedule. In
the case of part number 525 all of the net requirements have been translated into planned order
releases, so we will have enough of these parts. This process of examination is continued and
indicates the following components are short of parts to support the master schedule #730,
#732, #734, and #736. This situation must be relieved by revising the master schedule to “live”
within the available parts.
The new master schedule is shown in Exhibit 2. This master schedule reflects the available
components and is reduced in capacity toward the end of the six-week period in order to
achieve 15 turns. This master schedule is constructed by using all of the available parts,
including the safety stock, but no more in scheduling each toy. For example, starting with
robots which have the lowest runout time, we can schedule 1600 robots based on the availabil-
ity of components. The constraining component in this case is robot bodies which take two
weeks to get. The next lowest runout time is autos, and we can schedule 2450 autos before we
run out of parts (900 in week 1 and 1550 in week 2).
This constraint of 2450 is based on the 9800 wheels which are used at the rate of 4 per auto
and it takes 2 weeks to get more. This process is continued until there is sufficient lead time to
schedule more units of each toy.
Note, that capacity is reduced to 315 hours in week 3 and then to 280 hours for the remainder of
the schedule. These numbers were selected by trial-and-error in order to increase inventory
turns. However, this capacity plan is not entirely satisfactory, because we should have enough
capacity at the end of the planning horizon to sustain the schedule. The required capacity in
week 6 and beyond can be computed as follows: 1500(.1) + 300(.2) + 600(.15) = 300 hours
based on a continuing demand of 1500 autos, 300 trucks and 600 robots from week 6 onward.
At the end of the horizon we have only 280 hours of capacity, so perhaps we should cut
capacity sooner, but not as deeply.
Review of the parts explosion in Exhibit 2 shows that the plan is feasible and all net
requirements are met with planned order releases or safety stock. This plan also meets
management’s requirement for 15 turns. We have no way of estimating the service level
provided without knowing more about the standard deviation of forecast errors.
So far, we have answered the first 4 case discussion questions. Question 5 asks how Andrea
should deal with the organization issues presented in this case. I think that the essence of the
answer to this question is that she needs cooperation from all of the departments to develop
and implement her production plans. Marketing should be held accountable for the accuracy of
its forecasts. Andrea should not adjust the forecasts that marketing gives her without
negotiating changes with marketing. Purchasing should buy what is ordered by production.
When everyone is working to the same production plan, improved results will be achieved. This
is easier said than done, but cooperation among functions is the essence to achieving good
results from a formal production planning system.
One way to help achieve the level of cooperation needed is to have all Department Heads and
the General Manager meet each week to review and approve the final production plans
developed. This meeting will help insure that everyone has agreed to the same set of numbers
and assumptions. The company must also reward a cooperative team approach and

ToysPlus, Inc.
Teaching Notes
4
management must not override the formal system with edicts. Discipline to live by the agreed
plan is needed by everyone.
Teaching Strategy
In teaching this case I start by asking a student to give me the master schedule for the next six
weeks. After writing this schedule on the board, or entering it into a powerpoint slide, I ask the
student to explain how the numbers were derived. Other students will then propose alternative
master schedules and different sets of assumptions. For example, some of the master
schedules provided by students may be infeasible with regard to available component parts,
and other master schedules may not provide the required 15 inventory turns. These points can
be brought out by the instructor as the discussion proceeds.
One of the other pitfalls in this case is the setup cost. Some students may not include the
ordering costs for components along with the final assembly line setup costs. Students may
also forget to include safety stock in their calculations or they may calculate it incorrectly. There
are many numbers in this case and one false input changes the answer.
This case provides an excellent vehicle for explaining the concepts of production planning. The
case illustrates rough-cut capacity planning which is done at the master schedule level, by the
350 hour limit. We do not, however, have detailed capacity planning, because no work center
data is incorporated in the case. EOQ calculations, the handling of safety stock, restrictions
from component parts, and leveling the master schedule can all be illustrated. The disk
provides a useful vehicle to relieve the students of the drudgery of calculations. It also guides
them through the calculations that are needed. It will take about one hour to teach the case.

ToysPlus, Inc.
Teaching Notes
Exhibit 1
MASTER SCHEDULE FORECAST INPUT
–
–
—–
19-Sep
26-Sep
3-Oct
10–Oct
17–Oct
24–Oct
—–
—–
—–
—–
—–
—–
TOY AUTO
1100
1150
1200
1300
1400
1500
TOY TRUCK
500
450
400
350
300
300
TOY ROBOT
700
650
650
625
625
600
——
——
——
——
——
——
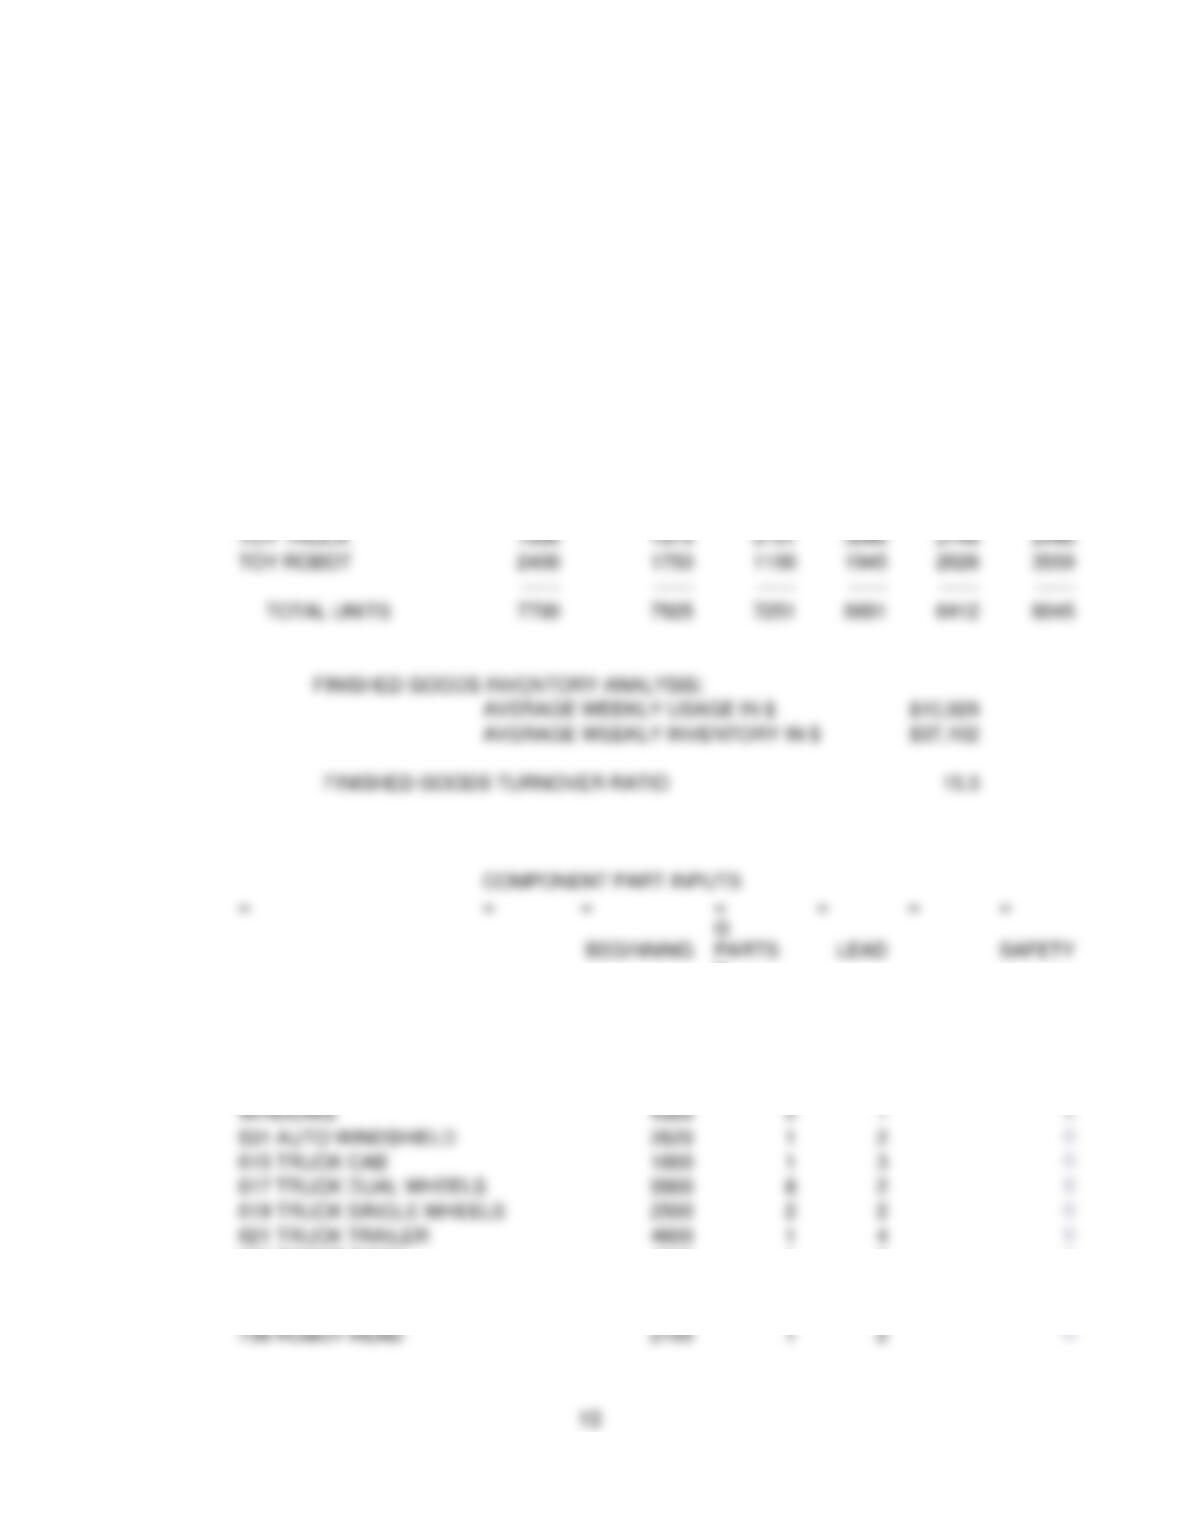
TOTAL UNITS
2300
2250
2250
2275
2325
2400
AVERAGE WEEKLY DEMAND (CALCULATED)
TOY AUTO
1275
TOY TRUCK
383
TOY ROBOT
642
MASTER SCHEDULE
EOQ CALCULATIONS
AUTO
TRUCK
ROBOT
–
————
—–
—–
—–
WEEKLY DEMAND
RATE
1275
383
642
PRODUCTION RATE PER WEEK
3500
1750
2333
UNIT COST
3.2
6.5
4.1
SETUP COST
240
CARRYING COST(% Per Year)
25%
ECONOMIC ORDER QUANTITY
7910
2746
4643
BEGINNING INVENTORY LEVEL INPUT
4000
2000
1500
MASTER SCHEDULE (INPUT PLANNED QUANTITY FOR EACH WEEK)
–
–
–
–
–
—
PLANNED PRODUCTION (WEEK BEGINNING)
19-Sep
26-Sep
3-Oct
10–Oct
17–Oct
24–Oct
—–
—–
—–
—–
—–
—–
TOY AUTO
0
0
3340
3500
1070
350
TOY TRUCK
0
0
0
0
1170
1576
TOY ROBOT
2267
2333
43
0
0
0
——
——
——
——
——
——
TOTAL UNITS
2267
2333
3383
3500
2240
1926
TOTAL LABOR HOURS
350
350
350
350
351
350

ToysPlus, Inc.
Teaching Notes
6
CALCULATED RUN-OUT TIMES (WEEKS)
EOQ
–
–
–
–
TOY AUTO
9.6
7910
TOY TRUCK
12.4
2746
TOY ROBOT
9.6
4643
PROJECTED INVENTORIES OF FINISHED GOODS
19-Sep
26-Sep
3-Oct
10–Oct
17–Oct
24–Oct
—–
—–
–—-
—–
—–
—–
TOY AUTO
2900
1750
3890
6090
5760
4610
TOY TRUCK
1500
1050
650
300
1170
2446
TOY ROBOT
3067
4750
4143
3518
2893
2293
——
——
——
——
——
——
TOTAL UNITS
7467
7550
8683
9908
9823
9349
FINISHED GOODS INVENTORY ANALYSIS:
AVERAGE WEEKLY USAGE IN $
$10,929
AVERAGE WEEKLY INVENTORY IN $
$42,557
FINISHED GOODS TURNOVER RATIO
13.4
COMPONENT PART INPUTS
=
=
=
=
=
=
=
BEGINNING
G
PARTS
LEAD
SAFETY
COMPENENT PART
INVENTORY
Y
\UNIT
TIME
STOCK
–
–
–
–
–
–
–
523 CAR BODY
2500
1
3
1275
525 AUTO WHEELS
9800
4
2
5100
529 AUTO SIDE
WINDOWS
4300
2
1
2550
531 AUTO WINDSHIELD
2620
1
2
1275
615 TRUCK CAB
1800
1
3
383
617 TRUCK DUAL WHEELS
9900
8
2
3064
619 TRUCK SINGLE WHEELS
2500
2
2
766
621 TRUCK TRAILER
4600
1
4
383
730 ROBOT BODY
1600
1
2
642
732 ROBOT ARMS
3500
2
2
1284
734 ROBOT LEGS
4020
2
1
1284
736 ROBOT HEAD
2150
1
2
642
ToysPlus, Inc.
Teaching Notes
COMPONENT PARTS EXPLOSION
WEEK BEGINNING
19-Sep
26-Sep
3-Oct
10–Oct
17–Oct
24–Oct
–
–
–
–
–
–
–
523
GROSS REQUIREMENTS
0
0
3340
3500
1070
350
SCHEDULED RECEIPTS
0
0
0
0
0
0
PROJ. ON HAND INV.
2500
2500
1275
1275
1275
1275
NET REQUIREMENTS
0
0
2115
3500
1070
350
PLAN. ORDER RELEASES
3500
1070
350
0
0
0
–
–
–
–
–
–
–
–
525
GROSS REQUIREMENTS
0
0
13360
14000
4280
1400
SCHEDULED RECEIPTS
0
0
0
0
0
0
PROJ. ON HAND INV.
9800
9800
5100
5100
5100
5100
NET REQUIREMENTS
0
0
8660
14000
4280
1400
PLAN. ORDER RELEASES
8660
14000
4280
1400
0
0
–
–
–
–
–
–
–
–
529
GROSS REQUIREMENTS
0
0
6680
7000
2140
700
SCHEDULED RECEIPTS
0
0
0
0
0
0
ON HAND INVENTORY
4300
4300
2550
2550
2550
2550
NET REQUIREMENTS
0
0
4930
7000
2140
700
PLAN. ORDER RELEASES
0
4930
7000
2140
700
0
–
–
–
–
–
–
–
–
531
GROSS REQUIREMENTS
0
0
3340
3500
1070
350
SCHEDULED RECEIPTS
0
0
0
0
0
0
PROJ. ON HAND INV.
2620
2620
1275
1275
1275
1275
NET REQUIREMENTS
0
0
1995
3500
1070
350
PLAN. ORDER RELEASES
1995
3500
1070
350
0
0
–
–
–
–
–
–
–
–
615
GROSS REQUIREMENTS
0
0
0
0
1170
1576
SCHEDULED RECEIPTS
0
800
0
0
0
0
PROJ. ON HAND INV.
1800
2600
2600
2600
1430
383
NET REQUIREMENTS
0
0
0
0
0
529
PLAN. ORDER RELEASES
0
0
529
0
0
0
–
–
–
–
–
–
–
–
617
GROSS REQUIREMENTS
0
0
0
0
9360
12608
SCHEDULED RECEIPTS
0
0
0
0
0
0
ON HAND INVENTORY
9900
9900
9900
9900
3064
3064
NET REQUIREMENTS
0
0
0
0
2524
12608
PLAN. ORDER RELEASES
0
0
2524
12608
0
0
–
–
–
–
–
–
–
–
619
GROSS REQUIREMENTS
0
0
0
0
2340
3152
SCHEDULED RECEIPTS
0
0
0
0
0
0
PROJ. ON HAND INV.
2500
2500
2500
2500
766
766
NET REQUIREMENTS
0
0
0
0
606
3152
PLAN. ORDER RELEASES
0
0
606
3152
0
0
–
–
–
–
–
–
–
–
ToysPlus, Inc.
Teaching Notes
621
GROSS REQUIREMENTS
0
0
0
0
1170
1576
SCHEDULED RECEIPTS
0
0
1200
0
0
0
ON HAND INVENTORY
4600
4600
5800
5800
4630
3054
NET REQUIREMENTS
0
0
0
0
0
0
PLAN. ORDER RELEASES
0
0
0
0
0
0
–
–
–
–
–
–
–
–
730
GROSS REQUIREMENTS
2267
2333
43
0
0
0
SCHEDULED RECEIPTS
0
0
0
0
0
0
ON HAND INVENTORY
642
642
642
642
642
642
NET REQUIREMENTS
1309
2333
43
0
0
0
PLAN. ORDER RELEASES
43
0
0
0
0
0
–
–
–
–
–
–
–
–
732
GROSS REQUIREMENTS
4534
4666
86
0
0
0
SCHEDULED RECEIPTS
0
0
0
0
0
0
PROJ. ON HAND INV.
1284
1284
1284
1284
1284
1284
NET REQUIREMENTS
2318
4666
86
0
0
0
PLAN. ORDER RELEASES
86
0
0
0
0
0
–
–
–
–
–
–
–
–
734
GROSS REQUIREMENTS
4534
4666
86
0
0
0
SCHEDULED RECEIPTS
0
0
0
0
0
0
ON HAND INVENTORY
1284
1284
1284
1284
1284
1284
NET REQUIREMENTS
1798
4666
86
0
0
0
PLAN. ORDER RELEASES
4666
86
0
0
0
0
–
–
–
–
–
–
–
–
736
GROSS REQUIREMENTS
2267
2333
43
0
0
0
SCHEDULED RECEIPTS
0
0
0
0
0
0
ON HAND INVENTORY
642
642
642
642
642
642
NET REQUIREMENTS
759
2333
43
0
0
0
PLAN. ORDER RELEASES
43
0
0
0
0
0
ToysPlus, Inc.
Teaching Notes
Exhibit 2
MASTER SCHEDULE FORECAST INPUT
–
–
—–
19-Sep
26-Sep
3-Oct
10–Oct
17–Oct
24–Oct
—–
—–
—–
—–
—–
—–
TOY AUTO
1100
1150
1200
1300
1400
1500
TOY TRUCK
500
450
400
350
300
300
TOY ROBOT
700
650
650
625
625
600
——
——
——
——
——
——
TOTAL UNITS
2300
2250
2250
2275
2325
2400
AVERAGE WEEKLY DEMAND (CALCULATED)
TOY AUTO
1275
TOY TRUCK
383
TOY ROBOT
642
MASTER SCHEDULE
EOQ CALCULATIONS
AUTO
TRUCK
ROBOT
–
————
—–
—–
—–
WEEKLY DEMAND
RATE
1275
383
642
PRODUCTION RATE PER WEEK
3500
1750
2333
UNIT COST
3.2
6.5
4.1
SETUP COST
240
CARRYING COST(% Per Year)
25%
ECONOMIC ORDER QUANTITY
7910
2746
4643
BEGINNING INVENTORY LEVEL INPUT
4000
2000
1500
MASTER SCHEDULE (INPUT PLANNED QUANTITY FOR EACH WEEK)
–
–
–
–
–
—
PLANNED PRODUCTION (WEEK BEGINNING)
19-Sep
26-Sep
3-Oct
10–Oct
17–Oct
24–Oct
—–
—–
—–
—–
—–
—–
TOY AUTO
900
1550
0
0
740
500
TOY TRUCK
0
925
1576
245
0
0
TOY ROBOT
1600
0
0
1470
1306
1533
——
——
——
–—–
——
——
TOTAL UNITS
2500
2475
1576
1715
2046
2033
TOTAL LABOR HOURS
350
350
315
280
280
280
ToysPlus, Inc.
Teaching Notes
CALCULATED RUN-OUT TIMES (WEEKS)
EOQ
–
–
–
–
TOY AUTO
6.0
7910
TOY TRUCK
12.4
2746
TOY ROBOT
11.5
4643
PROJECTED INVENTORIES OF FINISHED GOODS
19-Sep
26-Sep
3-Oct
10–Oct
17–Oct
24–Oct
—–
—–
—–
—–
—–
—–
TOY AUTO
3800
4200
3000
1700
1040
40
TOY TRUCK
1500
1975
3151
3046
2746
2446
TOY ROBOT
2400
1750
1100
1945
2626
3559
——
——
——
——
——
——
TOTAL UNITS
7700
7925
7251
6691
6412
6045
FINISHED GOODS INVENTORY ANALYSIS:
AVERAGE WEEKLY USAGE IN $
$10,929
AVERAGE WEEKLY INVENTORY IN $
$37,102
FINISHED GOODS TURNOVER RATIO
15.3
COMPONENT PART INPUTS
=
=
=
=
=
=
=
BEGINNING
G
PARTS
LEAD
SAFETY
COMPENENT PART
INVENTORY
Y
\UNIT
TIME
STOCK
–
–
–
–
–
–
–
523 CAR BODY
2500
1
3
0
525 AUTO WHEELS
9800
4
2
0
529 AUTO SIDE
WINDOWS
4300
2
1
0
531 AUTO WINDSHIELD
2620
1
2
0
615 TRUCK CAB
1800
1
3
0
617 TRUCK DUAL WHEELS
9900
8
2
0
619 TRUCK SINGLE WHEELS
2500
2
2
0
621 TRUCK TRAILER
4600
1
4
0
730 ROBOT BODY
1600
1
2
0
732 ROBOT ARMS
3500
2
2
0
734 ROBOT LEGS
4020
2
1
0
736 ROBOT HEAD
2150
1
2
0
ToysPlus, Inc.
Teaching Notes
COMPONENT PARTS EXPLOSION
WEEK BEGINNING
19-Sep
26-Sep
3-Oct
10–Oct
17–Oct
24–Oct
–
–
–
–
–
–
–
523
GROSS
REQUIREMENTS
900
1550
0
0
740
500
SCHEDULED RECEIPTS
0
0
0
0
0
0
PROJ. ON HAND INV.
1600
50
50
50
0
0
NET REQUIREMENTS
0
0
0
0
690
500
PLAN. ORDER
RELEASES
0
690
500
0
0
0
–
–
–
–
–
–
–
–
525
GROSS
REQUIREMENTS
3600
6200
0
0
2960
2000
SCHEDULED RECEIPTS
0
0
0
0
0
0
PROJ. ON HAND INV.
6200
0
0
0
0
0
NET REQUIREMENTS
0
0
0
0
2960
2000
PLAN. ORDER
RELEASES
0
0
2960
2000
0
0
–
–
–
–
–
–
–
–
529
GROSS
REQUIREMENTS
1800
3100
0
0
1480
1000
SCHEDULED RECEIPTS
0
0
0
0
0
0
ON HAND INVENTORY
2500
0
0
0
0
0
NET REQUIREMENTS
0
600
0
0
1480
1000
PLAN. ORDER
RELEASES
600
0
0
1480
1000
0
–
–
–
–
–
–
–
–
531
GROSS
REQUIREMENTS
900
1550
0
0
740
500
SCHEDULED RECEIPTS
0
0
0
0
0
0
PROJ. ON HAND INV.
1720
170
170
170
0
0
NET REQUIREMENTS
0
0
0
0
570
500
PLAN. ORDER
RELEASES
0
0
570
500
0
0
–
–
–
–
–
–
–
–
615
GROSS
REQUIREMENTS
0
925
1576
245
0
0
SCHEDULED RECEIPTS
0
800
0
0
0
0
PROJ. ON HAND INV.
1800
1675
99
0
0
0
NET REQUIREMENTS
0
0
0
146
0
0
PLAN. ORDER
RELEASES
146
0
0
0
0
0
–
–
–
–
–
–
–
–
617
GROSS
REQUIREMENTS
0
7400
12608
1960
0
0
SCHEDULED RECEIPTS
0
0
0
0
0
0
ON HAND INVENTORY
9900
2500
0
0
0
0
NET REQUIREMENTS
0
0
10108
1960
0
0
PLAN. ORDER
RELEASES
10108
1960
0
0
0
0
ToysPlus, Inc.
Teaching Notes
619
GROSS
REQUIREMENTS
0
1850
3152
490
0
0
SCHEDULED RECEIPTS
0
0
0
0
0
0
PROJ. ON HAND INV.
2500
650
0
0
0
0
NET REQUIREMENTS
0
0
2502
490
0
0
PLAN. ORDER
RELEASES
2502
490
0
0
0
0
–
–
–
–
–
–
–
–
621
GROSS
REQUIREMENTS
0
925
1576
245
0
0
SCHEDULED RECEIPTS
0
0
1200
0
0
0
ON HAND INVENTORY
4600
3675
3299
3054
3054
3054
NET REQUIREMENTS
0
0
0
0
0
0
PLAN. ORDER
RELEASES
0
0
0
0
0
0
–
–
–
–
–
–
–
–
730
GROSS
REQUIREMENTS
1600
0
0
1470
1306
1533
SCHEDULED RECEIPTS
0
0
0
0
0
0
ON HAND INVENTORY
0
0
0
0
0
0
NET REQUIREMENTS
0
0
0
1470
1306
1533
PLAN. ORDER
RELEASES
0
1470
1306
1533
0
0
–
–
–
–
–
–
–
–
732
GROSS
REQUIREMENTS
3200
0
0
2940
2612
3066
SCHEDULED RECEIPTS
0
0
0
0
0
0
PROJ. ON HAND INV.
300
300
300
0
0
0
NET REQUIREMENTS
0
0
0
2640
2612
3066
PLAN. ORDER
RELEASES
0
2640
2612
3066
0
0
–
–
–
–
–
–
–
–
734
GROSS
REQUIREMENTS
3200
0
0
2940
2612
3066
SCHEDULED RECEIPTS
0
0
0
0
0
0
ON HAND INVENTORY
820
820
820
0
0
0
NET REQUIREMENTS
0
0
0
2120
2612
3066
PLAN. ORDER
RELEASES
0
0
2120
2612
3066
0
–
–
–
–
–
–
–
–
736
GROSS
REQUIREMENTS
1600
0
0
1470
1306
1533
SCHEDULED RECEIPTS
0
0
0
0
0
0
ON HAND INVENTORY
550
550
550
0
0
0
NET REQUIREMENTS
0
0
0
920
1306
1533
PLAN. ORDER
RELEASES
0
920
1306
1533
0
0
–
–
–
–
–
–
–
–