
Toledo Custom Manufacturing: Quality Control
Teaching Notes
Synopsis and Purpose
Toledo Custom Manufacturing (TCM) makes machined steel parts to customer specification. They
have a variety of machines that can hold tight tolerances. In this case they have just received an
order for 5000 steel pusher rods that are used by the customer to make hydraulic cylinders. Each
rod must be machined to .500 ± .005 (five thousands tolerance). The parts must therefore be
between .495 and .505 to meet the specification.
Data is provided in the case and shown below for samples made on two different machines with two
different operators. Each machine makes a sample of 5 parts for 6 runs or a total of 30 parts. These
parts are measured and the resulting measurements are used to make variables control charts, one
for operator 1–machine1 and the other for operator2-machine 2. The 30 sample parts for each
operator-machine combination are used to establish the grand average mean and the average range,
along with UCL, CL and LCL to demonstrate to TCM and the customer that the process is in
control for making the parts. If the process is in control, the operator–machine combination can
continue to make parts to be shipped to the customer along with the control chart itself to prove
statistical control of the process. TCM is asked to continue to take samples every hour and to send
the control chart along with the parts that are shipped.
If the process is not in control on a specific machine or both machines, the process must be
corrected and another sample of 30 parts taken until process control is achieved. Students are also
asked to calculate process capability indices Cp and Cpk and to interpret the results of these
calculations.
The purpose of this case is to provide a problem in statistical quality control. Students must apply
control chart principles to find the cause of the problem and they are asked to recommend corrective
action. They are also asked to calculate process capability measures and to understand the
difference between a process being in control and one capable of meeting specifications.
Discussion Questions
1. Calculate the control charts (UCL, CL and LCL) for each operator-machine combination
separately. Do this for both x-bar (average) and range charts. Draw conclusions from the
charts about each operator-machine combination.
2. What should be done based on the calculations from question 1?
3. What is the process capability for each operator-machine combination?
4. Can you be sure that all the parts produced by in-control processes will meet the
specification?
Analysis
Question 1:
The analysis for TCM is shown below. The first step is to compute the sample average and the
Question 2:
As can be noted from the spreadsheet operator1—machine 1 is in control in both average and
range. All of the sample averages and ranges fall within the control limits. The samples can
therefore be used to continue production and shipped to the customer. The customer has asked
Question 3:
Process capability for each operator-machine combination is shown at the bottom of the
Question 4:
A sharp student will recognize that the process capability calculated below is less than 1 and
therefore future parts are likely to be out of spec, even though the process is in control. The
Teaching Strategy
When teaching this case I start by asking a student to conduct a statistical analysis of the data.
Other students are then asked to comment on the analysis until several variations and
assumptions have been discussed.
When the data has been thoroughly analyzed, I then turn to a discussion of how the situation can
be corrected. Some students will miss the point that the process must first be brought under
control before statistical control charts can be used. That is several samples must be found to be
within the control chart limits to establish the grand average and the average range used. In this
case we require 6 samples of 5 each to insure we have a stable process. After that the control
chart can be used to continue production.
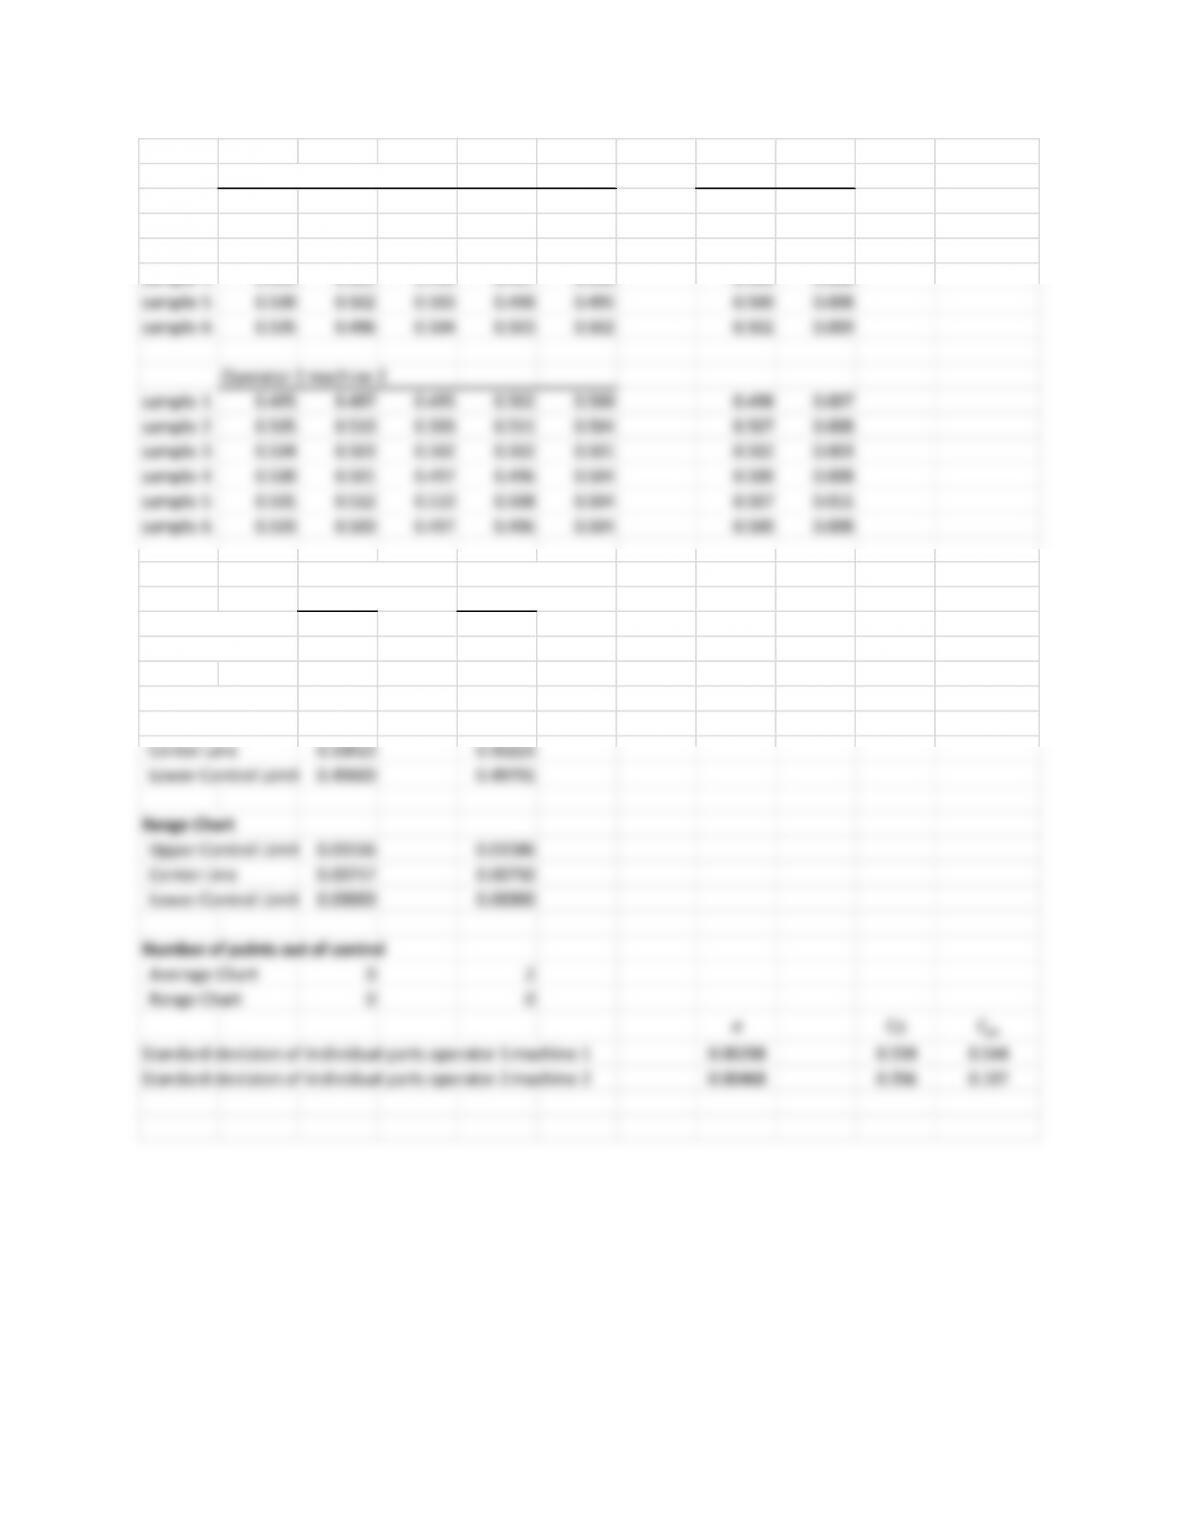
sample sample
Operator 1 machine 1 average range
sample 1 0.500 0.498 0.502 0.499 0.503 0.500 0.005
sample 2 0.496 0.497 0.500 0.502 0.499 0.499 0.006
sample 3 0.504 0.503 0.503 0.496 0.495 0.500 0.009
sample 4 0.503 0.501 0.498 0.497 0.500 0.500 0.006
sample 5 0.500 0.502 0.503 0.498 0.495 0.500 0.008
sample 6 0.505 0.496 0.504 0.503 0.502 0.502 0.009
Operator 2 machine 2
sample 1 0.495 0.497 0.495 0.502 0.500 0.498 0.007
sample 2 0.505 0.510 0.503 0.511 0.504 0.507 0.008
sample 3 0.504 0.503 0.502 0.502 0.501 0.502 0.003
sample 4 0.500 0.501 0.497 0.496 0.504 0.500 0.008
sample 5 0.501 0.512 0.510 0.508 0.504 0.507 0.011
sample 6 0.503 0.500 0.497 0.496 0.504 0.500 0.008
operator 1 operator 2
machine 1 machine 2
Grand Average 0.50013 0.50223
Average Range 0.00717 0.00750
Number of points out of control
Average Chart 0 2
Range Chart 0 0
σCp
Cpk
Standard deviaton of individual parts operator 1 machine 1 0.00298 0.559 0.544
Standard deviaton of individual parts operator 2 machine 2 0.00468 0.356 0.197