Chapter 09 – Quality Control and Improvement
9-1
Chapter 9
Quality Control and Improvement
Teaching Notes
This chapter presents standard material on statistical quality control. In the first part of
the chapter, general concepts of control such as the design of quality control systems, process
quality control, and use of control charts are discussed. Then process capability is described.
The seven tools of quality control for continuous improvement are discussed. Two techniques
for continuous improvement are described in detail: Pareto analysis and cause-and-effect
diagrams. Then Six Sigma is described along with Six Sigma and Lean. The chapter ends with a
discussion of how quality control ideas are used in the industry.
When teaching this chapter, we usually end with a lively discussion of the applications of
quality control ideas in a variety of settings (e.g., purchasing, data entry, repetitive
manufacturing, other functional areas like finance and marketing). Six Sigma is also a current
topic of interest to students, as well as Six Sigma and lean.
Answers to Questions
1. Statistical quality control ideas caught on in the 1940s when the commencement of
World War II created a huge demand for mass-produced goods. The need to inspect
2. It would be best not to inspect any chips. You would prefer to obtain chips from a
certified or qualified supplier with a process for making chips which is under statistical
control. In this case you are getting the minimum variation possible in chip quality
3. a. Inspection of food containers for the proper weight involves measurement by variables.
Chapter 09 – Quality Control and Improvement
9-2
Copyright © 2017 McGraw-Hill Education. All rights reserved. No reproduction or distribution without the prior written consent of
McGraw-Hill Education.
c. Inspecting appliances for surface imperfections involves attribute measurement. Each
scratch or nick counts as one defect on a discrete scale.
d. Inspecting candy bars for sugar content measures the variable of sugar content in
ounces or grams on a continuous scale.
4. Pros:
– Workers may produce fewer defects when they know an inspector will not be inspecting
their work because of a greater sense of responsibility.
– Workers may gain more job satisfaction (and perhaps less absenteeism and turnover)
5. Most production processes are not in statistical control when first sampled for control
chart purposes because unnecessary variability is occurring beyond the level of
6. The purpose of continuous improvement of quality is to reduce the variability of the
7. A Pareto chart identifies the many modes or sources of failure and their relative
8. a. Pareto chart d. R chart
Chapter 09 – Quality Control and Improvement
9-3
Copyright © 2017 McGraw-Hill Education. All rights reserved. No reproduction or distribution without the prior written consent of
McGraw-Hill Education.
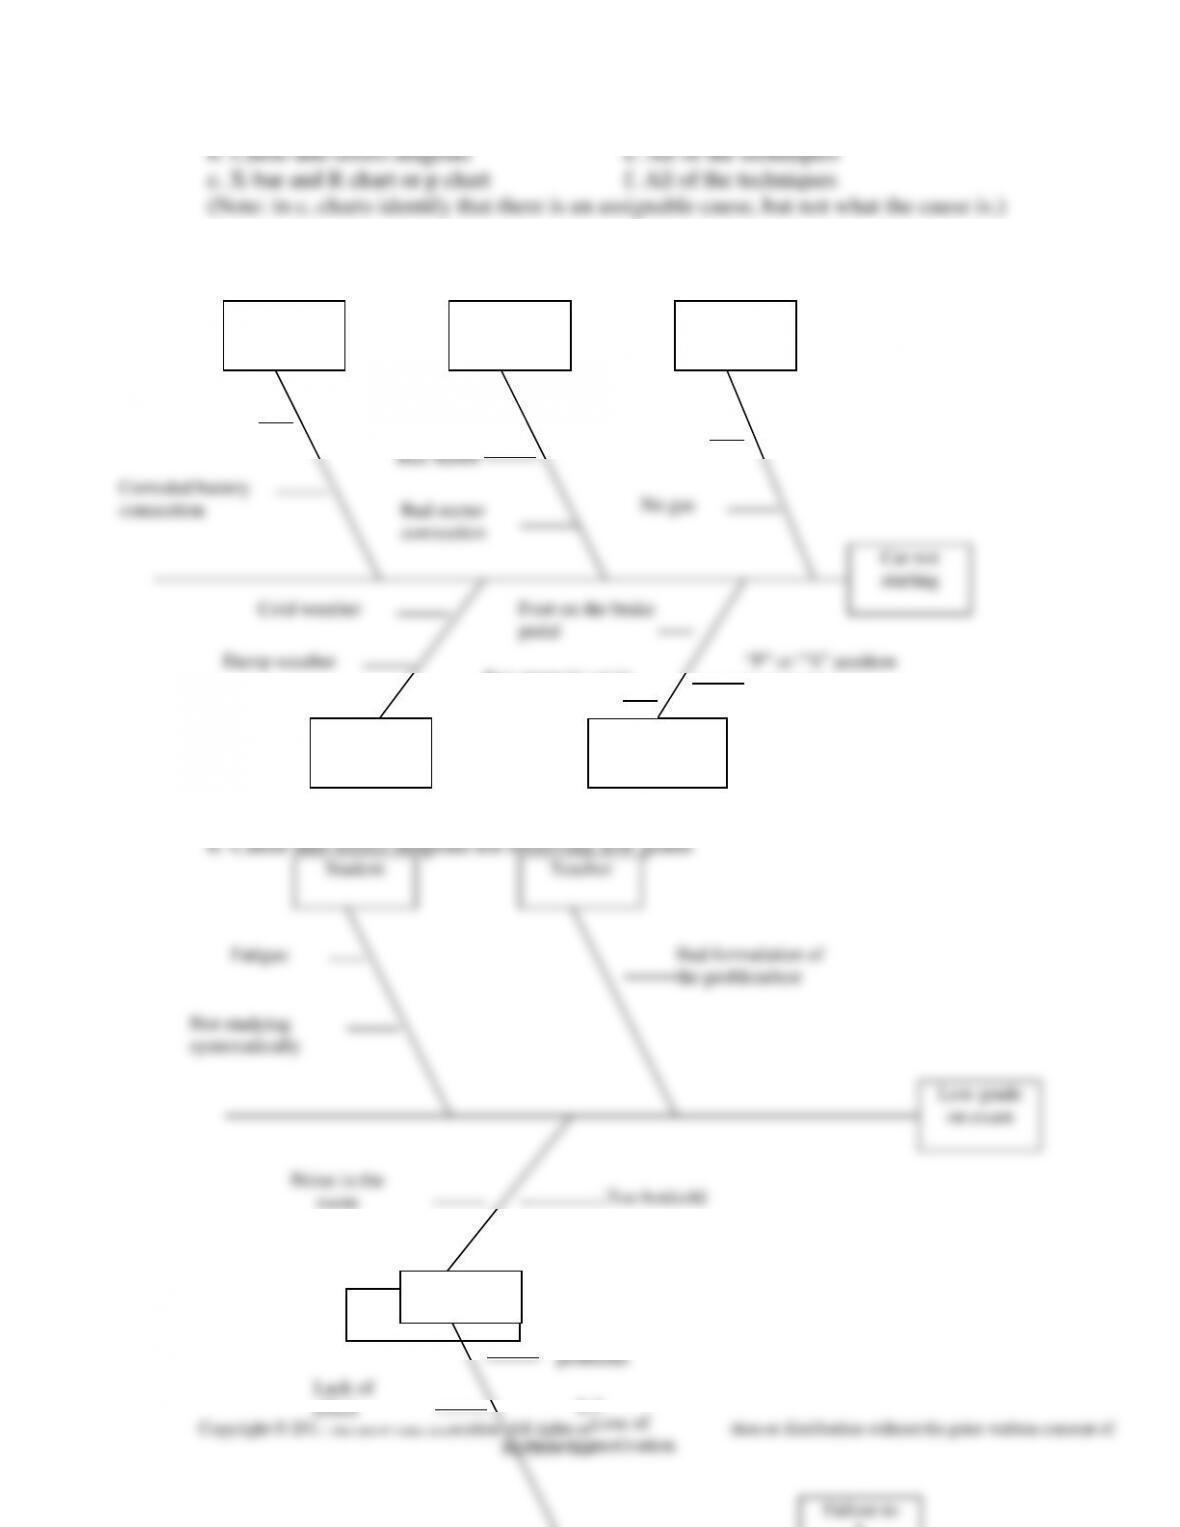
b. Cause-and-effect diagram e. All of the techniques
c. X-bar and R chart or p chart f. All of the techniques
(Note: in c, charts identify that there is an assignable cause, but not what the cause is.)
9. a. Cause-and-effect diagram for car not starting in the morning
Bad formulation of
the problem/test
Not studying
systematically
c. Cause-and-effect diagram for failing to graduate from college.
Corroded battery
connection
No gas
Cold weather
Damp weather
pedal
Electrical
system
Fuel system
Starting
procedure
Starter motor
Weather
condition
Low battery
Bad gas
Bad starter
Key properly set in
ignition
(automatic cars)
Environment
room
Too hot/cold
Student
Lack of
effort
Loss of
motivation
Personal
problems
9-4
10. First, Six Sigma is a metric because it is based on measuring variables that are critical to
product or service quality dimensions that are important to the customer. Specific
metrics include process sigma, process capability, and process yield. Second, Six Sigma
11. Define: Specify the project, including the process to be improved, the improvement
team, time schedule, etc.
Measure: Measure quality variables (for example, assume the following measures are
important to the customer):
Chapter 09 – Quality Control and Improvement
9-5
more books. The firm may require more marketing research to identify which books
12. Lean and Six Sigma can work together in making process improvement by attacking both
complex and simple problems. Six Sigma is useful in attacking complex problems that
might require sophisticated statistical tools, a full-time black-belt trained project leader,
13. If an organization were using neither lean or Six Sigma, the decision of which approach
to use first may depend on the type of problems the organization has. If the problems are
Chapter 09 – Quality Control and Improvement
9-6
Answers to Problems
1. a. The sample size used to determine the historical proportion defect rate over 100 days
was 1000. The number 100 is irrelevant for calculations; 100 days were simply used to
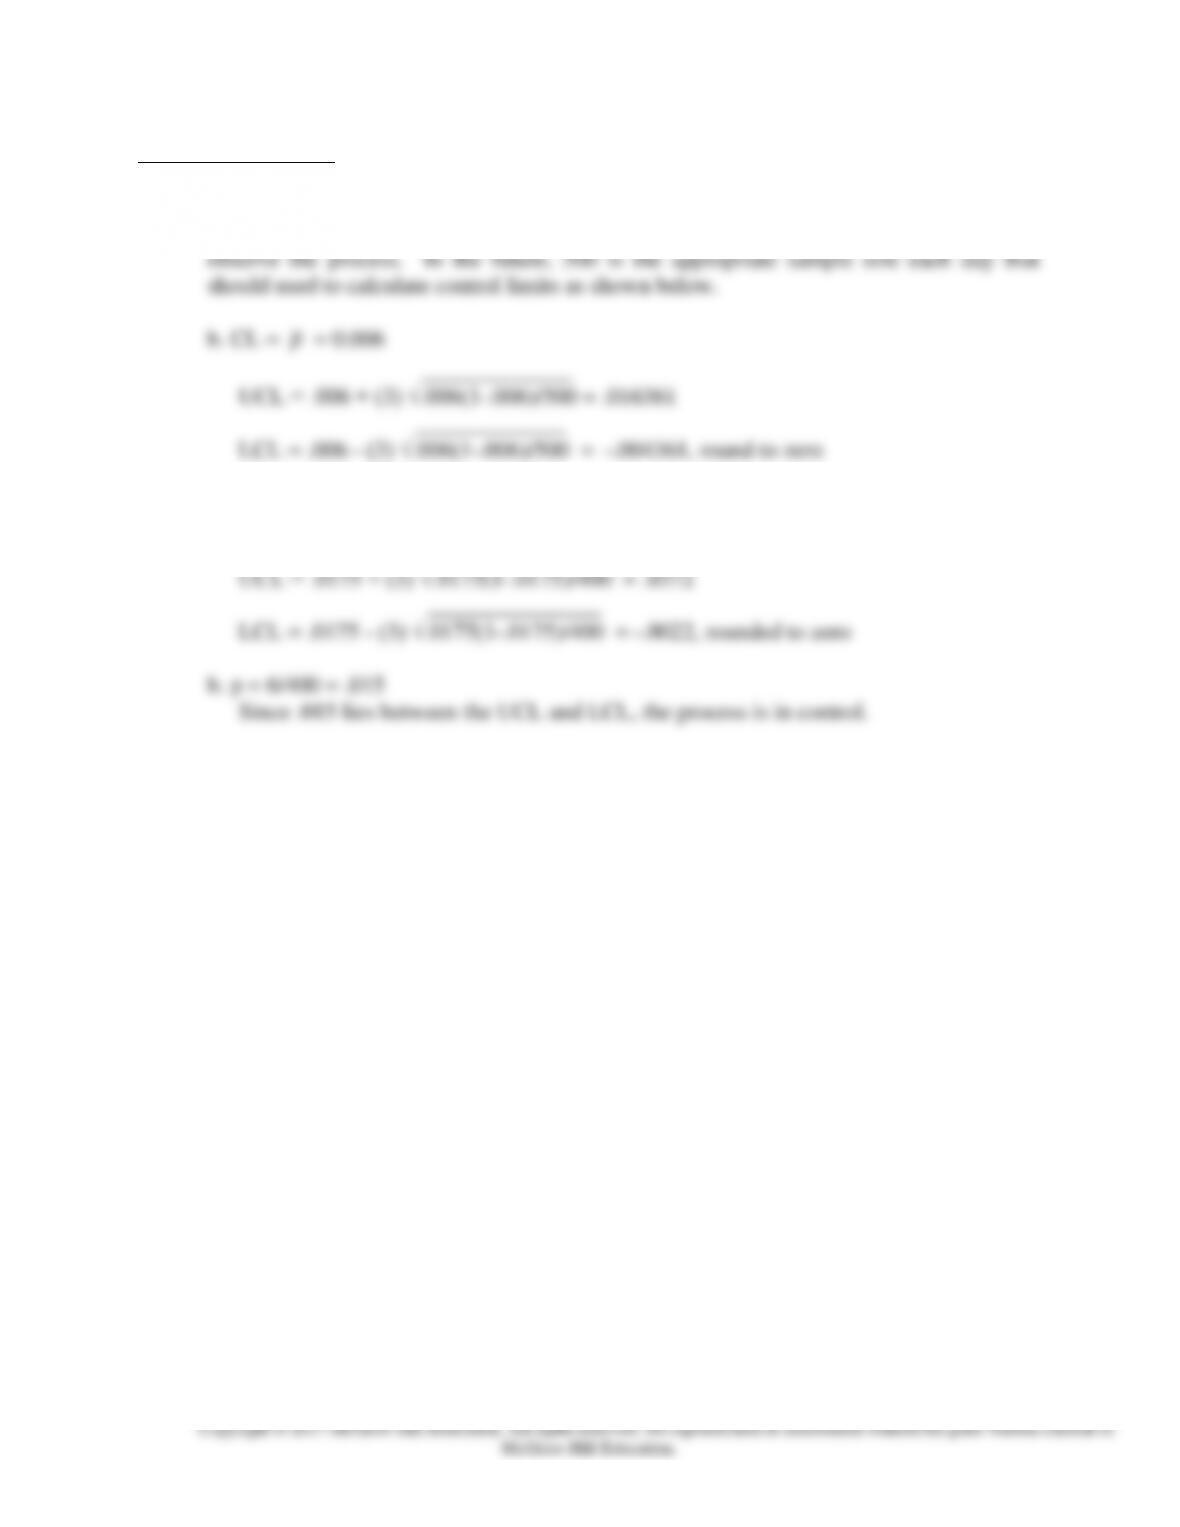
2. a. CL = [.01 + .02 + .02 + .01 + .03 + .02 + .01 + .04 + .03 + .02]/12 = .0175
_______________
Chapter 09 – Quality Control and Improvement
3a.
NAME:
Answer
key
CHAPTER 9,
PROBLEM 3
SECTION:
********
26-Apr-10
Enter sample size for each sample
500
Enter the number of samples taken
20
Enter the proportion of records found in error each day
in cells B33 through B42 and C33 through C42.
_
0.0025
0.0150
Center Line
P
0.0111
0.0075
0.0050
Upper Control
Limit
UCL
0.0252
0.0050
0.0150
Lower Control
Limit
LCL
0.0000
0.0150
0.0125
0.0125
0.0075
0.0100
0.0150
0.0050
0.0250
TO VIEW THE OTHER AREAS OF THIS WORKSHEET,
0.0025
0.0125
PRESS THE “PAGE DOWN” AND “PAGE UP” KEYS OR
0.0175
0.0075
USE THE VERTICAL SCROLL BAR.
0.0200
0.0100
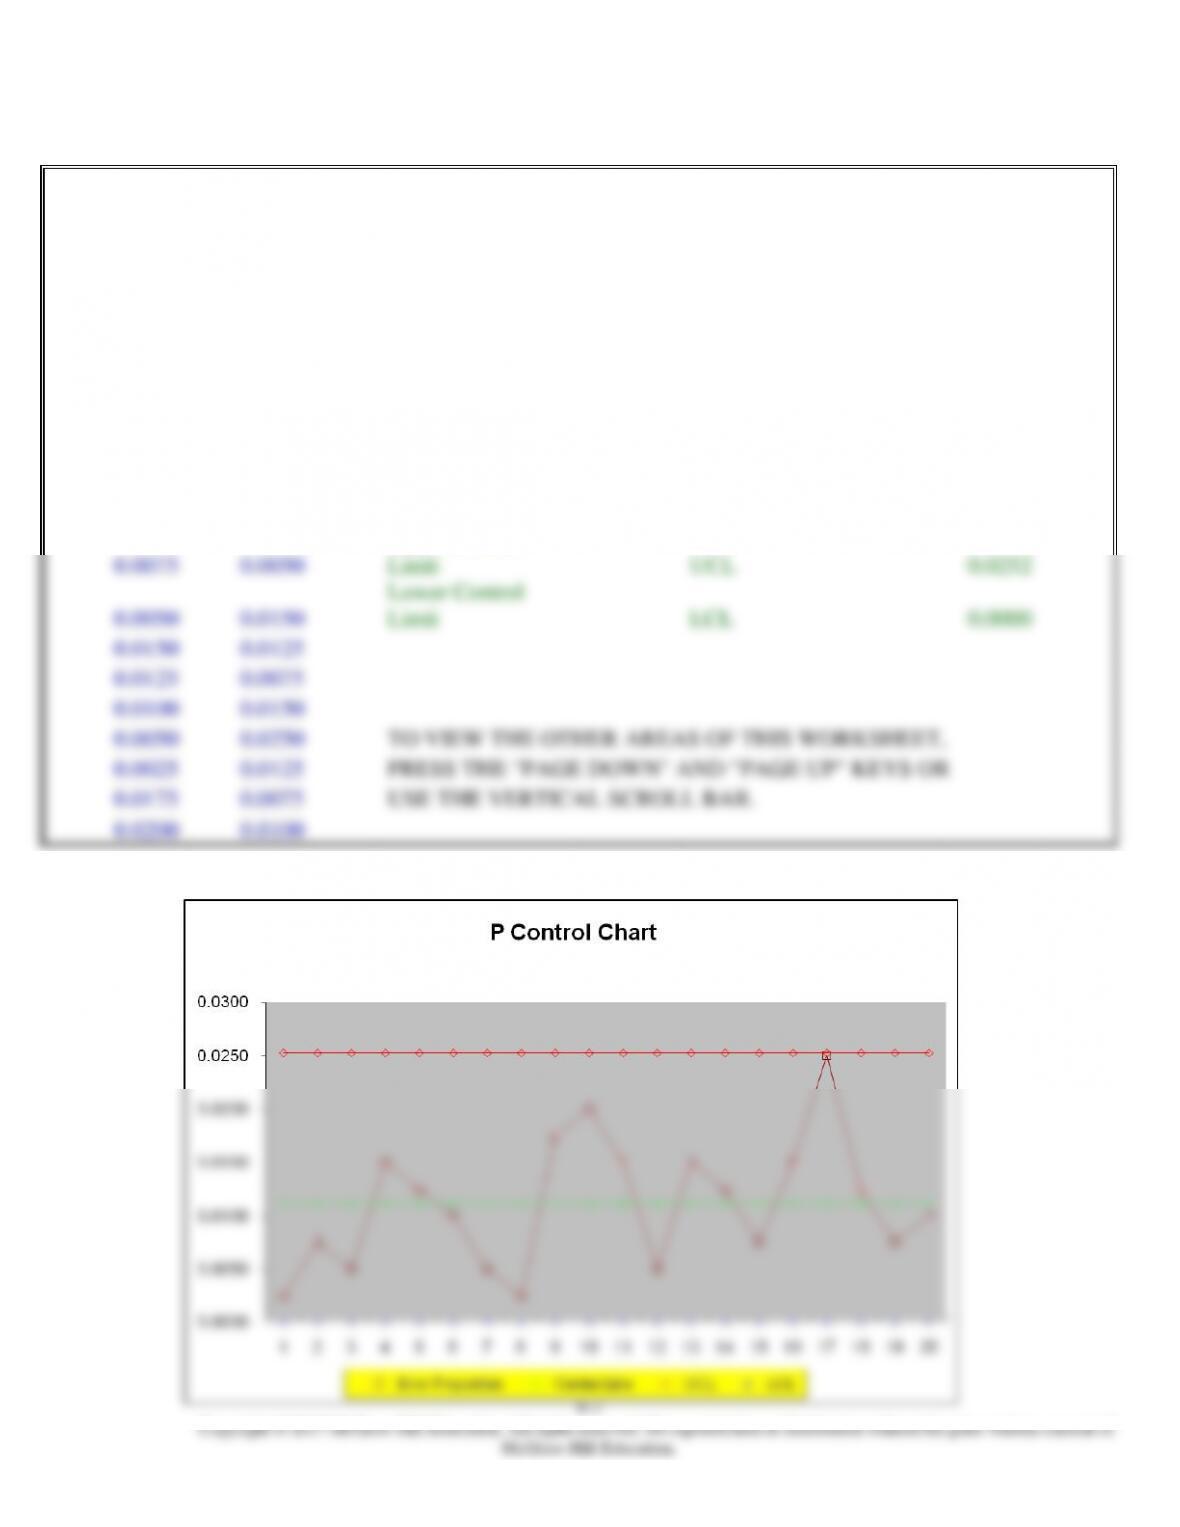
3b.
Chapter 09 – Quality Control and Improvement
9-8
All points are in control (the UCL is .0252 and the nearest point is .0250)
3c. Since all 20 points are in control, the process is stable enough for quality control purposes.
4. a. CL =
p
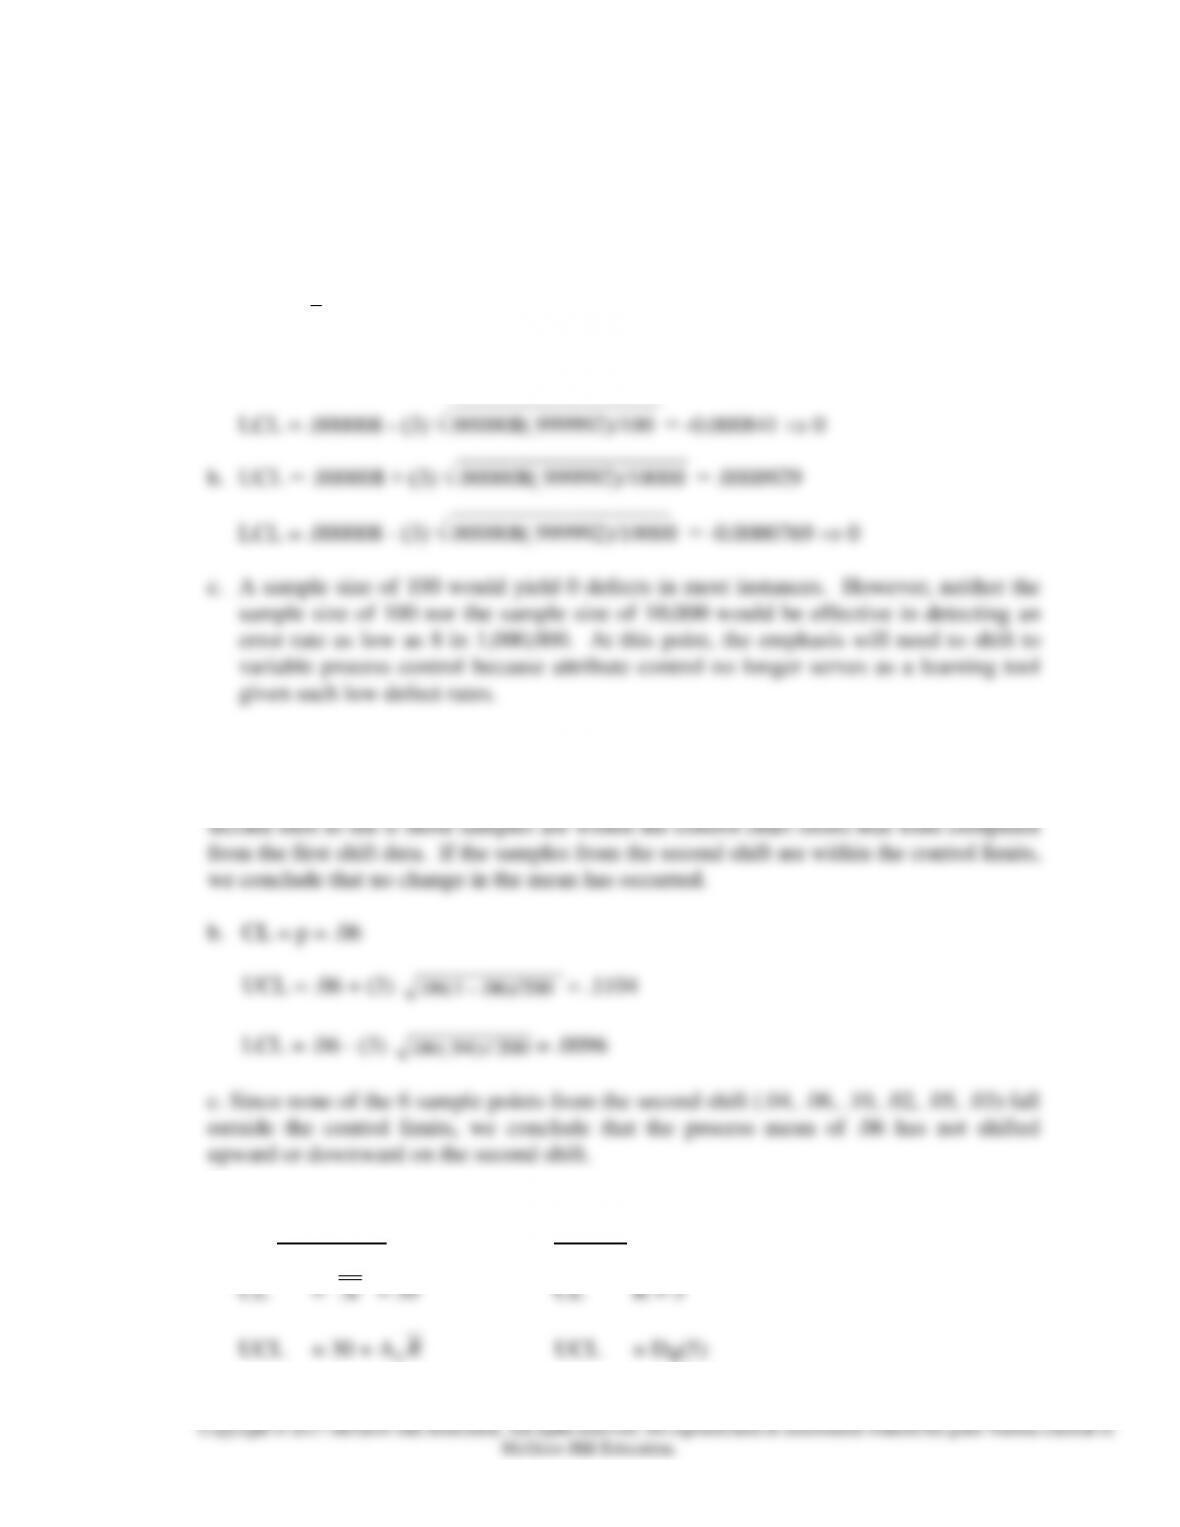
= 8/1,000,000 = .000008
__________________
UCL = .000008 + (3) √.000008(.999992)/100 = .000857
__________________
5. a. We could construct a control chart for the first shift by calculating the process
centerline and the upper and lower control limits. Then samples could be taken from the
6. a. X-Bar chart R Chart
_
Chapter 09 – Quality Control and Improvement
9-9
Copyright © 2017 McGraw-Hill Education. All rights reserved. No reproduction or distribution without the prior written consent of
McGraw-Hill Education.
= 30 + .483(5) = 2.004(5)
= 32.415 = 10.02
LCL = 30 – .483(5) LCL = D3(5)
= 27.585 = 0(5) = 0
b. The sample average is (38+35+27+30+33+32)/6 = 32.5 and the sample range is (38–
27) = 11.
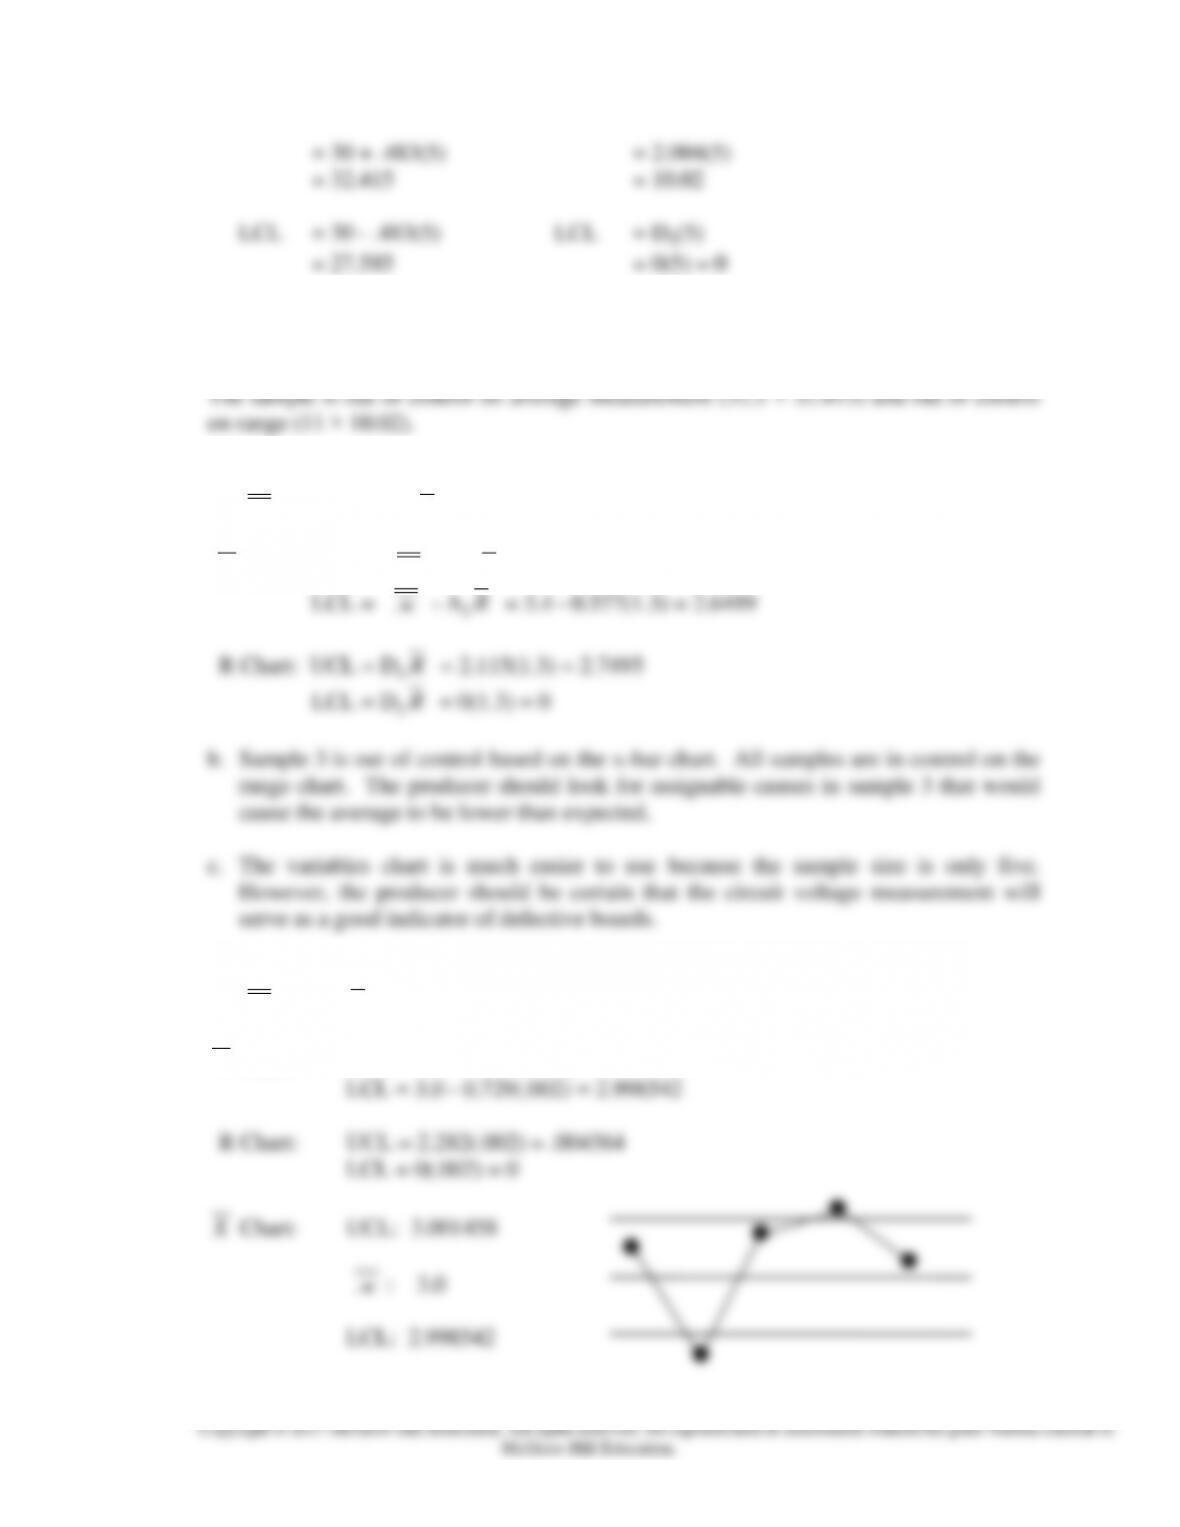
7. a.
x
= 3.4
R
= 1.3
X
Chart: UCL =
x
+ A2
R
= 3.4 + 0.577(1.3) = 4.1501
x
R
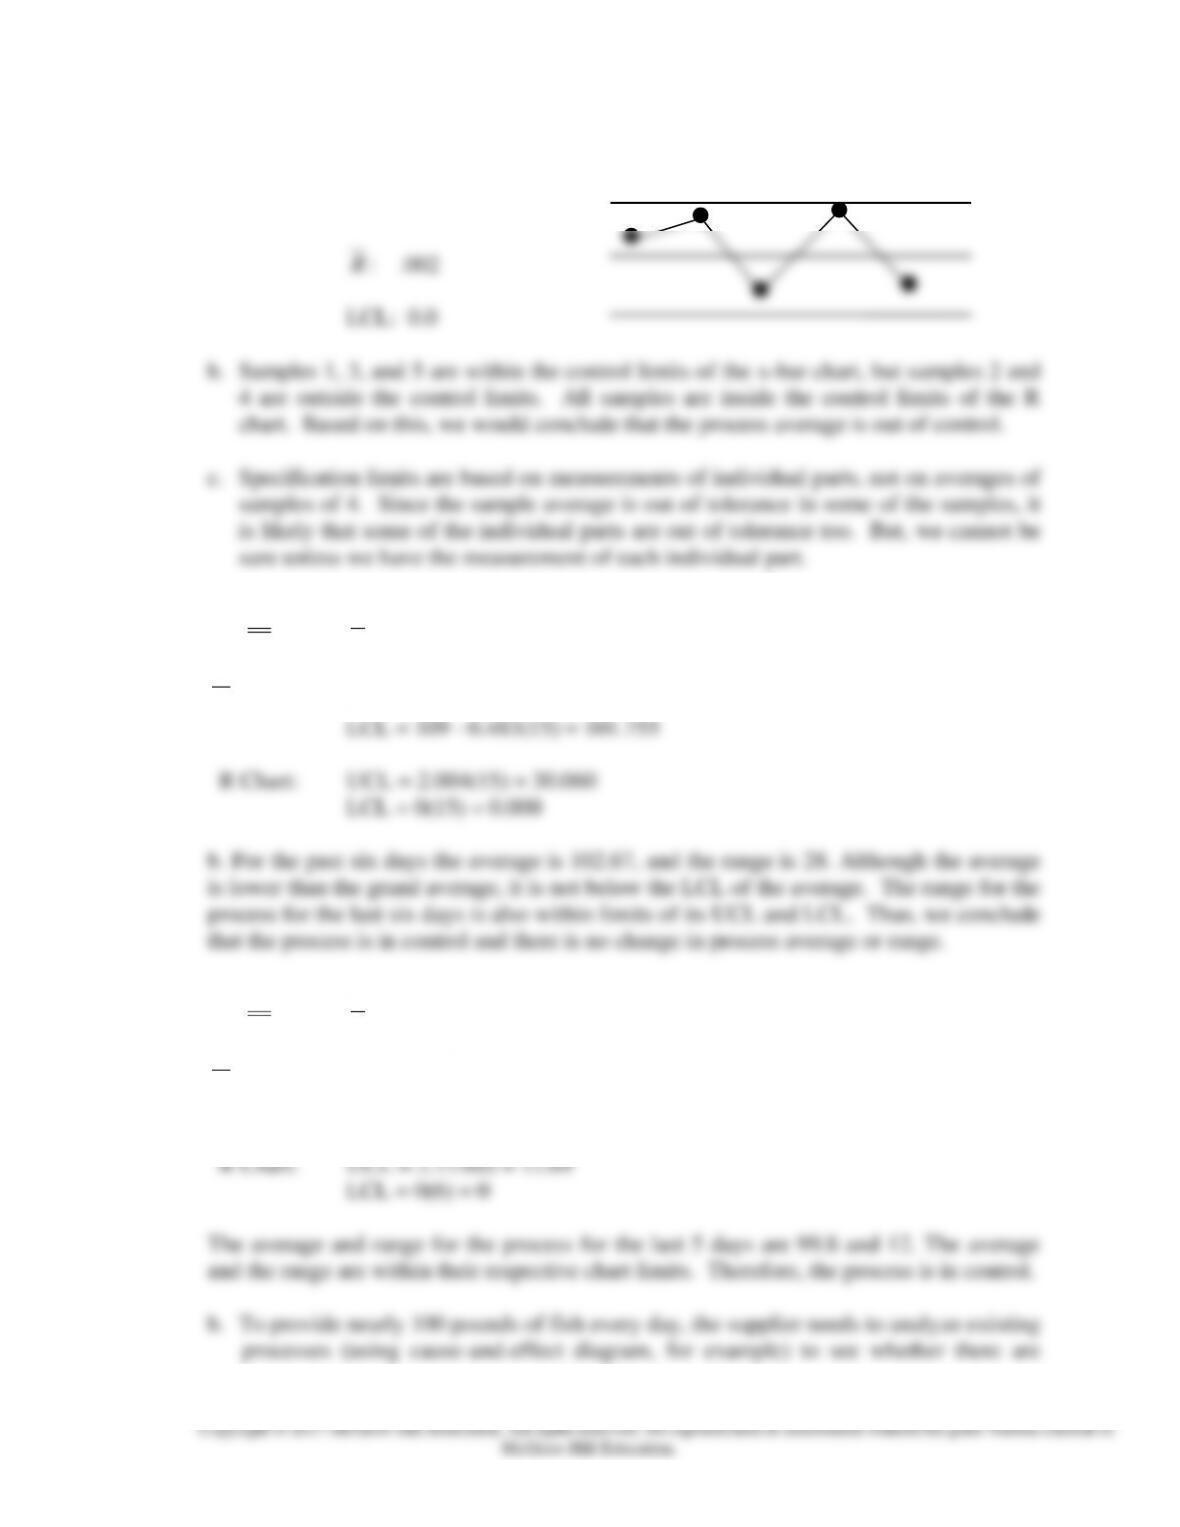
8. a.
x
= 3.0
R
= .002
X
Chart: UCL = 3.0 + 0.729(.002) = 3.001458
X
Chapter 09 – Quality Control and Improvement
9-10
R Chart: UCL: .004564
9. a.
x
= 109
R
= 15
X
Chart: UCL = 109 + 0.483(15) = 116.245
10. a.
x
= 100,
R
= 6
X
Chart: UCL = 100 + 0.577(6) = 103.462
LCL = 100 – 0.577(6) = 96.538
Chapter 09 – Quality Control and Improvement
9-11
Copyright © 2017 McGraw-Hill Education. All rights reserved. No reproduction or distribution without the prior written consent of
McGraw-Hill Education.
opportunities for improvement (e.g. scale calibration). After implementing some
process changes to narrow the control limits, the outcomes for the average and range
should be observed again and to check if they are within control limits.
Chapter 09 – Quality Control and Improvement
9-12
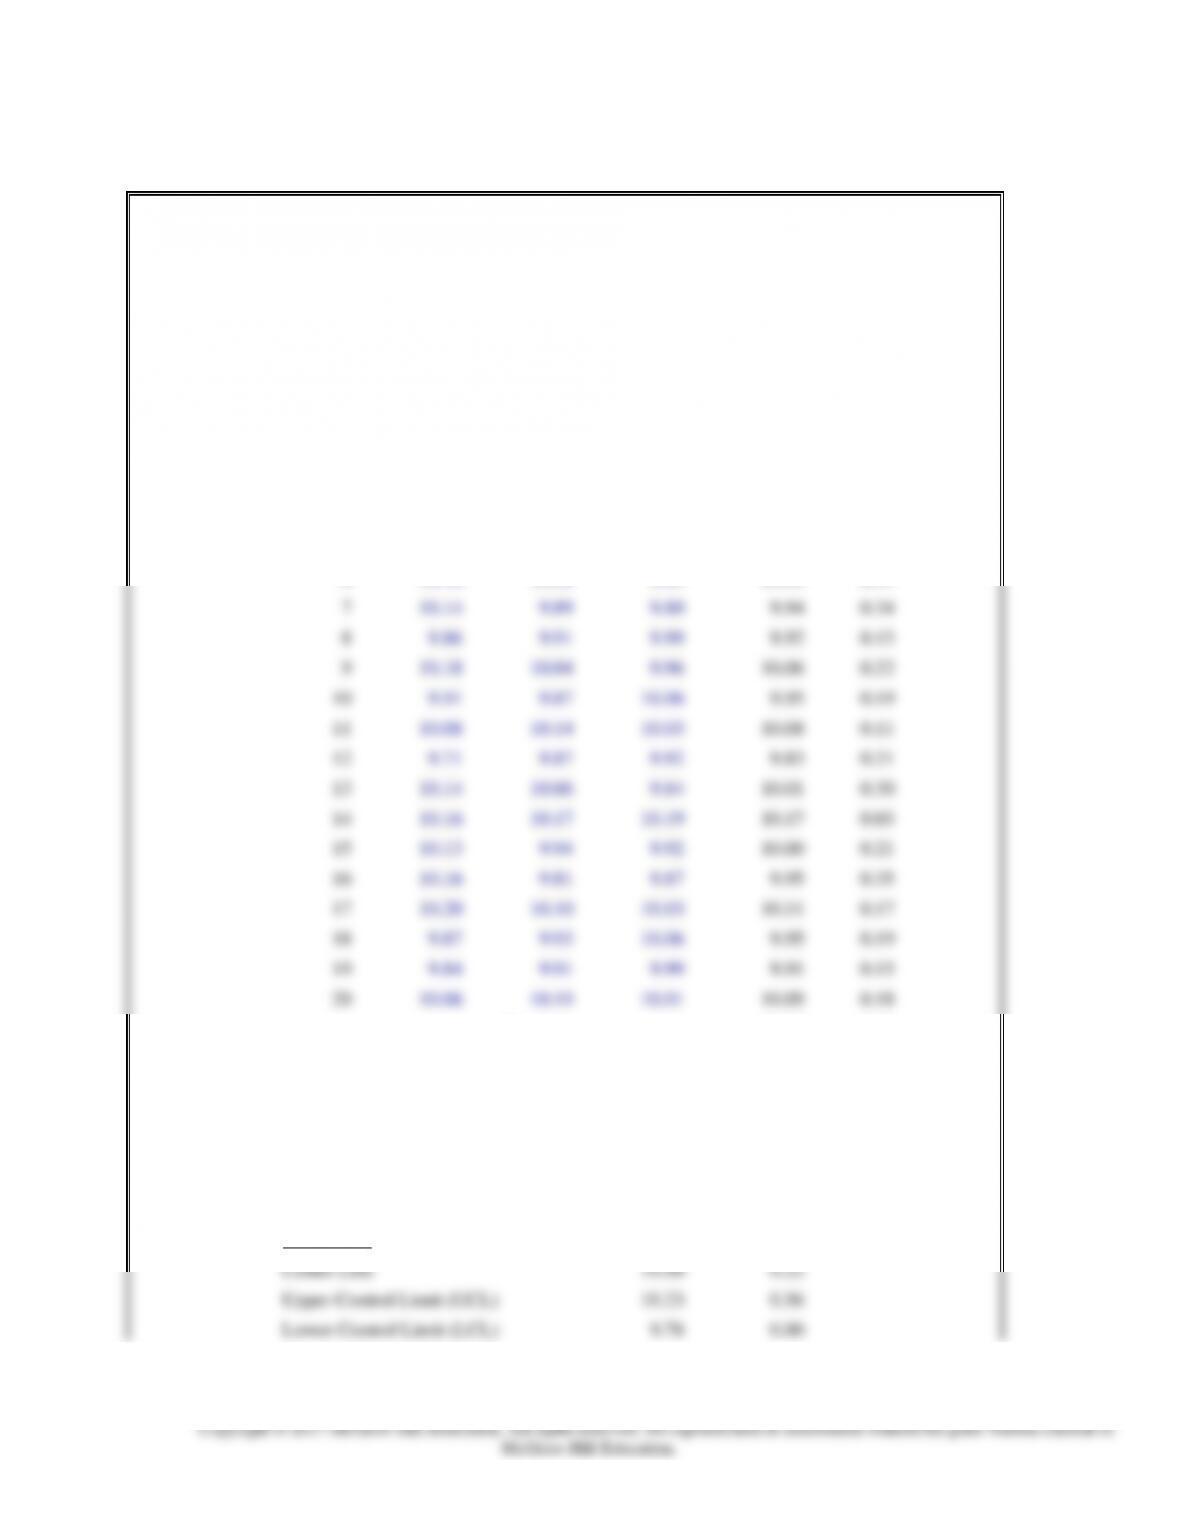
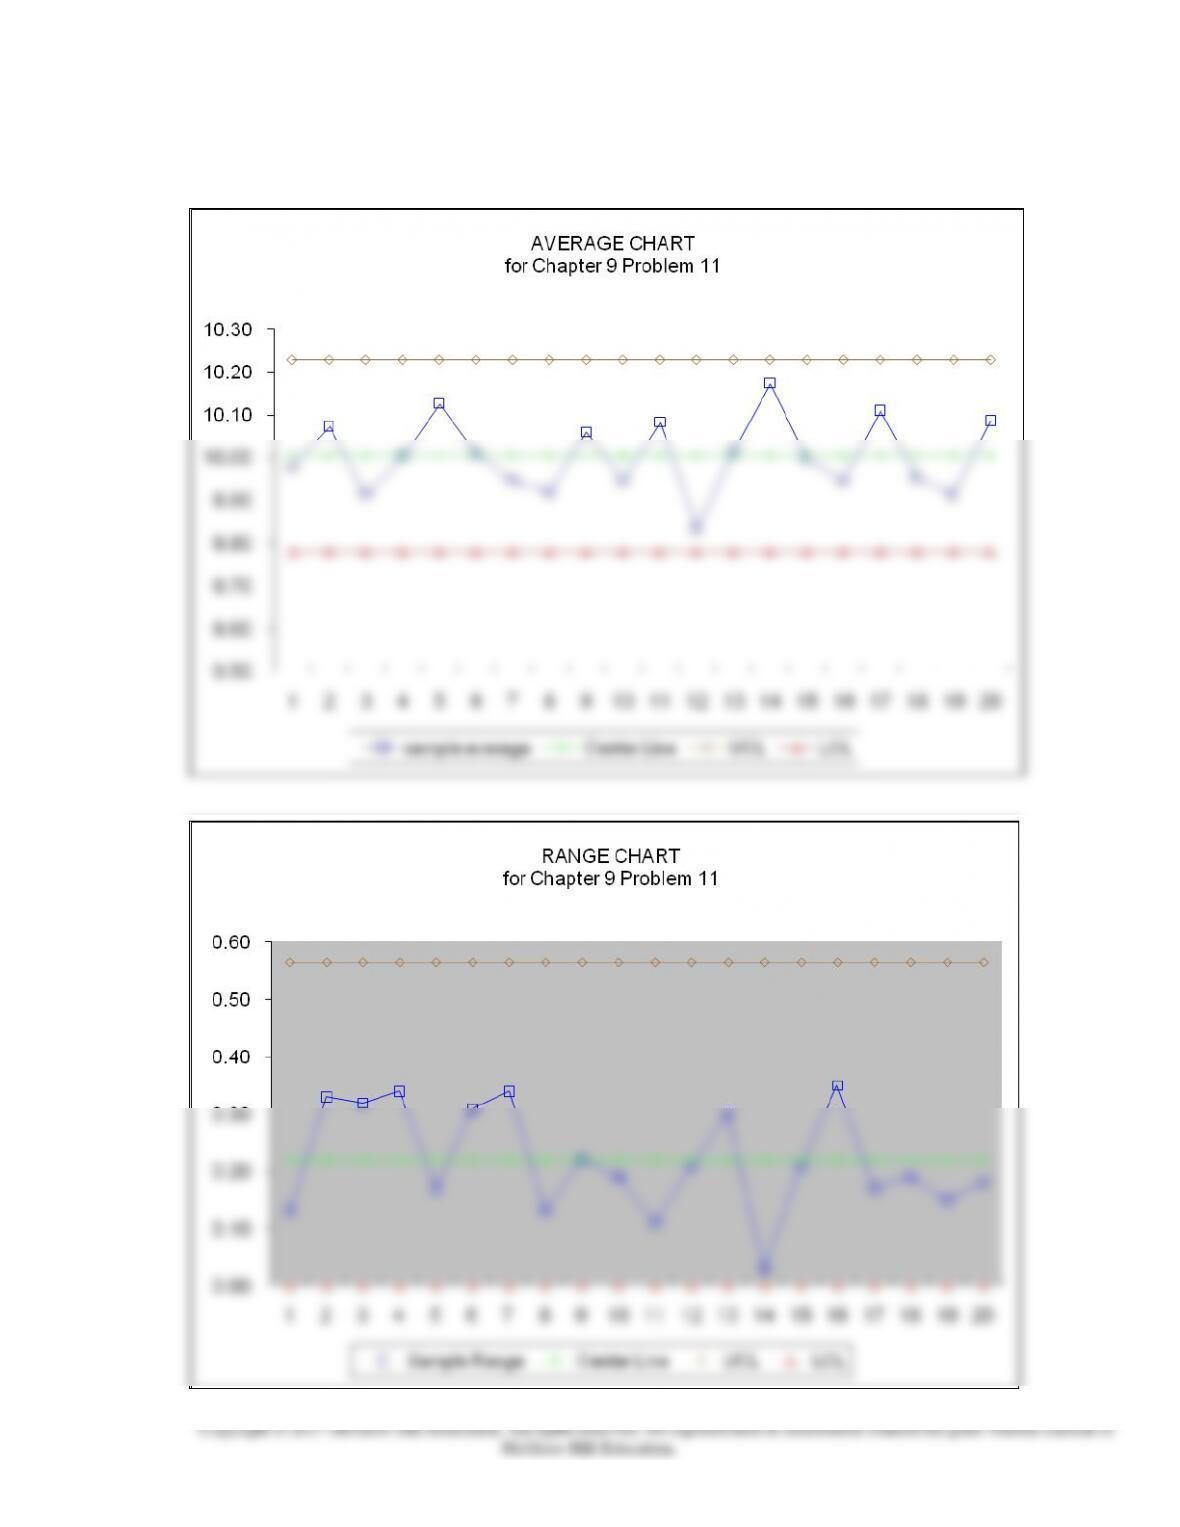
11.a.
NAME:
Answer
CHAPTER 9, PROBLEM 11
SECTION:
********
26-Apr-10
Observation
Sample
Sample
Sample
1
2
3
Average
Range
=
=
=
=
=
=
1
10.01
9.90
10.03
9.98
0.13
2
9.87
10.20
10.15
10.07
0.33
3
10.08
9.89
9.76
9.91
0.32
4
10.17
10.01
9.83
10.00
0.34
5
10.21
10.13
10.04
10.13
0.17
6
10.16
10.02
9.85
10.01
0.31
7
10.14
9.89
9.80
9.94
0.34
8
9.86
9.91
9.99
9.92
0.13
9
10.18
10.04
9.96
10.06
0.22
10
9.91
9.87
10.06
9.95
0.19
11
10.08
10.14
10.03
10.08
0.11
12
9.71
9.87
9.92
9.83
0.21
13
10.14
10.06
9.84
10.01
0.30
14
10.16
10.17
10.19
10.17
0.03
15
10.13
9.94
9.92
10.00
0.21
16
10.16
9.81
9.87
9.95
0.35
17
10.20
10.10
10.03
10.11
0.17
18
9.87
9.93
10.06
9.95
0.19
19
9.84
9.91
9.99
9.91
0.15
20
10.06
10.19
10.01
10.09
0.18
Grand Averages
10.00
0.22
Enter Values of
A2
1.023
For n = 3
D3
0.000
D4
2.575
RESULTS:
Average
Range
Center Line
10.00
0.22
Upper Control Limit (UCL)
10.23
0.56
Lower Control Limit (LCL)
9.78
0.00
Chapter 09 – Quality Control and Improvement
9-13
11b. None of the samples are out of control since all points are within the control limits.
Chapter 09 – Quality Control and Improvement
9-14
12. a. cp = (220 – 160) / ( 6 * 6) = 60/36
b. To improve cpk to 1.0, you could change the mean, the specifications, or the standard
13. a. cp = (150 – 100) / ( 6 * 8) = 50/48
= 1.0417
c. The percentage of product that is expected to fall outside the specification limits is the
sum of the percentage of observations that are expected to be more extreme than the
USL and LSL. Since the specification limits are not equi-distant from the process
mean, the expected percentages above the USL will not be equal to the expected
9-15
Copyright © 2017 McGraw-Hill Education. All rights reserved. No reproduction or distribution without the prior written consent of
McGraw-Hill Education.
practical purposes, 0%. The solution, then, is 0.62% + 0% = 0.62% of the product is
expected to fall outside the specification limits.
14. a. If cp = (1100 – 700) / (6*SD), then a little algebra yields SD = 400/ (6*1.5)= 44.44.
c. Several possibilities may exist for the company:
1) The producer could attempt to negotiate wider specification limits. This may
not be acceptable to the customer in the short or long term.
2) The producer could attempt to modify the product or production process so that