Chapter 11 – Capacity Planning
11-1
Chapter 11
Capacity Planning
Teaching Notes
This chapter addresses several decisions related to long- and medium-range capacity.
The first part of this chapter describes facilities decisions involving the amount of capacity
required, its size, when it is needed, and where it should be located, along with what type of
capacity. The chapter attempts to show how these decisions, that are often interrelated, can be
made using a strategic approach.
The second part of the chapter defines the aggregate planning problem and develops
several methods for analyzing it. The costing of alternative strategies is stressed as a basic
approach that can always be used. S&OP is a form of aggregate planning as explained in the
chapter. However, S&OP is an organizational process and aggregate planning is analytical.
When teaching this chapter, we usually review the definition of aggregate planning and
the various demand and supply influencing variables. We then put a simple example on the
board to describe the important issues in aggregate planning and illustrate the costing of level
and chase strategies. Discussion of S&OP is useful as a current topic in industry.
Answers to Questions
1. a. Maximum of one year because the size and complexity of a restaurant is limited.
The facility can also be leased.
b. About two years because the design and equipment required is complex.
Chapter 11 – Capacity Planning
2. Mixing these questions makes facility planning far more complicated. The alternatives
3. The school also has the option of spreading the students among the schools through
busing or operating the schools at lower levels. In some states it may be possible to sell
4. A facility decision affects all aspects of an organization; therefore top management needs
to make the decisions because they have an overall view of the organization. Each of the
5. Corporate strategy may set constraints under which alternatives are considered. It also
6. S&OP or aggregate planning deals with acquiring resources while scheduling is
concerned with allocating available resources. While aggregate planning is a medium-
7. Yes. The company has many options to increase profits or decrease costs with a seasonal
product. They can keep their company policy of a level workforce if they want and still
8. An aggregate plan is necessary to make personnel decisions and plans because it
determines the number of personnel needed and what policy is followed; level workforce,
9. Treating the different objectives simultaneously reduces the chance of suboptimization
because the tradeoffs are recognized and evaluated. Treating objectives as costs requires
11-3
10. Important variables in choosing the length of the planning horizon include the length of
seasonal cycle, the length of the budgeting period and the level of demand uncertainty. A
11. There are numerous options that can be utilized individually and together. They include
reducing prices during non-peak periods, advertising these discounts, using a reservation
Chapter 11 – Capacity Planning
11-4
Answers to Problems
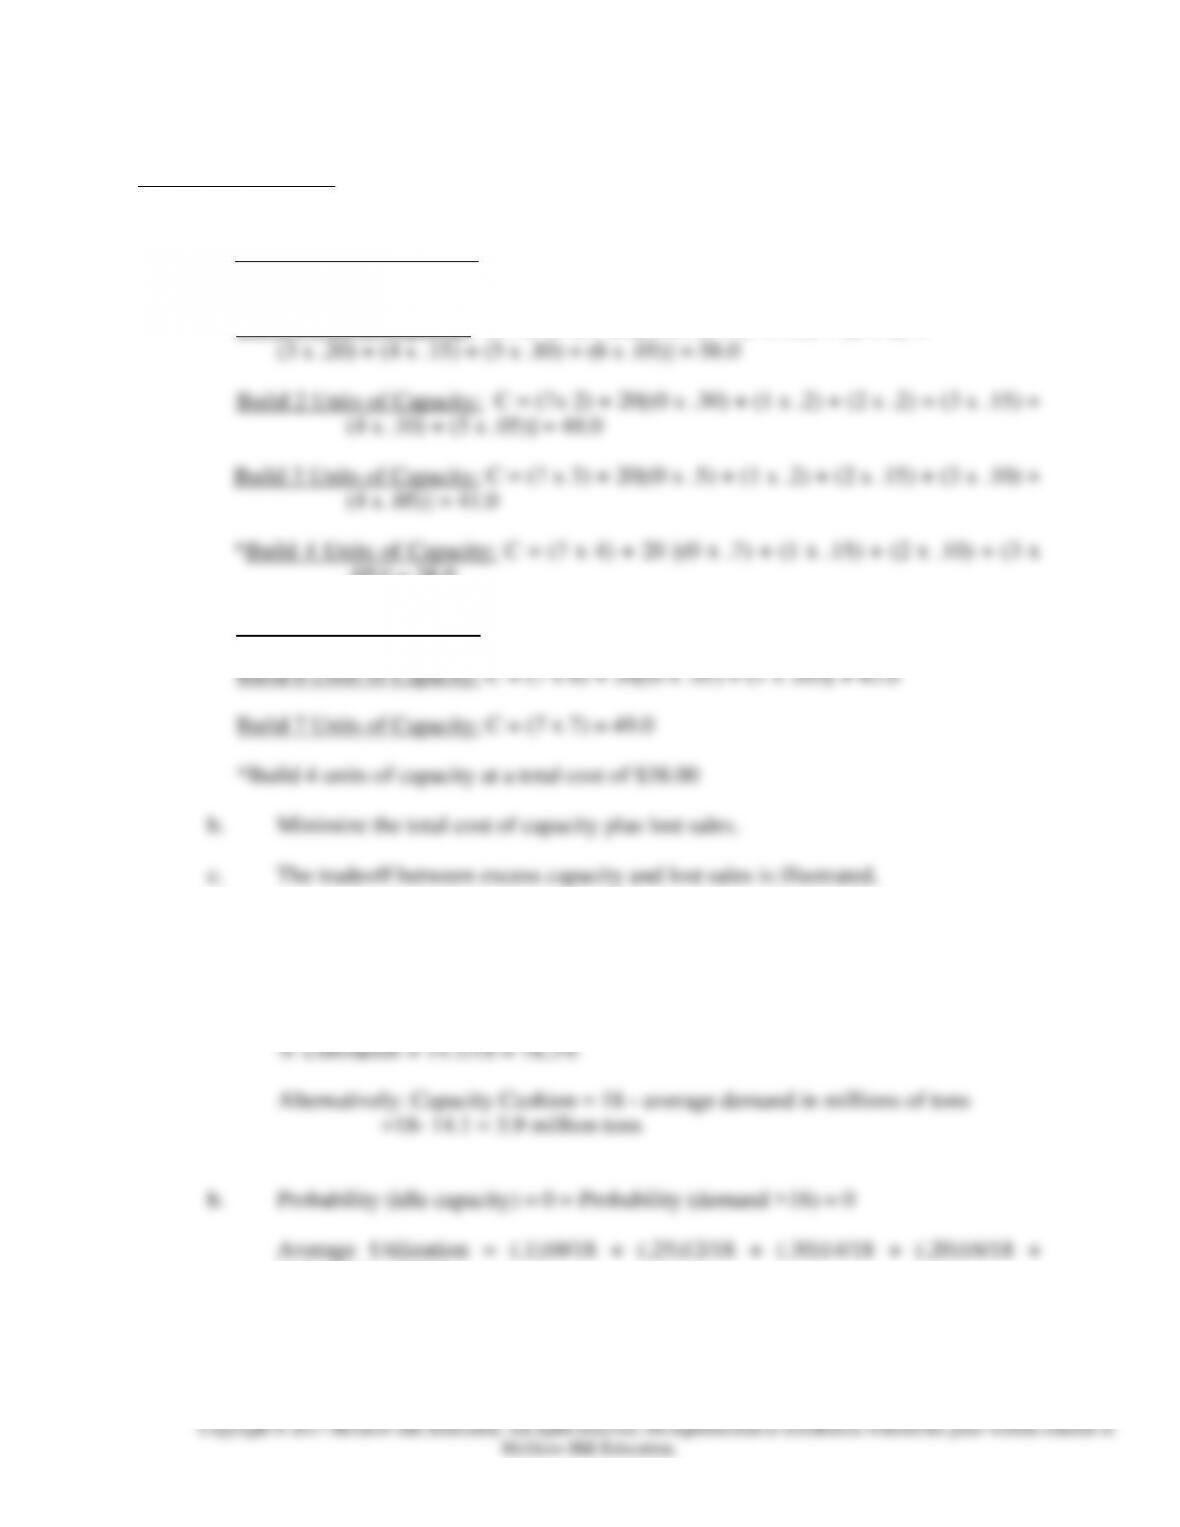
1. a. Build 0 Units of Capacity: C = (7 x 0) + 20[(0 x .05) + (1 x .10) + (2 x .15) +
(3 x .20) + (4 x .20) + (5 x .15) + (6 x .10) + (7 x .05)] = 70.0
Build 1 Unit of Capacity: C = (7 x 1) + 20[(0 x.15) + (1 x .15) + (2 x .2) +
.05)] = 38.0
Build 5 Units of Capacity: C = (7 x 5) + 20[(0 x .85) + (1 x .10) + (2 x .05)] = 39.0
2. a. Capacity Cushion = 100% – % utilization = 100 – 78.3 = 21.7%
Average tonnage = (.10*10+.25*12+.30*14+.20*16+.15*18) =14.1
(.15)18/18 = 0.783
Chapter 11 – Capacity Planning
11-5
= 978.4 million
Build 14 Units of Capacity:
C = (80 x 14) + 8[(0 x .65) + (2 x .20) + (4 x .15)]
= 1128.0 million
Build 16 Units of Capacity:
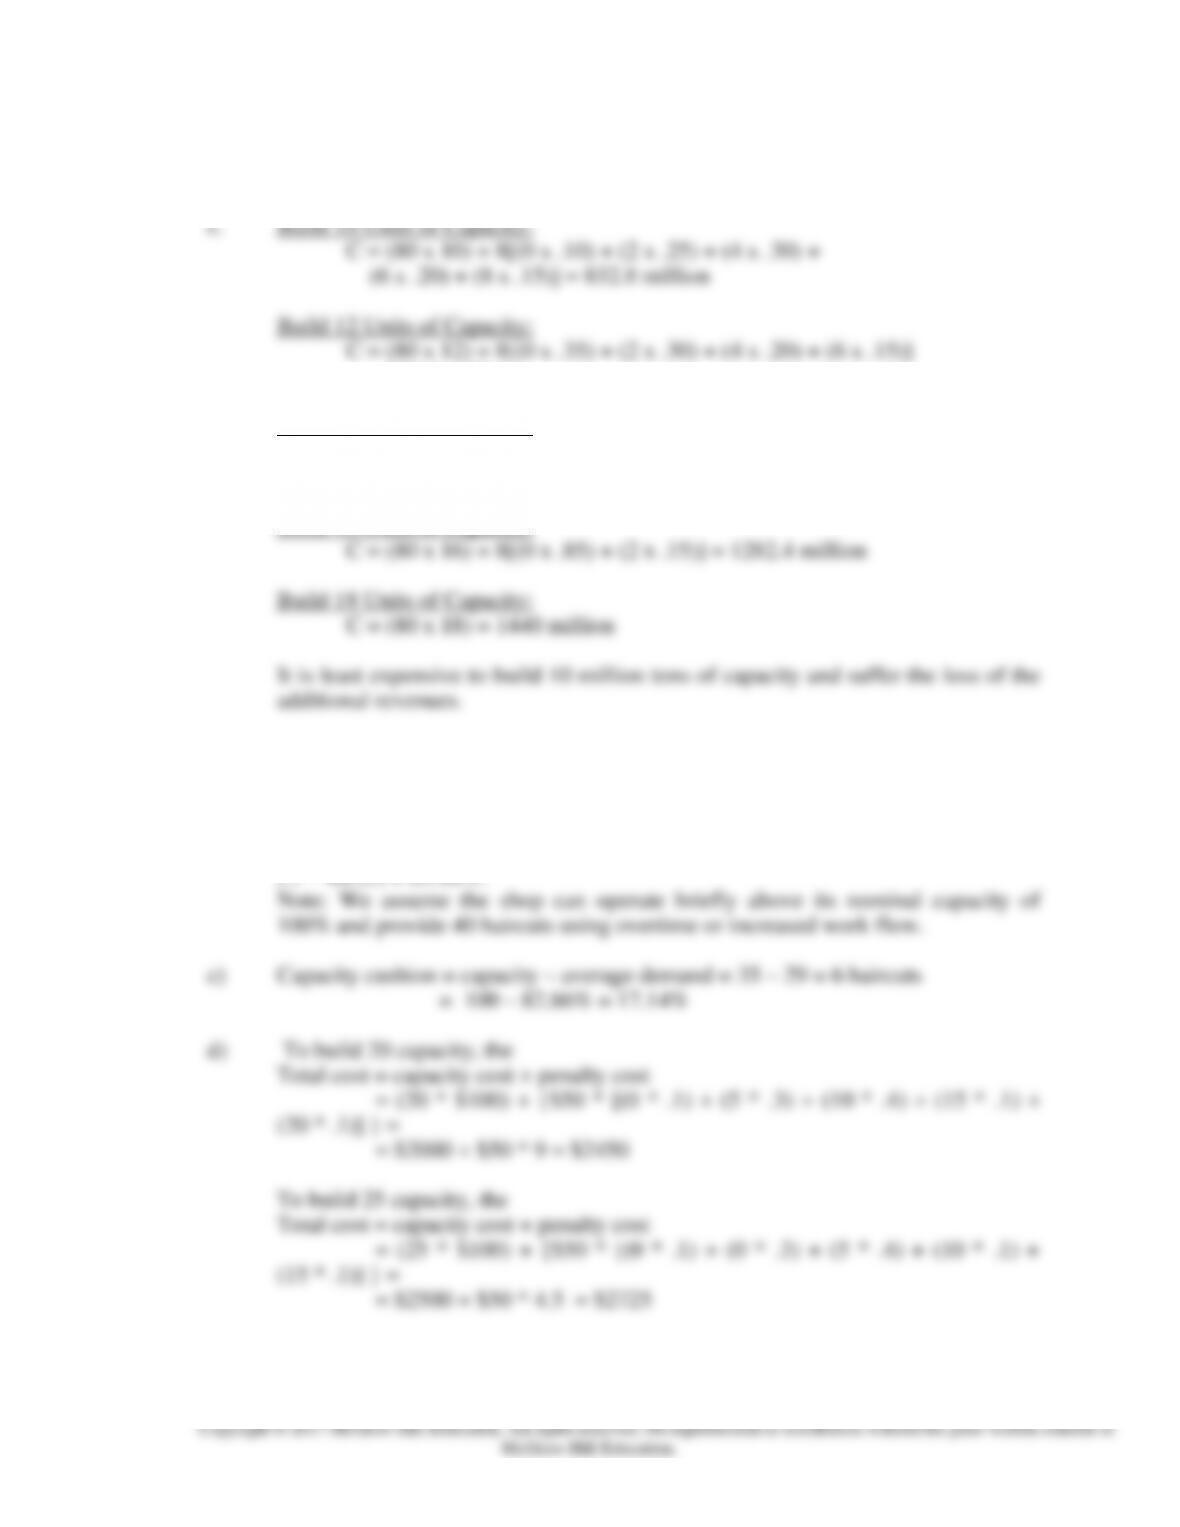
3. a) 20 * .1 + 25 * .3 + 30 * .4 + 35 * .1 + 40 * .1 = 29 haircuts
b) Average Utilization = (.1 * 20/35) + (.3 * 25/35) + (.4 * 30/35) + (.1 * 35/35) +
(.1 * 40/35) = 82.86%.
Chapter 11 – Capacity Planning
To build 30 capacity, the
Total cost = capacity cost + penalty cost
4. a) Weekly capacity in hours = 12 hours * 7 days = 84 hours/week
Annual capacity in hours = 84 hours * 52 weeks = 4368 hours per year
11-7
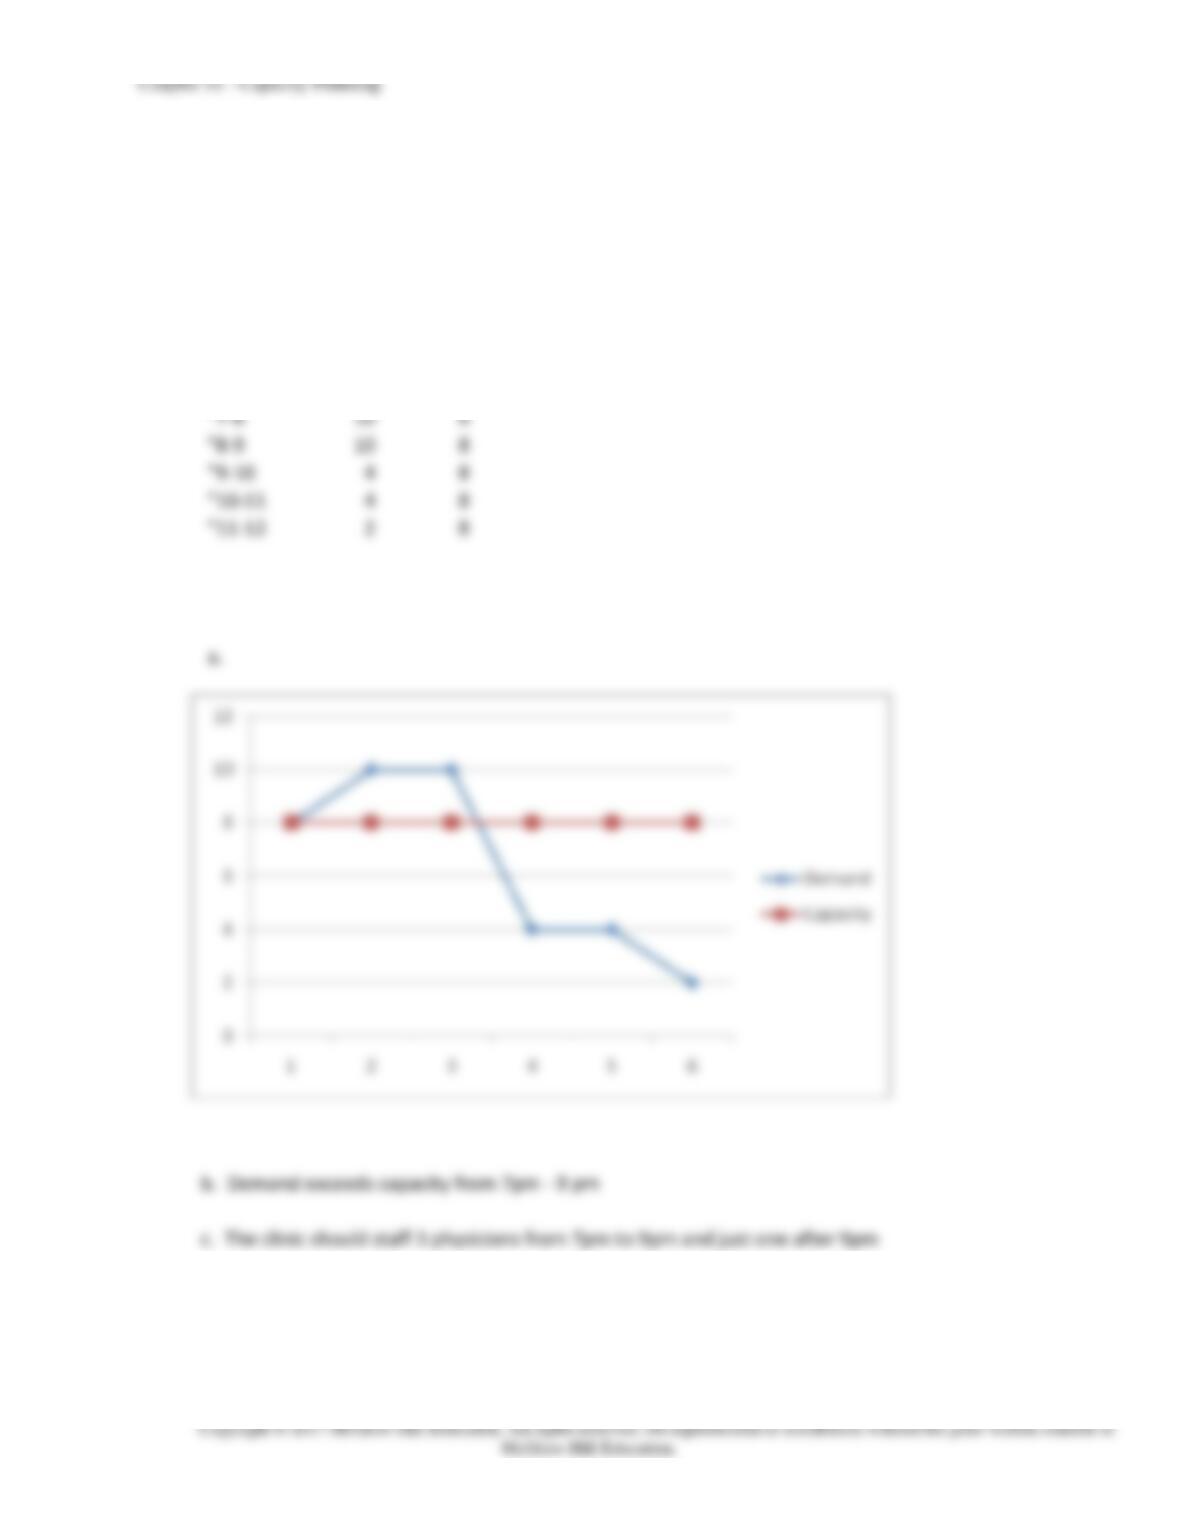
5. Urgent Care
Time
Demand
Capacity
“6-7
8
8
“7-8
10
8
“8-9
10
8
“9–10
4
8
“10-11
4
8
“11-12
2
8
b. Demand exceeds capacity from 7pm – 9 pm
c. The clinic should staff 3 physicians from 7pm to 9pm and just one after 9pm
Chapter 11 – Capacity Planning
11-8
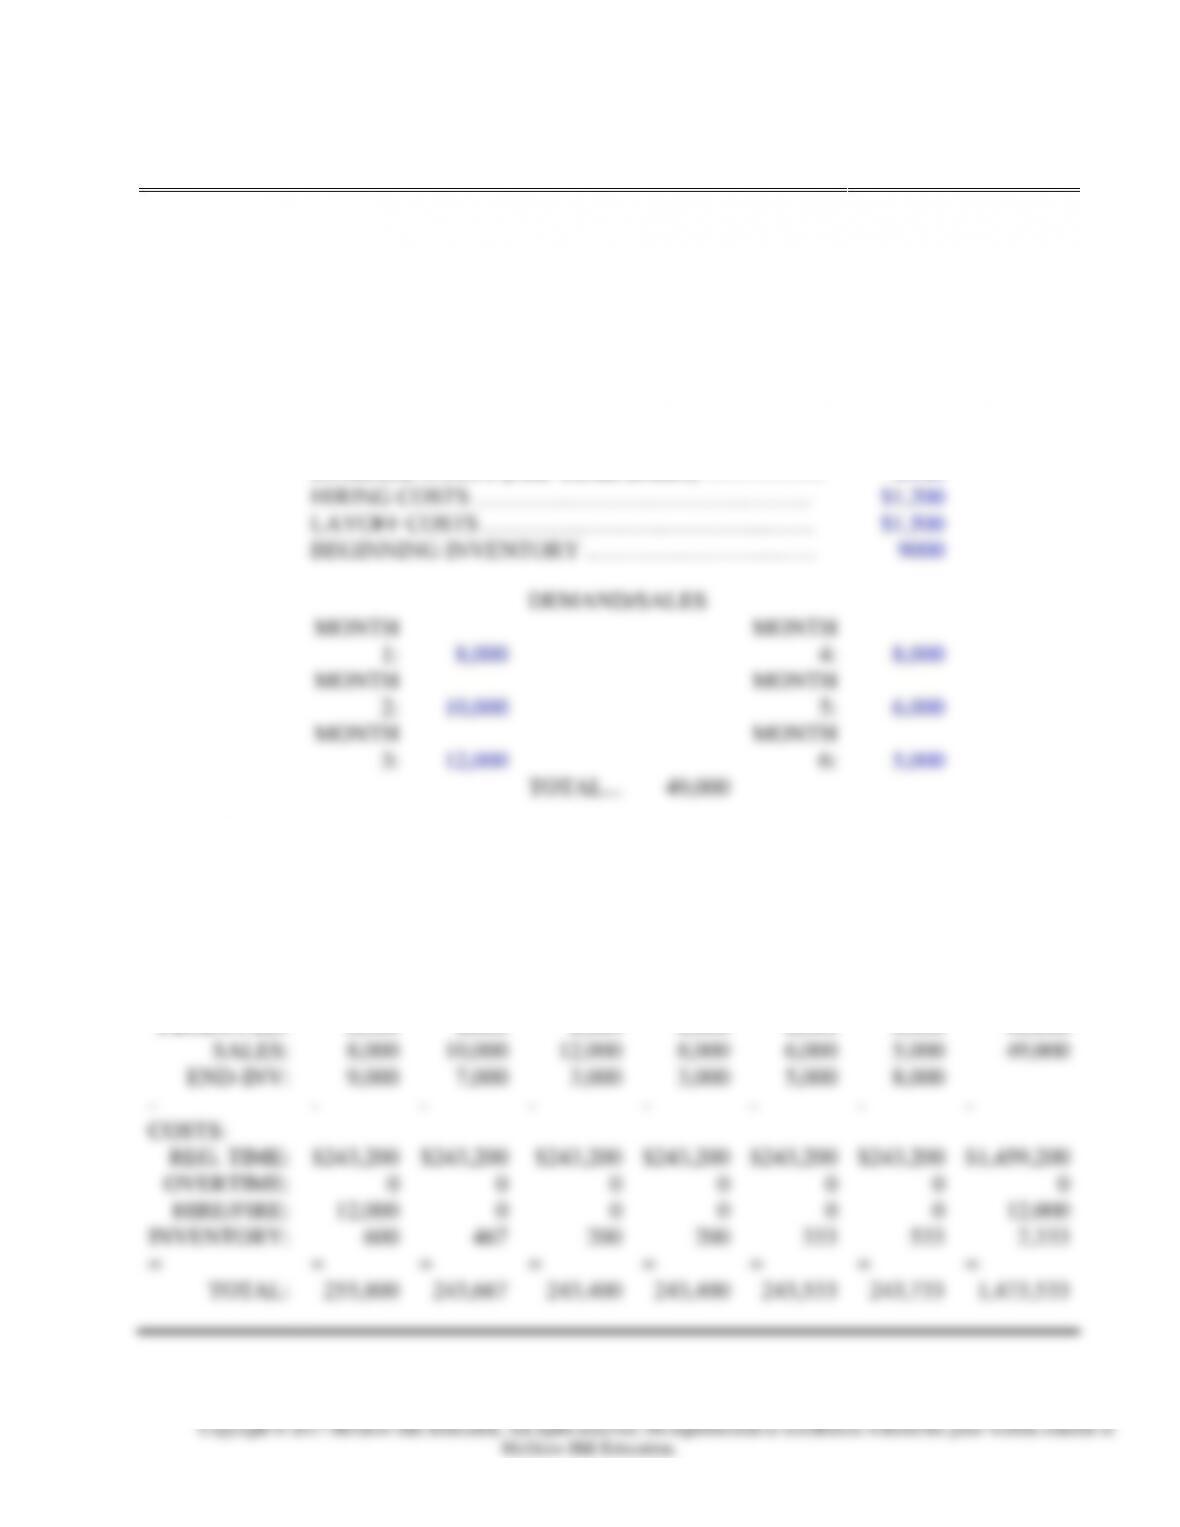
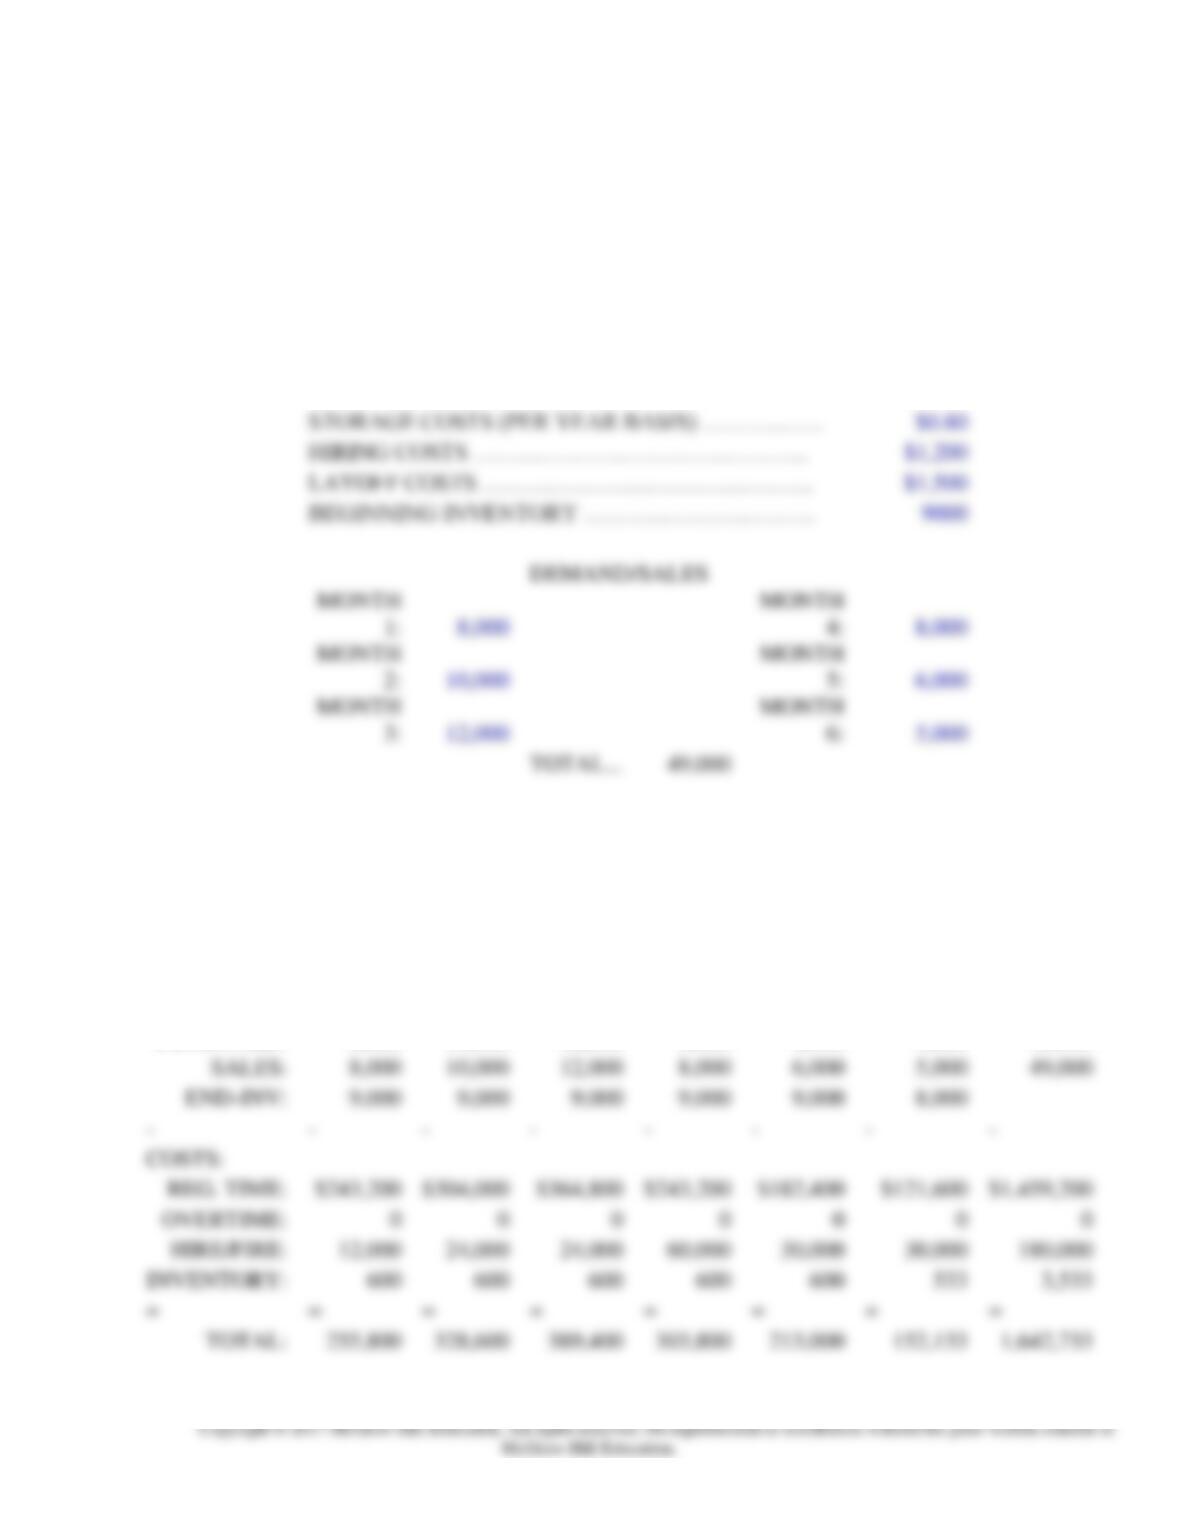
6. a. The costs of a level production strategy are $1,473,533
NAME:
*****************
CHAPTER 11 PROBLEM 6
SECT:
*************
DATE:
16-Feb-
16
INPUT SECTION:
PRESENT LABOR FORCE (160 hrs/month)…………
70
POUNDS PRODUCED (PER
WORKER/MONTH)….…
100
REGULAR WAGE RATE …………………………….
$19.00
STORAGE COSTS (PER YEAR BASIS) …………….
$0.80
HIRING COSTS ……………………………………..
$1,200
LAYOFF COSTS …………………………………….
$1,500
BEGINNING INVENTORY …………………………
9000
DEMAND/SALES
MONTH
1:
8,000
MONTH
4:
8,000
MONTH
2:
10,000
MONTH
5:
6,000
MONTH
3:
12,000
MONTH
6:
5,000
TOTAL…
49,000
STRATEGY:
Level workforce
MONTH
1
2
3
4
5
6
TOTAL
–
–
–
–
–
–
–
–
RESOURCES:
REG. WORK:
80
80
80
80
80
80
O.T. %:
0%
0%
0%
0%
0%
0%
PRODUCED:
8,000
8,000
8,000
8,000
8,000
8,000
48,000
SALES:
8,000
10,000
12,000
8,000
6,000
5,000
49,000
END-INV:
9,000
7,000
3,000
3,000
5,000
8,000
–
–
–
–
–
–
–
–
COSTS:
REG. TIME:
$243,200
$243,200
$243,200
$243,200
$243,200
$243,200
$1,459,200
OVERTIME:
0
0
0
0
0
0
0
HIRE/FIRE:
12,000
0
0
0
0
0
12,000
INVENTORY:
600
467
200
200
333
533
2,333
=
=
=
=
=
=
=
=
TOTAL:
255,800
243,667
243,400
243,400
243,533
243,733
1,473,533
Chapter 11 – Capacity Planning
11-9
b. The costs of a chase production strategy are $1,642,733 as shown below.
NAME:
*****************
CHAPTER 11 PROBLEM 6
SECT:
*************
DATE:
16-Feb-16
INPUT SECTION:
PRESENT LABOR FORCE (160 hrs/month)…………
70
POUNDS PRODUCED (PER WORKER/MONTH)….…
100
REGULAR WAGE RATE …………………………….
$19.00
STORAGE COSTS (PER YEAR BASIS) …………….
$0.80
HIRING COSTS ……………………………………..
$1,200
LAYOFF COSTS …………………………………….
$1,500
BEGINNING INVENTORY …………………………
9000
DEMAND/SALES
MONTH
1:
8,000
MONTH
4:
8,000
MONTH
2:
10,000
MONTH
5:
6,000
MONTH
3:
12,000
MONTH
6:
5,000
TOTAL…
49,000
STRATEGY:
Chase
MONTH
1
2
3
4
5
6
TOTAL
–
–
–
–
–
–
–
–
RESOURCES:
REG. WORK:
80
100
120
80
60
40
O.T. %:
0%
0%
0%
0%
0%
0%
PRODUCED:
8,000
10,000
12,000
8,000
6,000
4,000
48,000
SALES:
8,000
10,000
12,000
8,000
6,000
5,000
49,000
END-INV:
9,000
9,000
9,000
9,000
9,000
8,000
–
–
–
–
–
–
–
–
COSTS:
REG. TIME:
$243,200
$304,000
$364,800
$243,200
$182,400
$121,600
$1,459,200
OVERTIME:
0
0
0
0
0
0
0
HIRE/FIRE:
12,000
24,000
24,000
60,000
30,000
30,000
180,000
INVENTORY:
600
600
600
600
600
533
3,533
=
=
=
=
=
=
=
=
TOTAL:
255,800
328,600
389,400
303,800
213,000
152,133
1,642,733
Chapter 11 – Capacity Planning
11-10
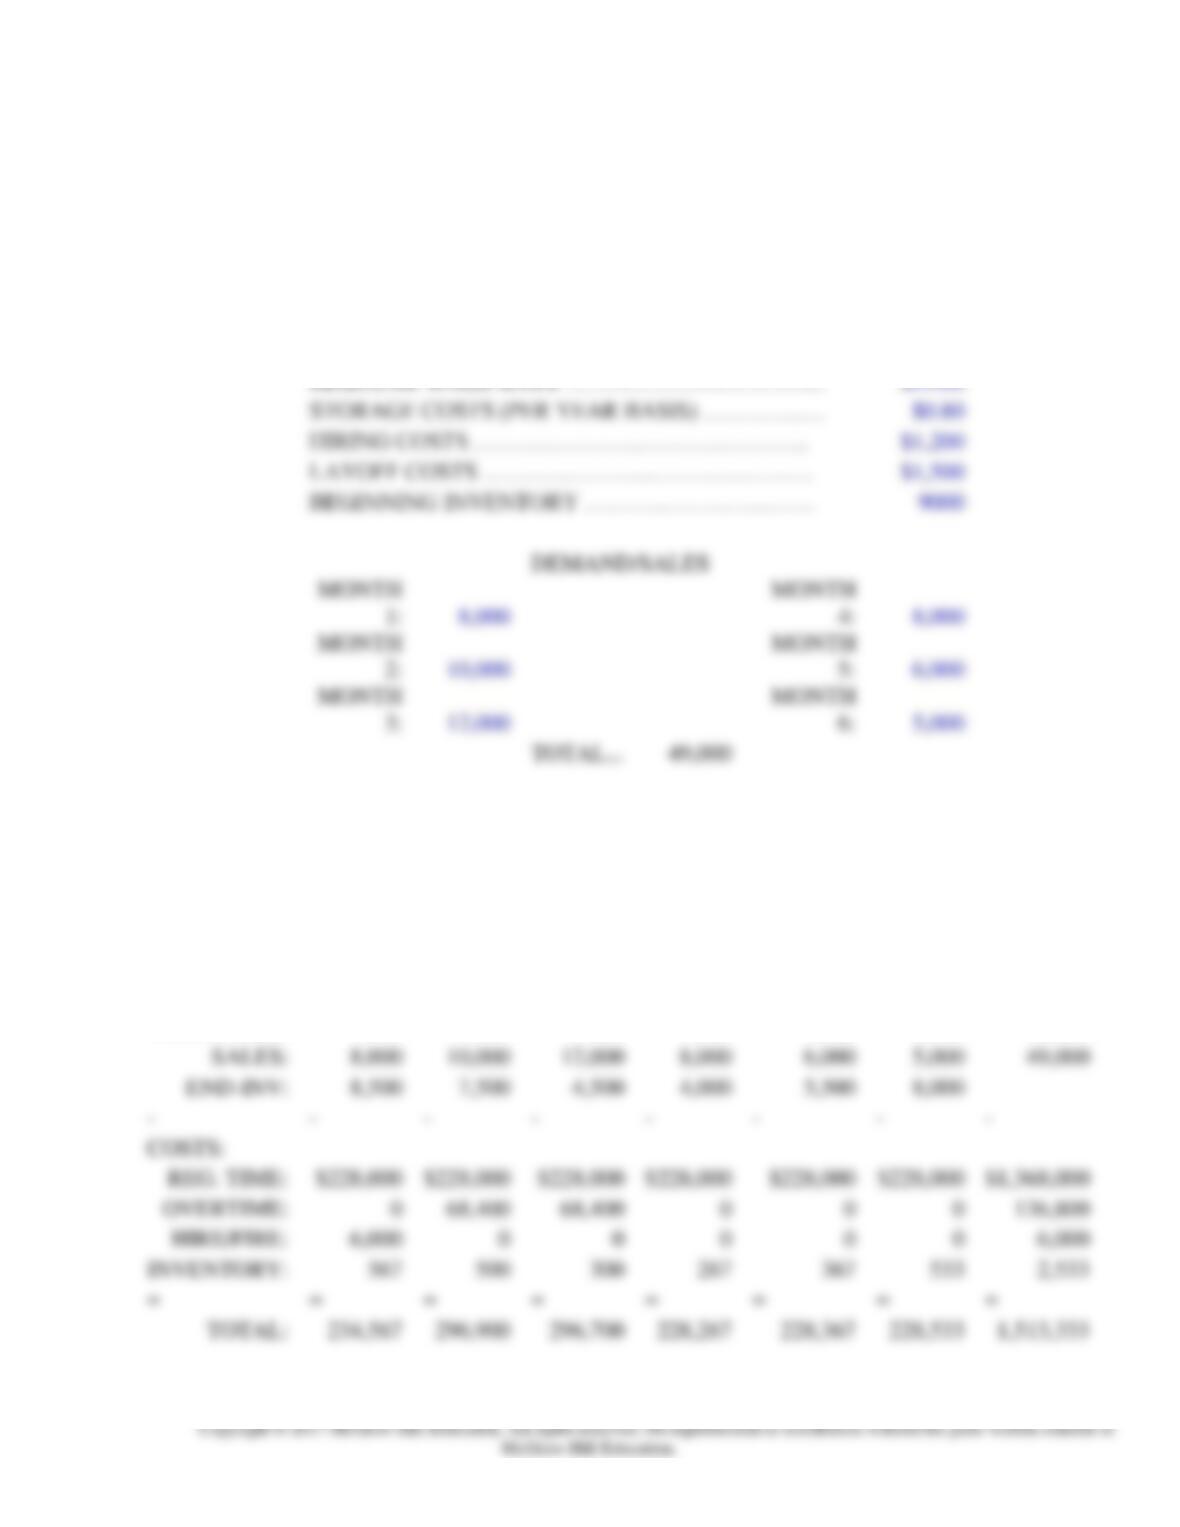
c. The costs of using maximum over time for the two months of highest demand are: 1,513,333
NAME:
*****************
CHAPTER 11 PROBLEM 6
SECT:
*************
DATE:
16-Feb-
16
INPUT SECTION:
PRESENT LABOR FORCE (160 hrs/month)…………
70
POUNDS PRODUCED (PER WORKER/MONTH)….…
100
REGULAR WAGE RATE …………………………….
$19.00
STORAGE COSTS (PER YEAR BASIS) …………….
$0.80
HIRING COSTS ……………………………………..
$1,200
LAYOFF COSTS …………………………………….
$1,500
BEGINNING INVENTORY …………………………
9000
DEMAND/SALES
MONTH
1:
8,000
MONTH
4:
8,000
MONTH
2:
10,000
MONTH
5:
6,000
MONTH
3:
12,000
MONTH
6:
5,000
TOTAL…
49,000
STRATEGY:
Chase
MONTH
1
2
3
4
5
6
TOTAL
–
–
–
–
–
–
–
–
RESOURCES:
REG. WORK:
75
75
75
75
75
75
O.T. %:
0%
20%
20%
0%
0%
0%
PRODUCED:
7,500
9,000
9,000
7,500
7,500
7,500
48,000
SALES:
8,000
10,000
12,000
8,000
6,000
5,000
49,000
END-INV:
8,500
7,500
4,500
4,000
5,500
8,000
–
–
–
–
–
–
–
–
COSTS:
REG. TIME:
$228,000
$228,000
$228,000
$228,000
$228,000
$228,000
$1,368,000
OVERTIME:
0
68,400
68,400
0
0
0
136,800
HIRE/FIRE:
6,000
0
0
0
0
0
6,000
INVENTORY:
567
500
300
267
367
533
2,533
=
=
=
=
=
=
=
=
TOTAL:
234,567
296,900
296,700
228,267
228,367
228,533
1,513,333
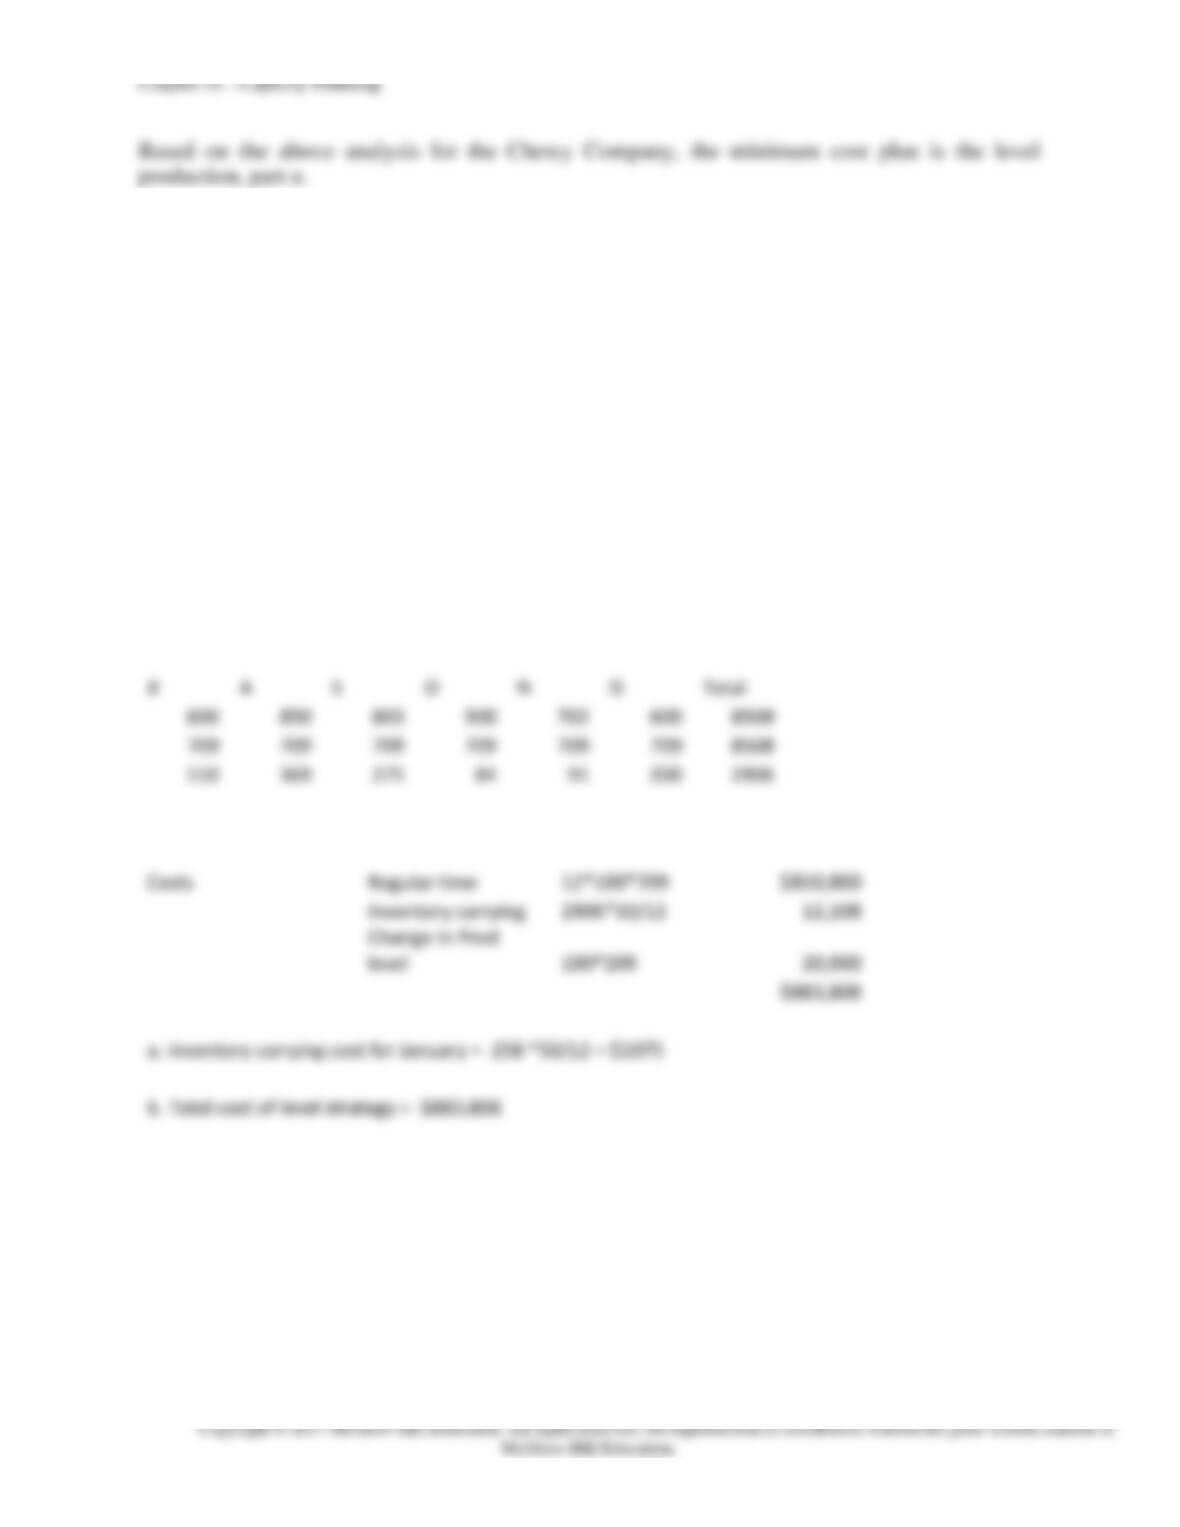
A
S
O
N
D
Total
600
850
803
900
702
600
709
709
709
709
709
709
510
369
275
200
Costs
Regular time
12*100*709
Inventory carrying
2906*50/12
Change in Prod
level
100*209
a. Inventory carrying cost for January = 258 *50/12 = $1075
b. Total cost of level strategy = $883,808
Based on the above analysis for the Chewy Company, the minimum cost plan is the level
production, part a.
7.
Level Strategy
8508/12 = 709 units per month
required
J
F
M
A
M
J
Demand
651
700
850
702
650
500
Production
709
709
709
709
709
709
Inventory
258
267
126
133
192
401