Chapter 10 – Forecasting
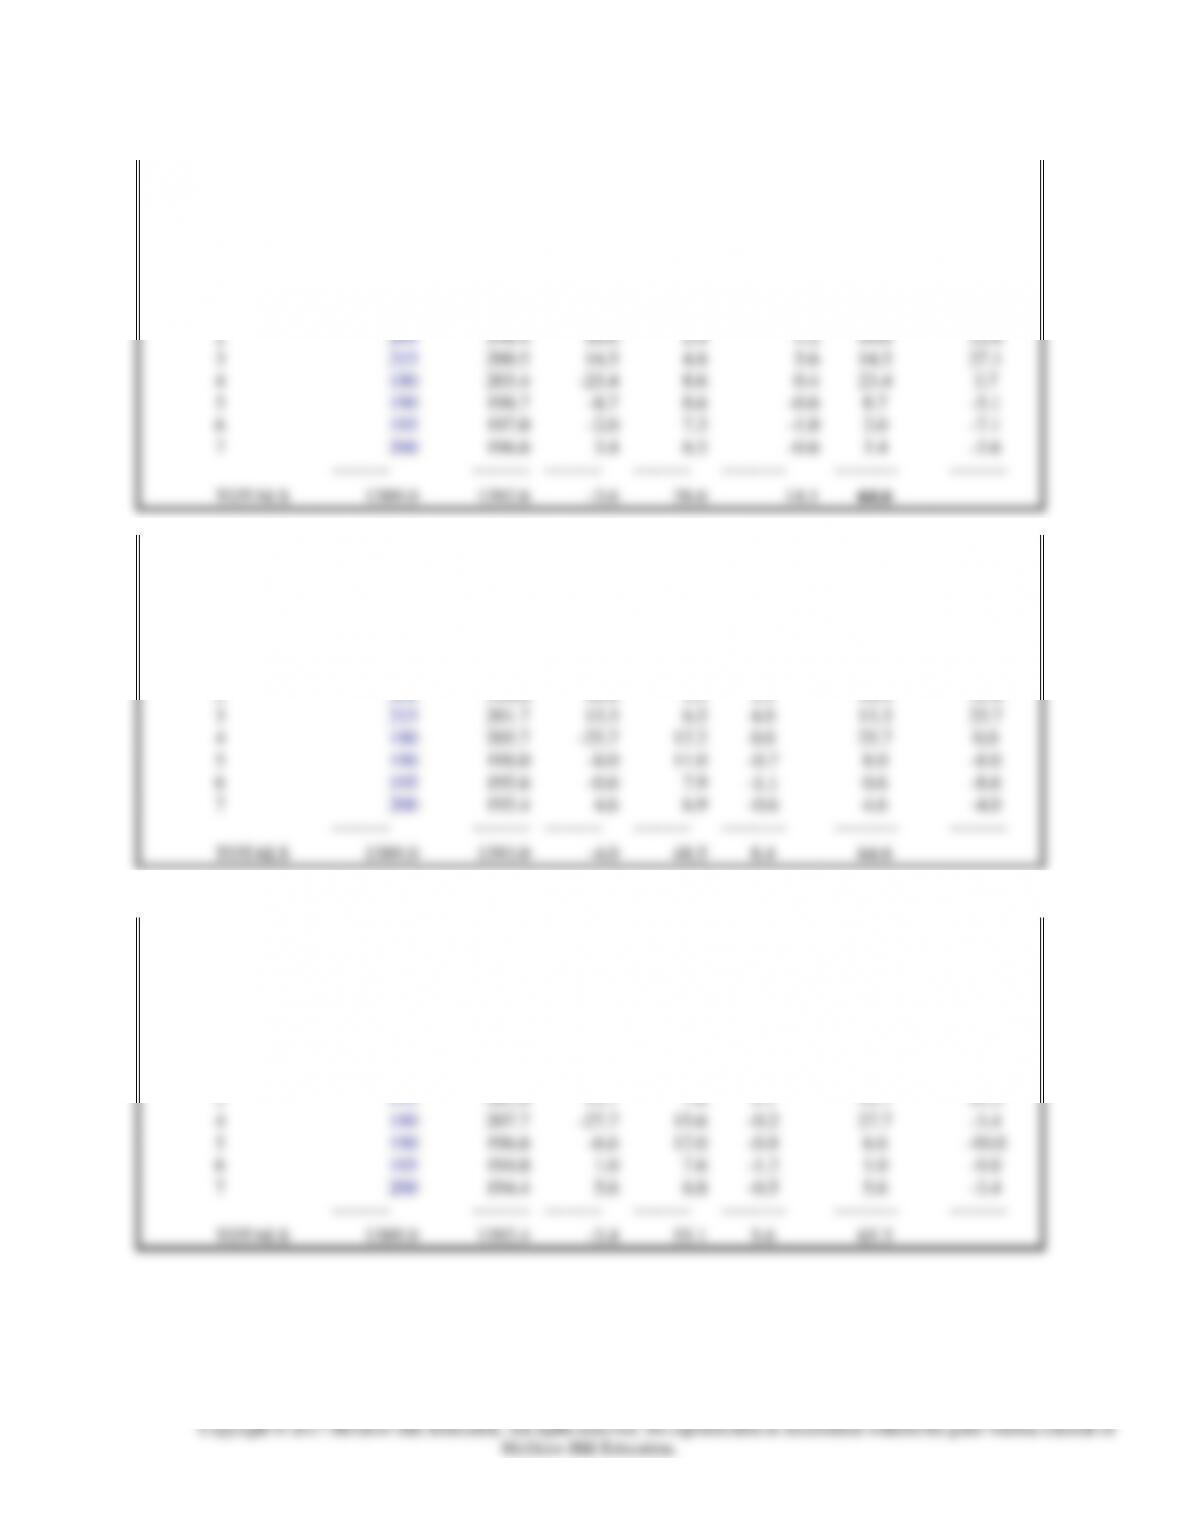
10-12
ALPHA
0.2
Tracking
Absolute
Cum Sum
Day
Demand
Forecast
Error
MAD
Signal
Error
Error
–
–
–
–
–
–
–
–
1
200
198.0
2.0
0.4
5.0
2.0
2.0
2
209
198.4
10.6
2.4
5.2
10.6
12.6
3
215
200.5
14.5
4.8
5.6
14.5
27.1
4
180
203.4
-23.4
8.6
0.4
23.4
3.7
5
190
198.7
-8.7
8.6
-0.6
8.7
-5.1
6
195
197.0
-2.0
7.3
-1.0
2.0
-7.1
7
200
196.6
3.4
6.5
-0.6
3.4
-3.6
———
———
———
———
———-
———-
———
TOTALS
1389.0
1392.6
-3.6
38.6
14.1
64.6
ALPHA
0.3
Tracking
Absolute
Cum Sum
Day
Demand
Forecast
Error
MAD
Signal
Error
Error
–
–
–
–
–
–
–
–
1
200
198.0
2.0
0.6
3.3
2.0
2.0
2
209
198.6
10.4
3.5
3.5
10.4
12.4
3
215
201.7
13.3
6.5
4.0
13.3
25.7
4
180
205.7
-25.7
12.2
0.0
25.7
0.0
5
190
198.0
-8.0
11.0
-0.7
8.0
-8.0
6
195
195.6
-0.6
7.9
-1.1
0.6
-8.6
7
200
195.4
4.6
6.9
-0.6
4.6
-4.0
———
———
———
———
———-
———-
———
TOTALS
1389.0
1393.0
-4.0
48.5
8.4
64.6
ALPHA
0.4
Tracking
Absolute
Cum Sum
Day
Demand
Forecast
Error
MAD
Signal
Error
Error
–
–
–
–
–
–
–
–
1
200
198.0
2.0
0.8
2.5
2.0
2.0
2
209
198.8
10.2
4.6
2.7
10.2
12.2
3
215
202.9
12.1
7.6
3.2
12.1
24.3
4
180
207.7
-27.7
15.6
-0.2
27.7
-3.4
5
190
196.6
-6.6
12.0
-0.8
6.6
-10.0
6
195
194.0
1.0
7.6
-1.2
1.0
-9.0
7
200
194.4
5.6
6.8
-0.5
5.6
-3.4
———
———
———
———
———-
———-
———
TOTALS
1389.0
1392.4
-3.4
55.1
5.6
65.3
Chapter 10 – Forecasting
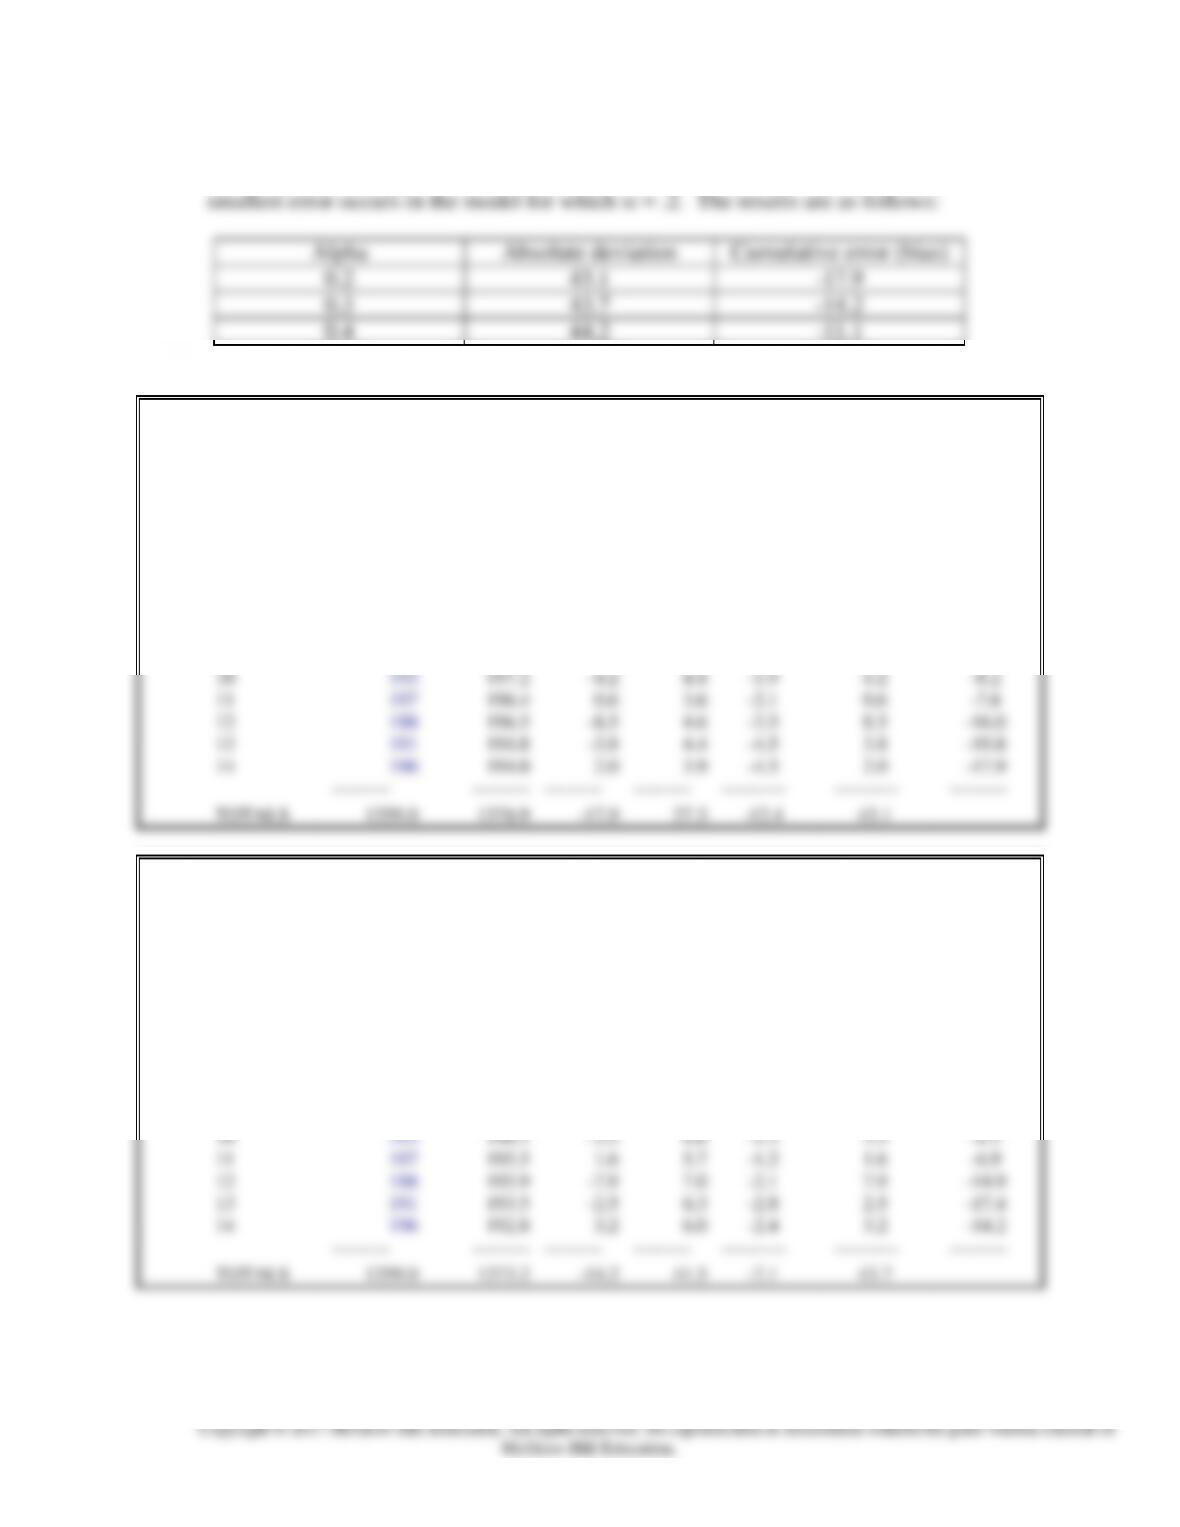
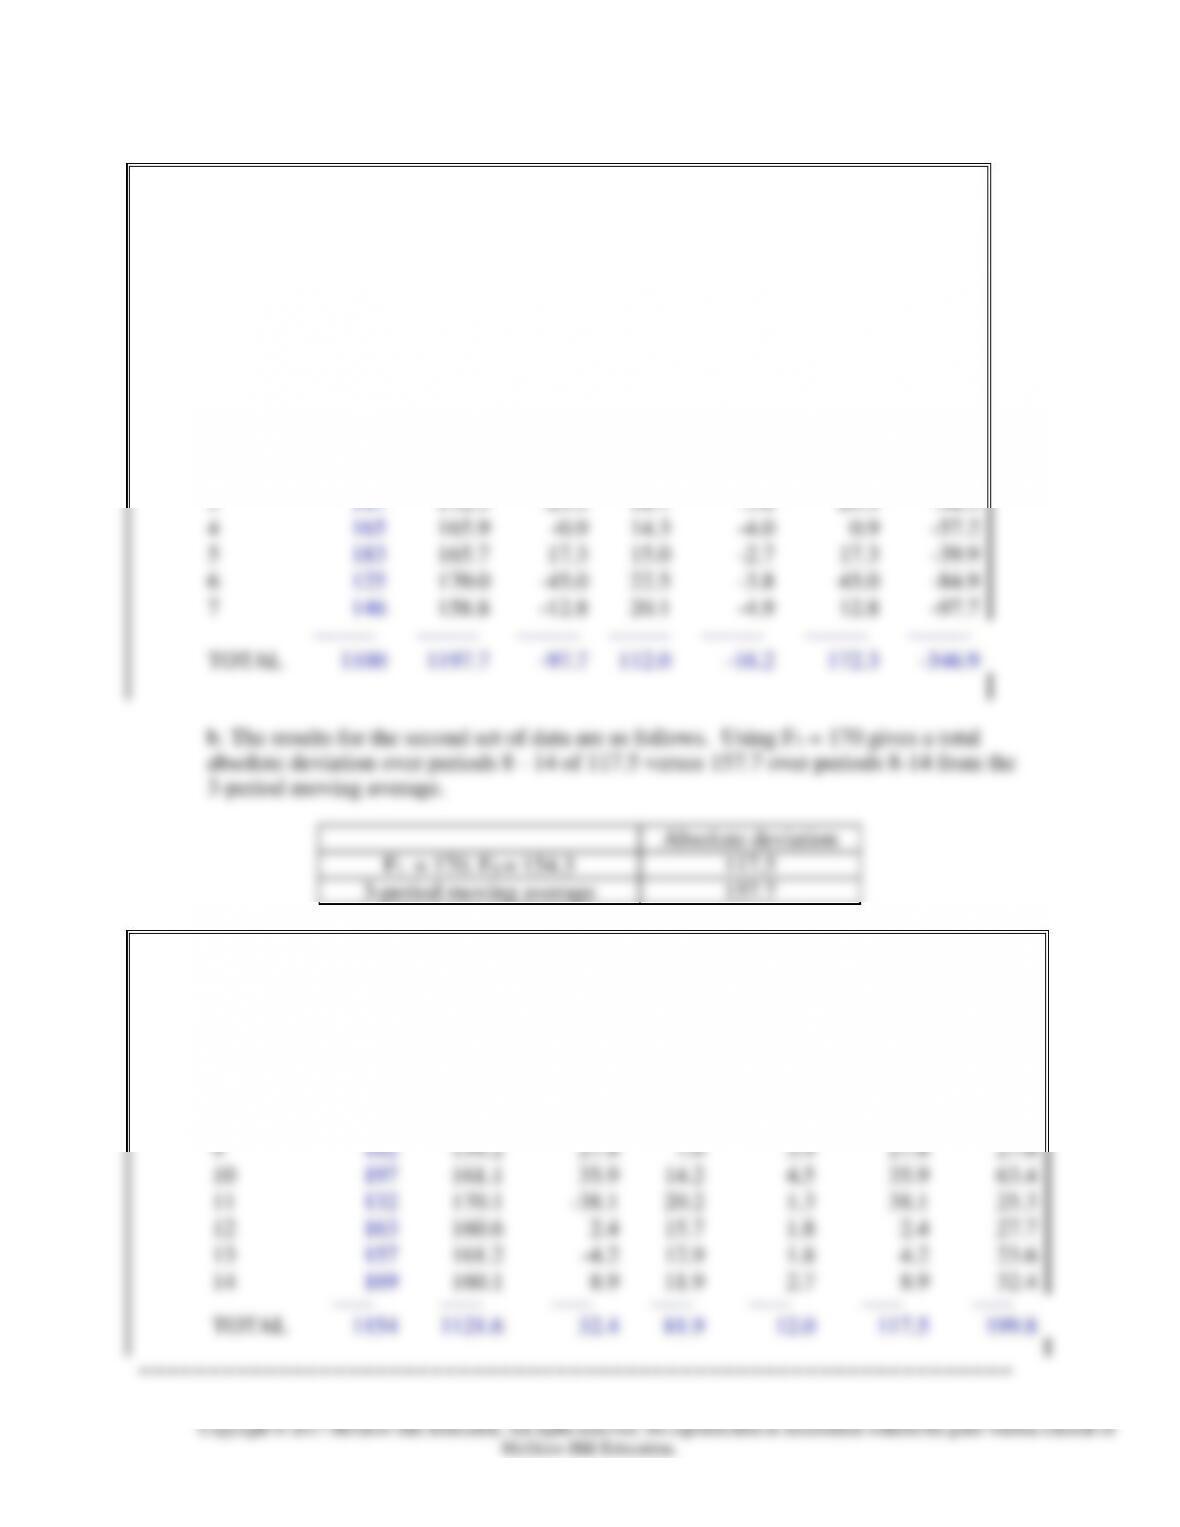
b. Using the same spreadsheet we calculate the errors for the second set of data. The
Chapter 10 – Forecasting
NAME:
****************
CHAPTER 10 PROBLEM 13b
SEC:
**********
ALPHA
0.4
Tracking
Absolute
Cum Sum
Day
Demand
Forecast
Error
MAD
Signal
Error
Error
–
–
–
–
–
–
–
–
8
208
198.0
10.0
4.0
2.5
10.0
10.0
9
186
202.0
-16.0
9.6
-0.6
16.0
-6.0
10
193
195.6
-2.6
8.7
-1.0
2.6
-8.6
11
197
194.6
2.4
8.0
-0.8
2.4
-6.2
12
188
195.5
-7.5
9.4
-1.5
7.5
-13.7
13
191
192.5
-1.5
8.1
-1.9
1.5
-15.2
14
196
191.9
4.1
8.1
-1.4
4.1
-11.1
———
———
———
———
———-
———-
———
TOTALS
1359.0
1370.1
-11.1
55.9
-4.6
44.2
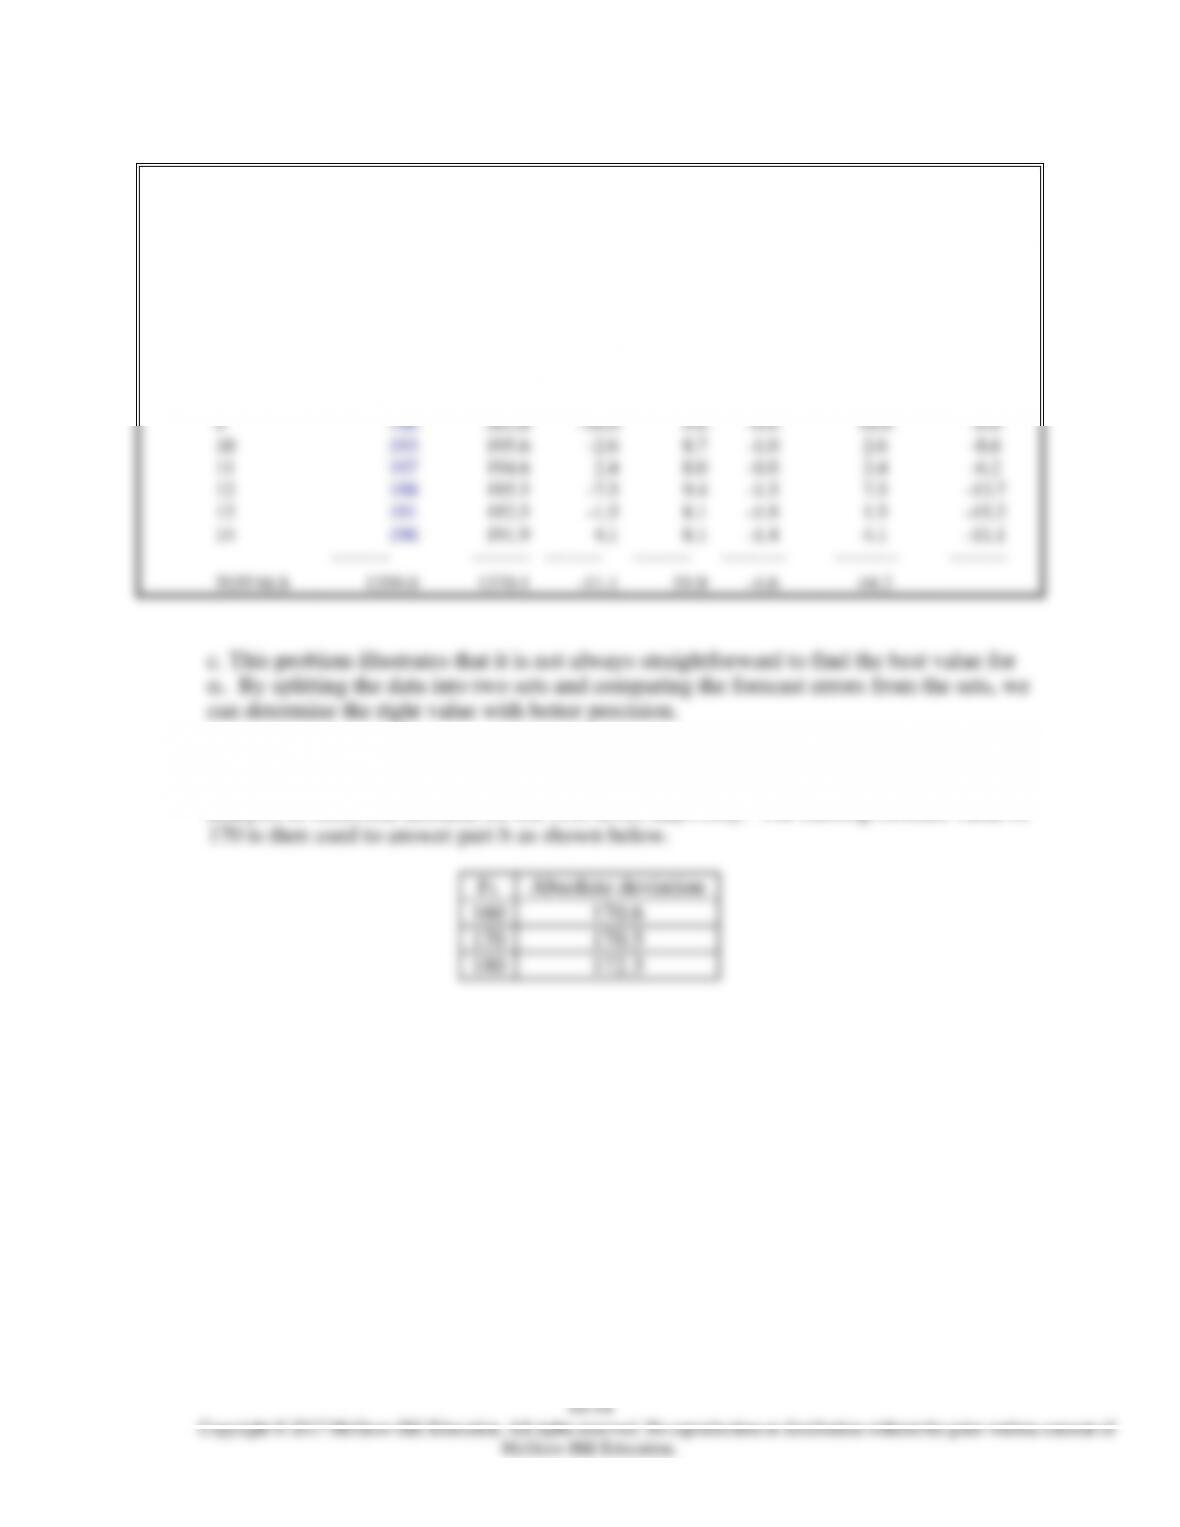
14. a. The model that uses F1 = 170 provides the smallest absolute deviation, based on
analysis of historical demand for the first seven days only. The starting forecast value of
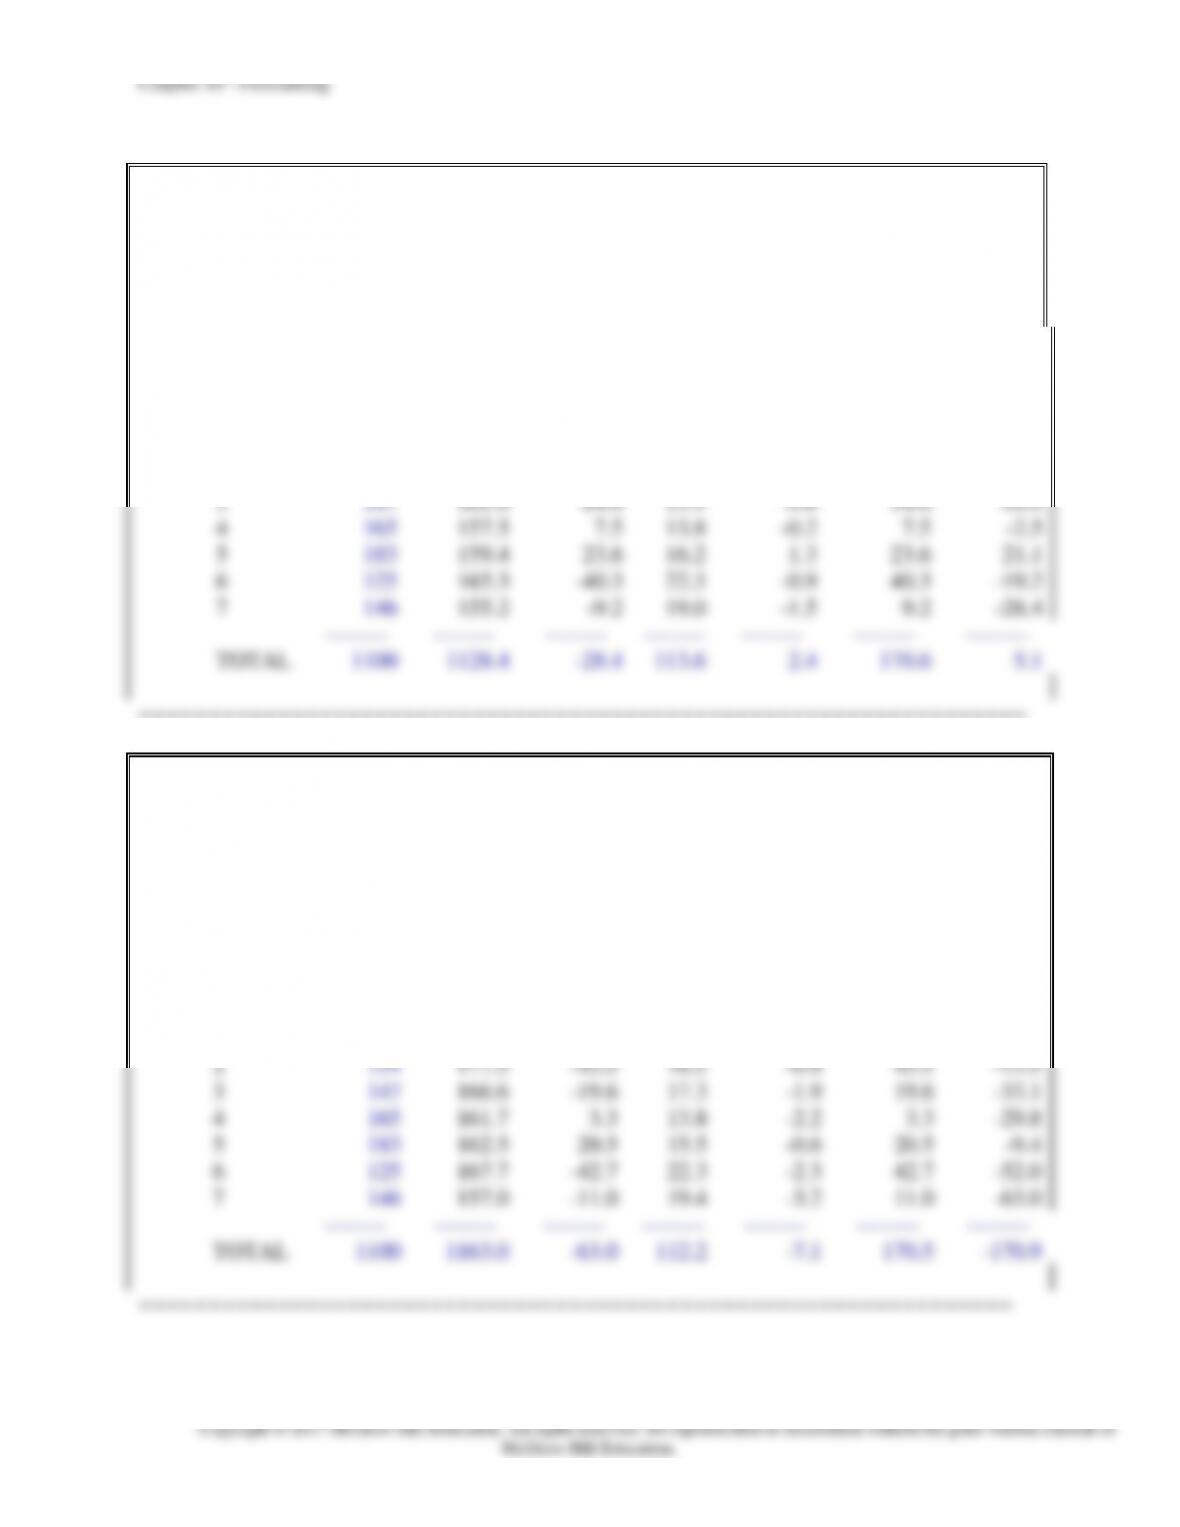
10-15
NAME:
****************
CHAPTER 10 PROBLEM 14
SEC:
**********
ALPHA
0.25
Tracking
Absolute
Cum
Sum
Day
Demand
Forecast
Error
MAD
Signal
Error
Error
–
–
–
–
–
–
–
–
1
200
160.0
40.0
10.0
4.0
40.0
40.0
2
134
170.0
-36.0
16.5
0.2
36.0
4.0
3
147
161.0
-14.0
15.9
-0.6
14.0
-10.0
4
165
157.5
7.5
13.8
-0.2
7.5
-2.5
5
183
159.4
23.6
16.2
1.3
23.6
21.1
6
125
165.3
-40.3
22.3
-0.9
40.3
-19.2
7
146
155.2
-9.2
19.0
-1.5
9.2
-28.4
——–
——–
——–
——–
——–
——–
——–
TOTAL
1100
1128.4
-28.4
113.6
2.4
170.6
5.1
================================================================
NAME:
****************
CHAPTER 10 PROBLEM 14
SEC:
**********
ALPHA
0.25
Tracking
Absolute
Cum
Sum
Day
Demand
Forecast
Error
MAD
Signal
Error
Error
–
–
–
–
–
–
–
–
1
200
170.0
30.0
7.5
4.0
30.0
30.0
2
134
177.5
-43.5
16.5
-0.8
43.5
-13.5
3
147
166.6
-19.6
17.3
-1.9
19.6
-33.1
4
165
161.7
3.3
13.8
-2.2
3.3
-29.8
5
183
162.5
20.5
15.5
-0.6
20.5
-9.4
6
125
167.7
-42.7
22.3
-2.3
42.7
-52.0
7
146
157.0
-11.0
19.4
-3.2
11.0
-63.0
——–
——–
——–
——–
——–
——–
——–
TOTAL
1100
1163.0
-63.0
112.2
-7.1
170.5
-170.9
===============================================================
Chapter 10 – Forecasting
NAME:
****************
CHAPTER 10 PROBLEM 14
SEC:
**********
ALPHA
0.25
Tracking
Absolute
Cum
Sum
Day
Demand
Forecast
Error
MAD
Signal
Error
Error
–
–
–
–
–
–
–
–
1
200
180.0
20.0
5.0
4.0
20.0
20.0
2
134
185.0
-51.0
16.5
-1.9
51.0
-31.0
3
147
172.3
-25.3
18.7
-3.0
25.3
-56.3
4
165
165.9
-0.9
14.3
-4.0
0.9
-57.2
5
183
165.7
17.3
15.0
-2.7
17.3
-39.9
6
125
170.0
-45.0
22.5
-3.8
45.0
-84.9
7
146
158.8
-12.8
20.1
-4.9
12.8
-97.7
——–
——–
——–
——–
——–
——–
——–
TOTAL
1100
1197.7
-97.7
112.0
-16.2
172.3
-346.9
3-period moving average
ALPHA
Tracking
Absolute
CumSum
Day
Signal
Error
Error
–
–
–
–
–
–
–
–
8
154.3
0.1
-4.0
9
154.2
27.8
7.0
27.6
10
161.1
35.9
63.4
11
170.1
-38.1
25.3
12
160.6
27.7
13
161.2
23.6
14
160.1
32.4
Chapter 10 – Forecasting
10-17
11
132
177.7
45.7
12
163
170.3
7.3
13
157
164.0
7.0
14
169
150.7
18.3
18.3
—–
——–
——-
——–
TOTALS
37.7
157.7
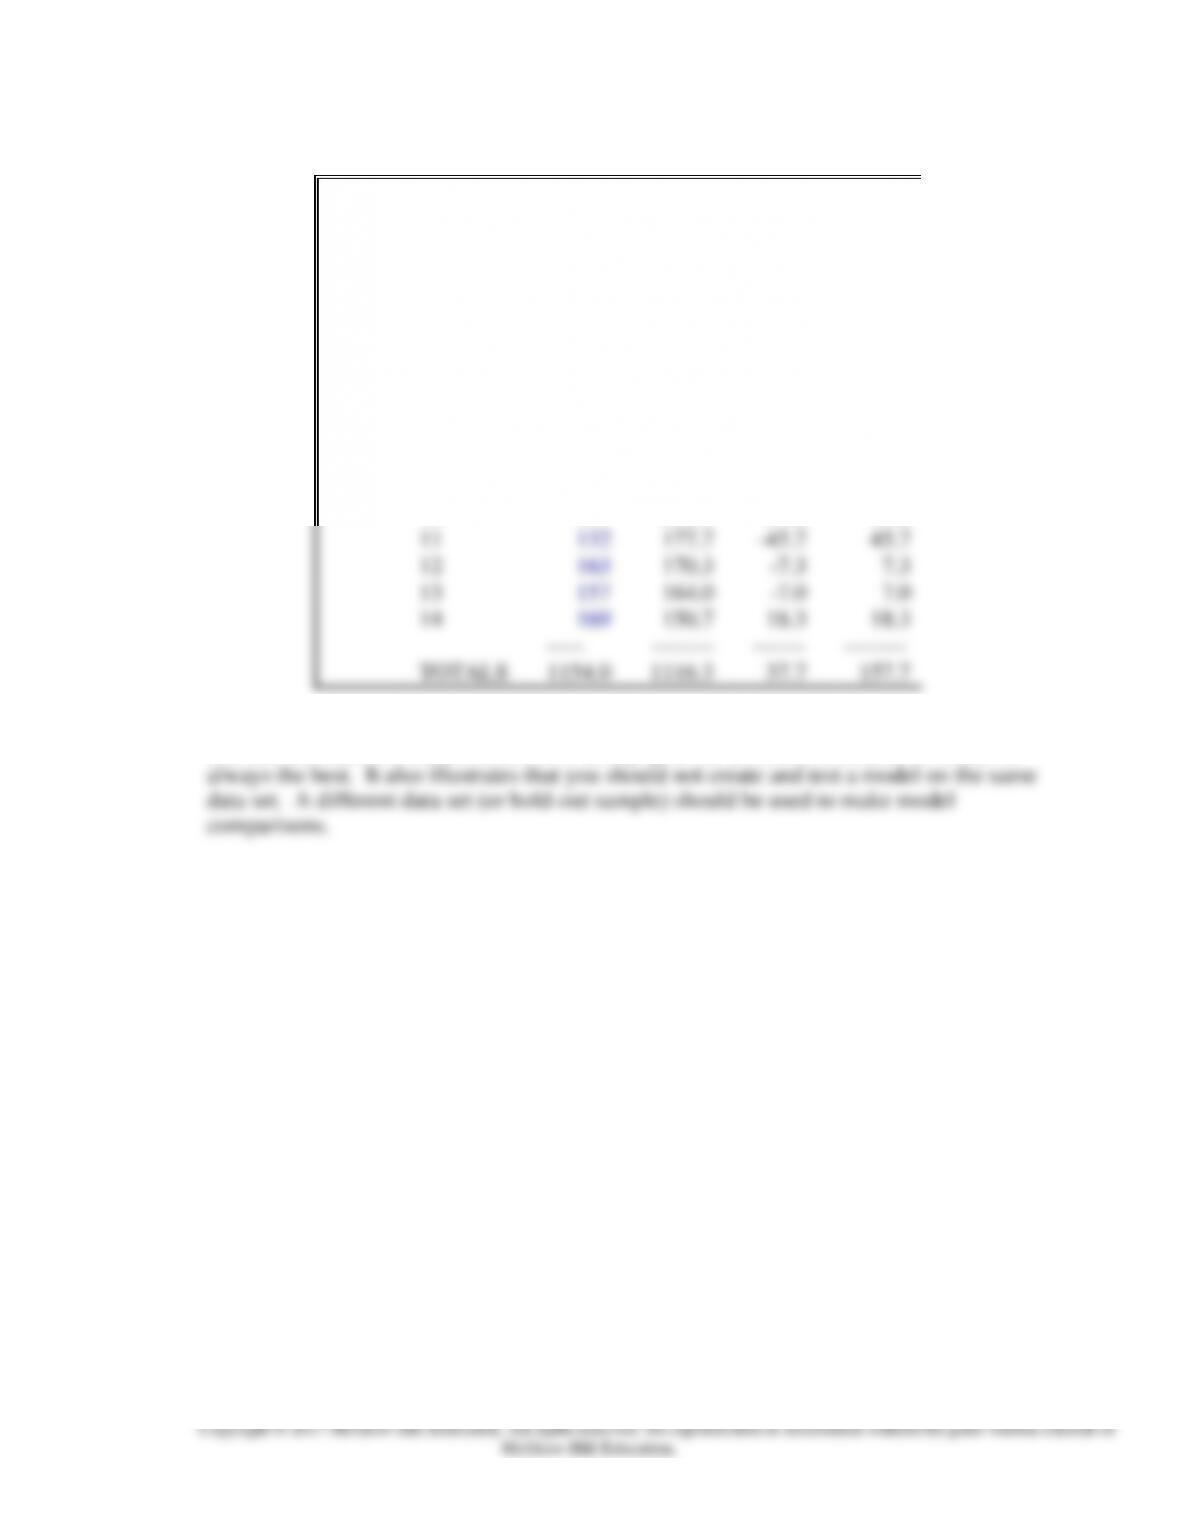
c. This problem illustrates the role of the starting value F1 for the precision of the forecast
and that alternative forecast models will always provide different forecasts; no model is
NAME:
****************
SEC:
**********
3-period moving average
Absolute
Day
Demand
Forecast
Error
Error
–
–
–
–
–
8
154
151.3
2.7
2.7
9
182
141.7
40.3
40.3
10
197
160.7
36.3
36.3
Chapter 10 – Forecasting
10-18
Answers to Supplement Problems
1. a and b. F1 = 10, To = 2, = .2, ß = .4
Tracking
Day Demand Average Trend Forecast MAD Signal
1 10 10.0 2.0 10.0 0.00 —
2 12 12.0 2.0 12.0 0.00 —
3 13 13.8 1.9 14.0 0.20 -5
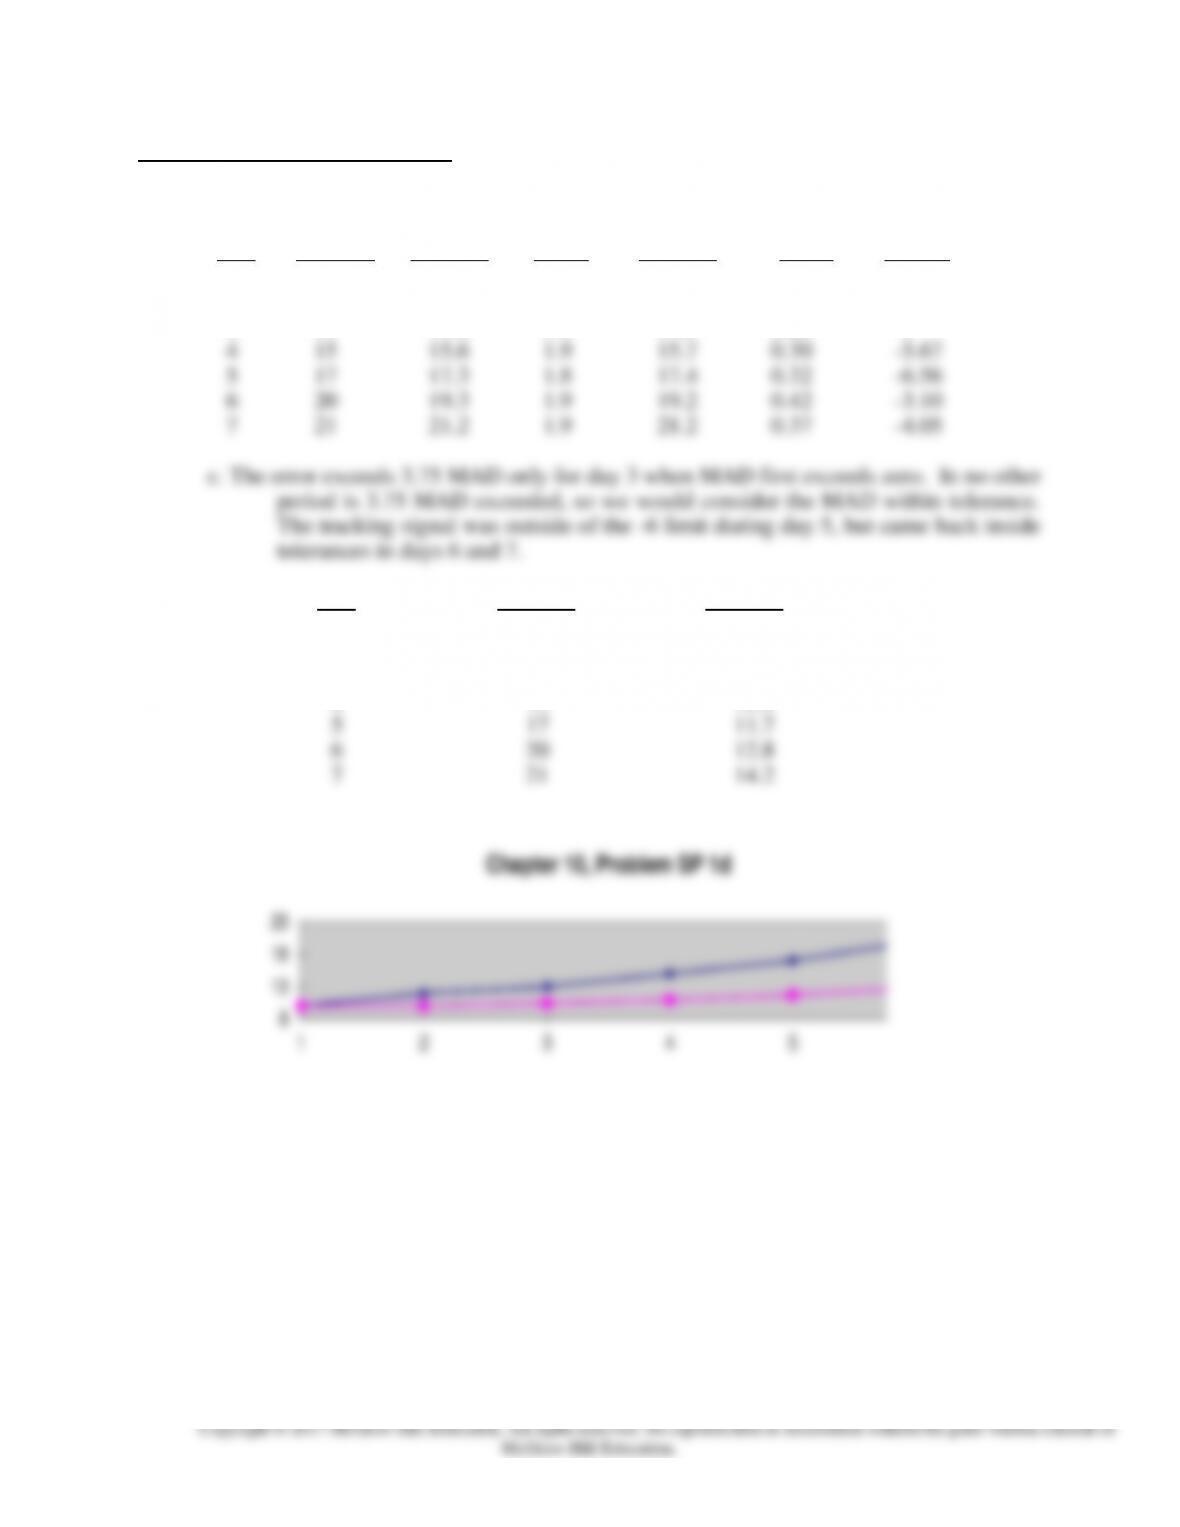
d. Day Demand Forecast
1 10 10
2 12 10
3 13 10.4
4 15 10.9
8
13
18
23
12345
Chapter 10, Problem SP 1d
Chapter 10 – Forecasting
10-19
2a.
Trend Adj
CHAPTER 10
Day
Demand
Average
Trend
Forecast
PROBLEM SP2
——-
————
————-
————-
————-
1
80
108.0
23.6
115.00
2
95
124.3
22.1
131.60
3
120
141.1
21.1
146.42
NAME:
**********
********
4
110
151.8
19.0
162.21
SECT.:
********
5
75
151.6
15.2
170.76
6
60
145.4
10.9
166.77
7
50
135.0
6.6
156.30
8
85
130.3
4.4
141.68
9
99
127.6
2.9
134.72
10
110
126.4
2.1
130.51
11
90
120.8
0.6
128.53
A[o] =
90
12
80
113.1
-1.1
121.41
T[o] =
25
13
65
102.6
-3.0
112.05
alpha =
0.20
14
50
89.7
-4.9
99.68
beta =
0.20
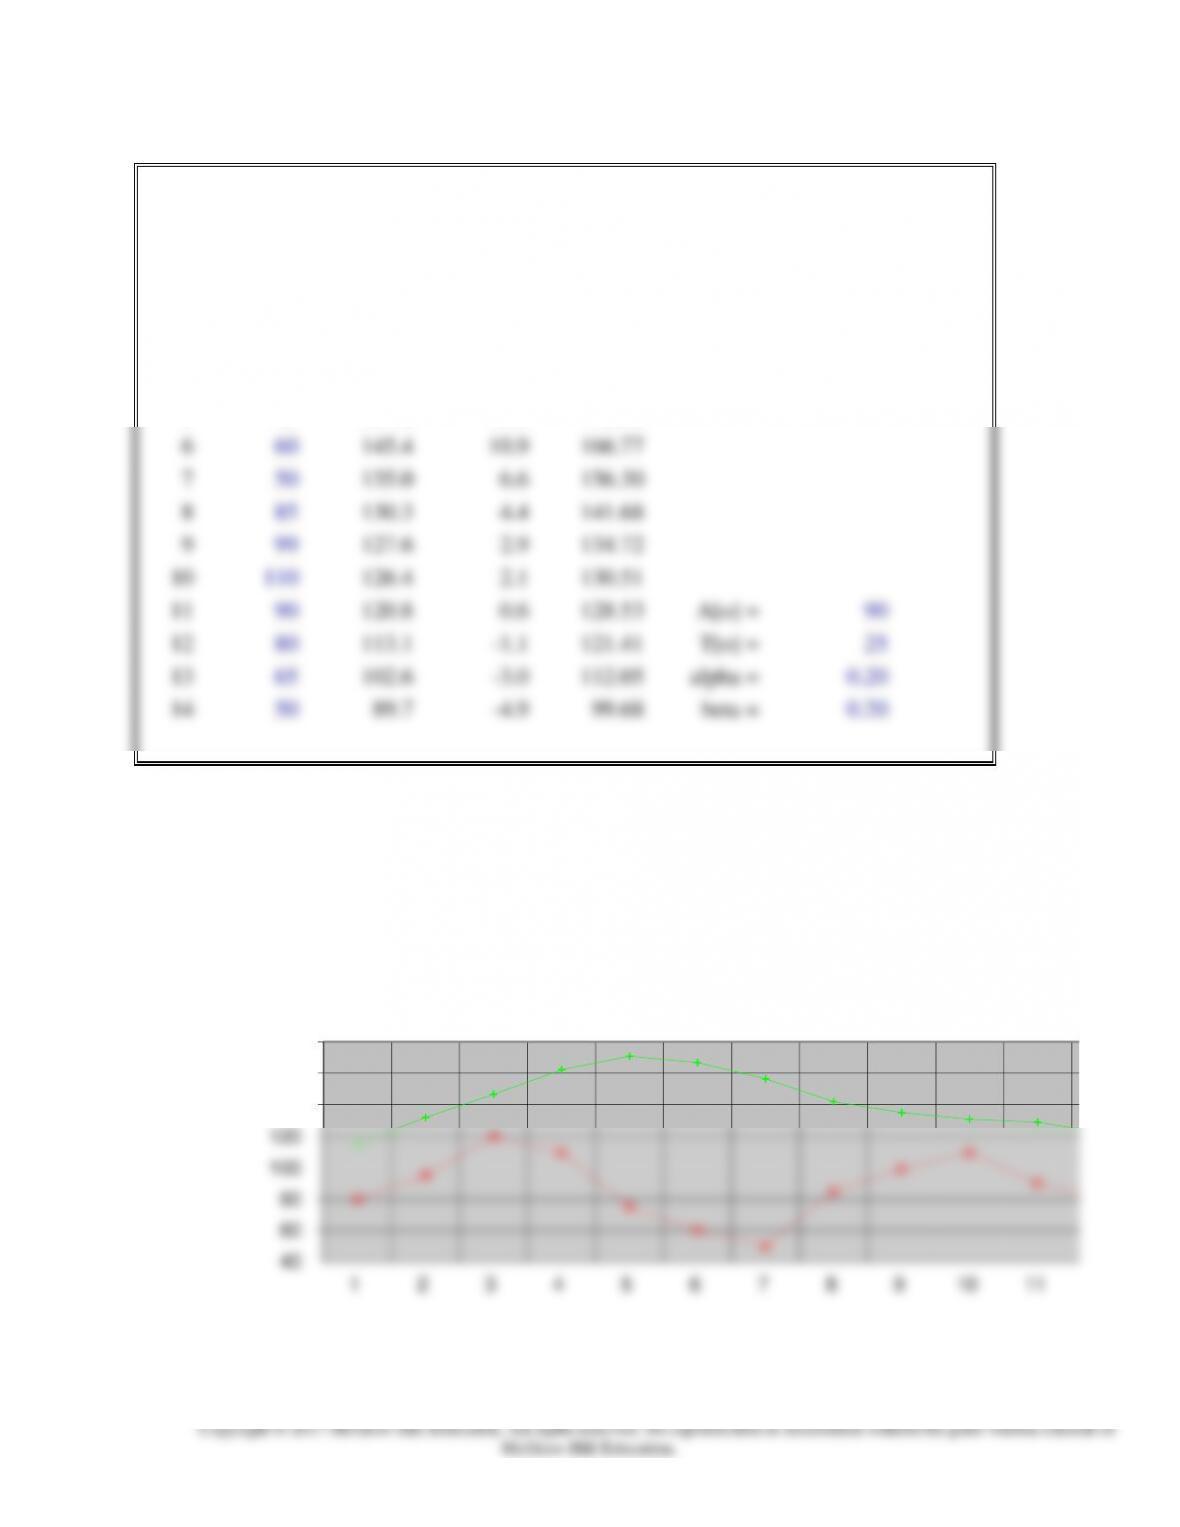
2b.
40
60
80
100
120
140
160
180
1 2 3 4 5 6 7 8 9 10 11
Chapter 10, Problem SP 2b
Demand vs Forecast
Chapter 10 – Forecasting
10-20
Copyright © 2017 McGraw-Hill Education. All rights reserved. No reproduction or distribution without the prior written consent of
McGraw-Hill Education.
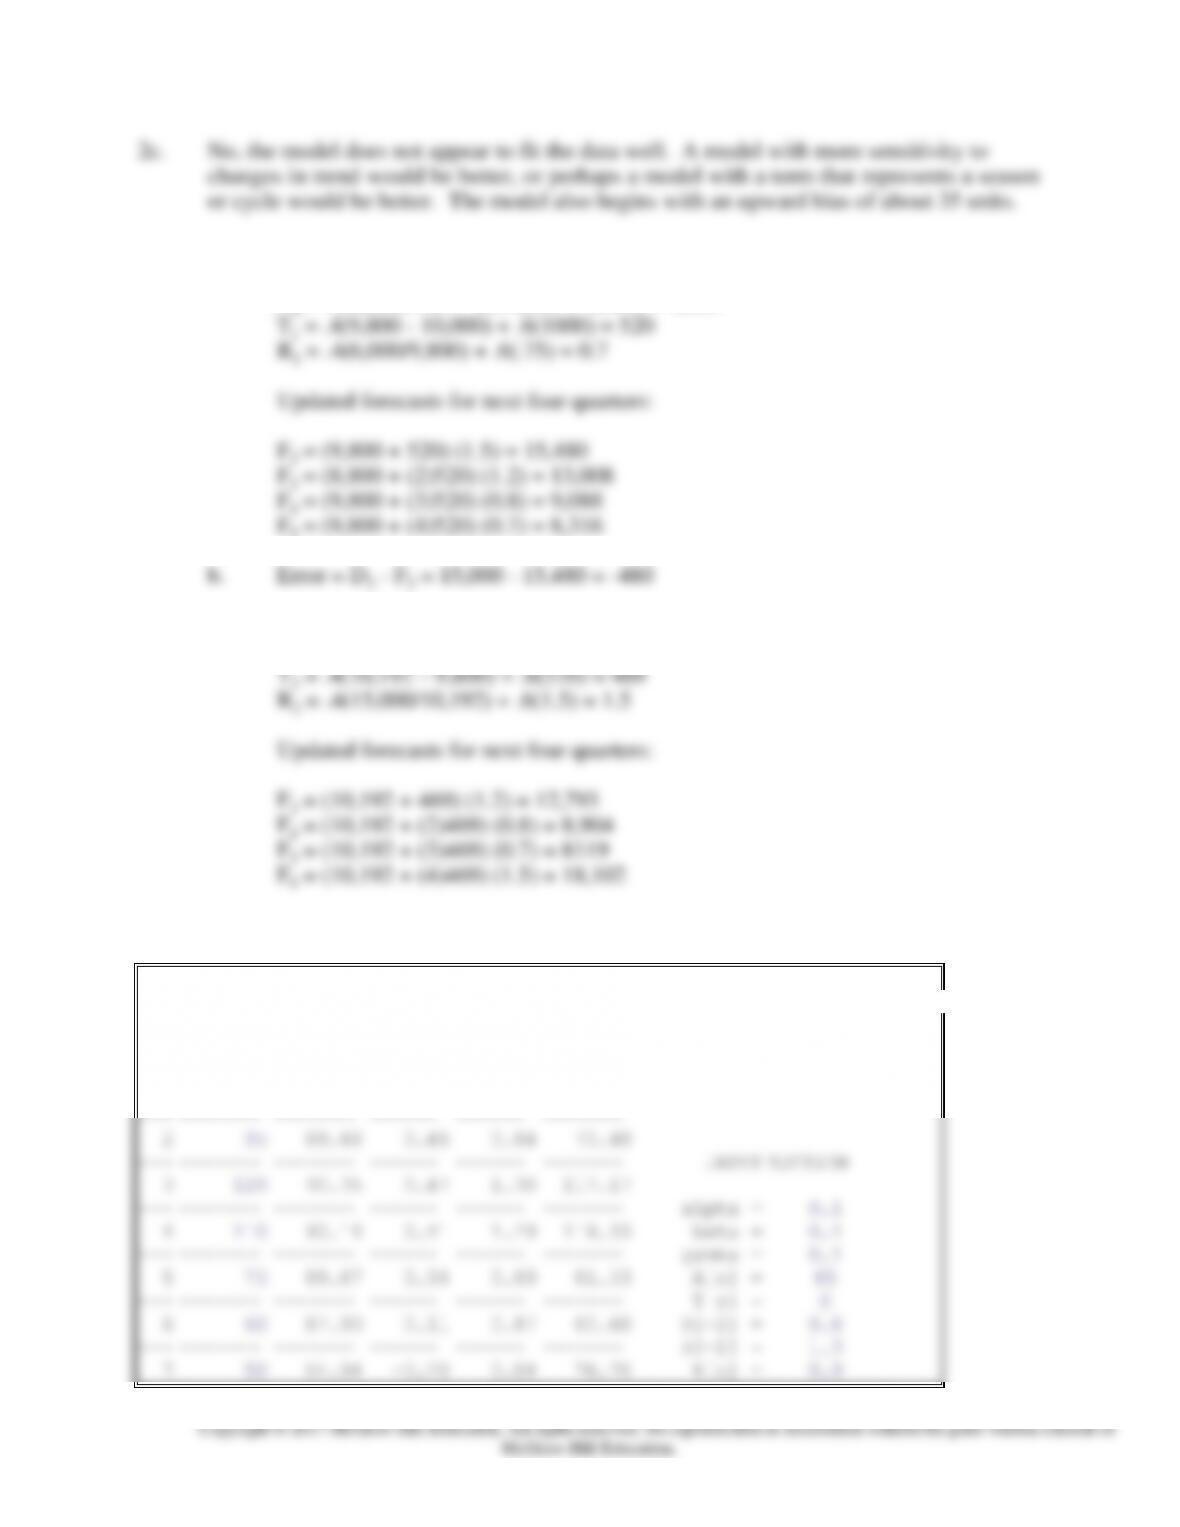
2c. No, the model does not appear to fit the data well. A model with more sensitivity to
changes in trend would be better, or perhaps a model with a term that represents a season
or cycle would be better. The model also begins with an upward bias of about 35 units.
3. a. D1 = 6,000
A1 = .4(6,000/.75) + .6(10,000 + 1,000) = 9,800
c. D2 = 15,000
A2 = .4(15,000/1.5) + .6(9,800 + 520) = 10,192
4a.
WINTERS’ SEASONAL EXPONENTIAL SMOOTHING
CHAPTER 10 PROBLEM SP4
Day
D[t]
A[t]
T[t]
R[t]
F[t]
NAME:
*******
—
——
——
—–
——
——-
SECT:
*******
1
80
86.50
0.15
0.81
68.00
DATE:
—
——-
——-
——
——
——-
2
95
89.68
0.45
0.84
70.40
—
——-
——-
—––
——
——-
INPUT
SECTION
3
120
90.35
0.47
1.30
117.17
—
——-
——-
——
——
——-
alpha =
0.1
4
110
90.18
0.41
1.29
118.33
beta =
0.1
—
——-
——-
——
——
——-
gamma =
0.1
5
75
89.87
0.34
0.89
81.53
A[o] =
85
—
——-
——-
——
——
——-
T[o] =
0
6
60
87.90
0.11
0.87
80.60
R[-2] =
0.8
—
——-
——-
——
——
——-
R[-1] =
1.3
7
50
84.94
–0.20
0.84
76.78
R[o] =
0.9
Chapter 10 – Forecasting
10-21
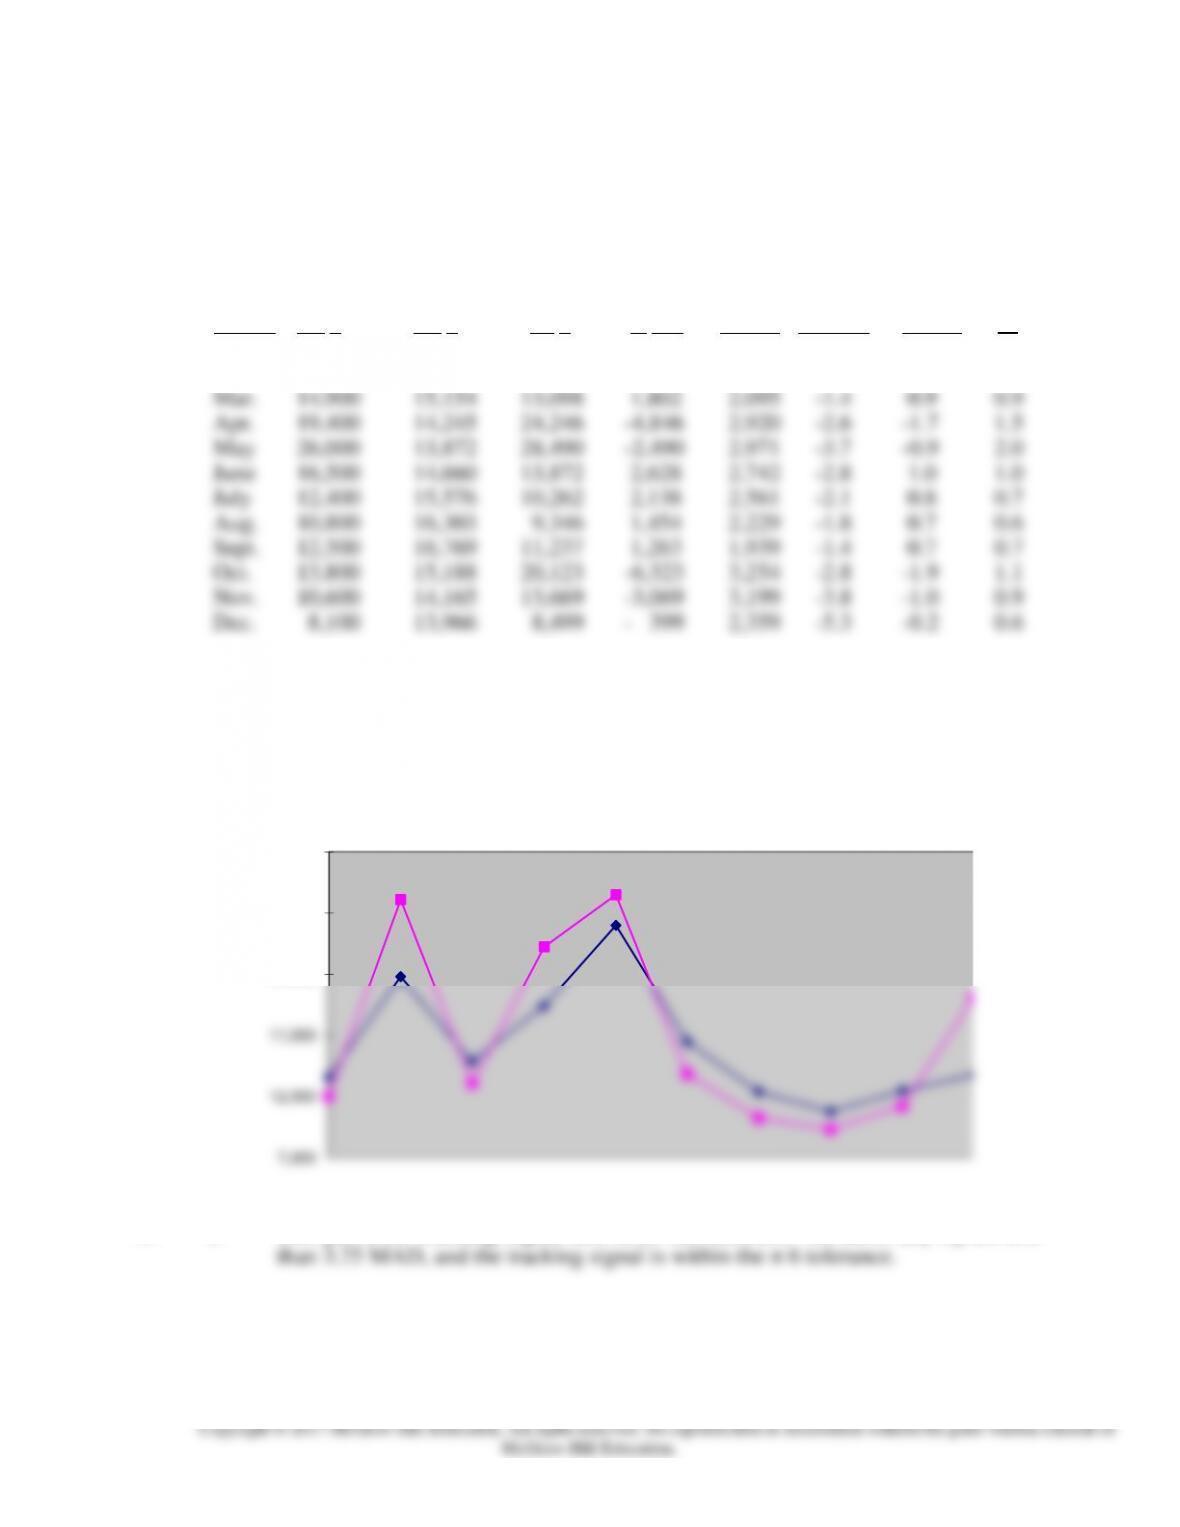
b. The forecast appears to predict demand quite well. The seasonal factors work
well in approximating the demand pattern. Use of the forecast in upcoming
weeks will enable the Donut-Hole Shop to determine if the forecast parameters
can be chosen to give even greater accuracy.
5a. Tracking Dt – Ft/
Month Dt At Ft Dt – Ft MAD Signal MAD Rt
Jan. 13,600 15,600 12,000 1,600 480 3.3 3.3 0.8
Feb. 21,800 14,553 28,080 -6,280 2,220 -2.1 -2.8 1.7
5b.
7,000
12,000
17,000
22,000
27,000
32,000
Chapter 10, Problem SP5b
Chapter 10 – Forecasting
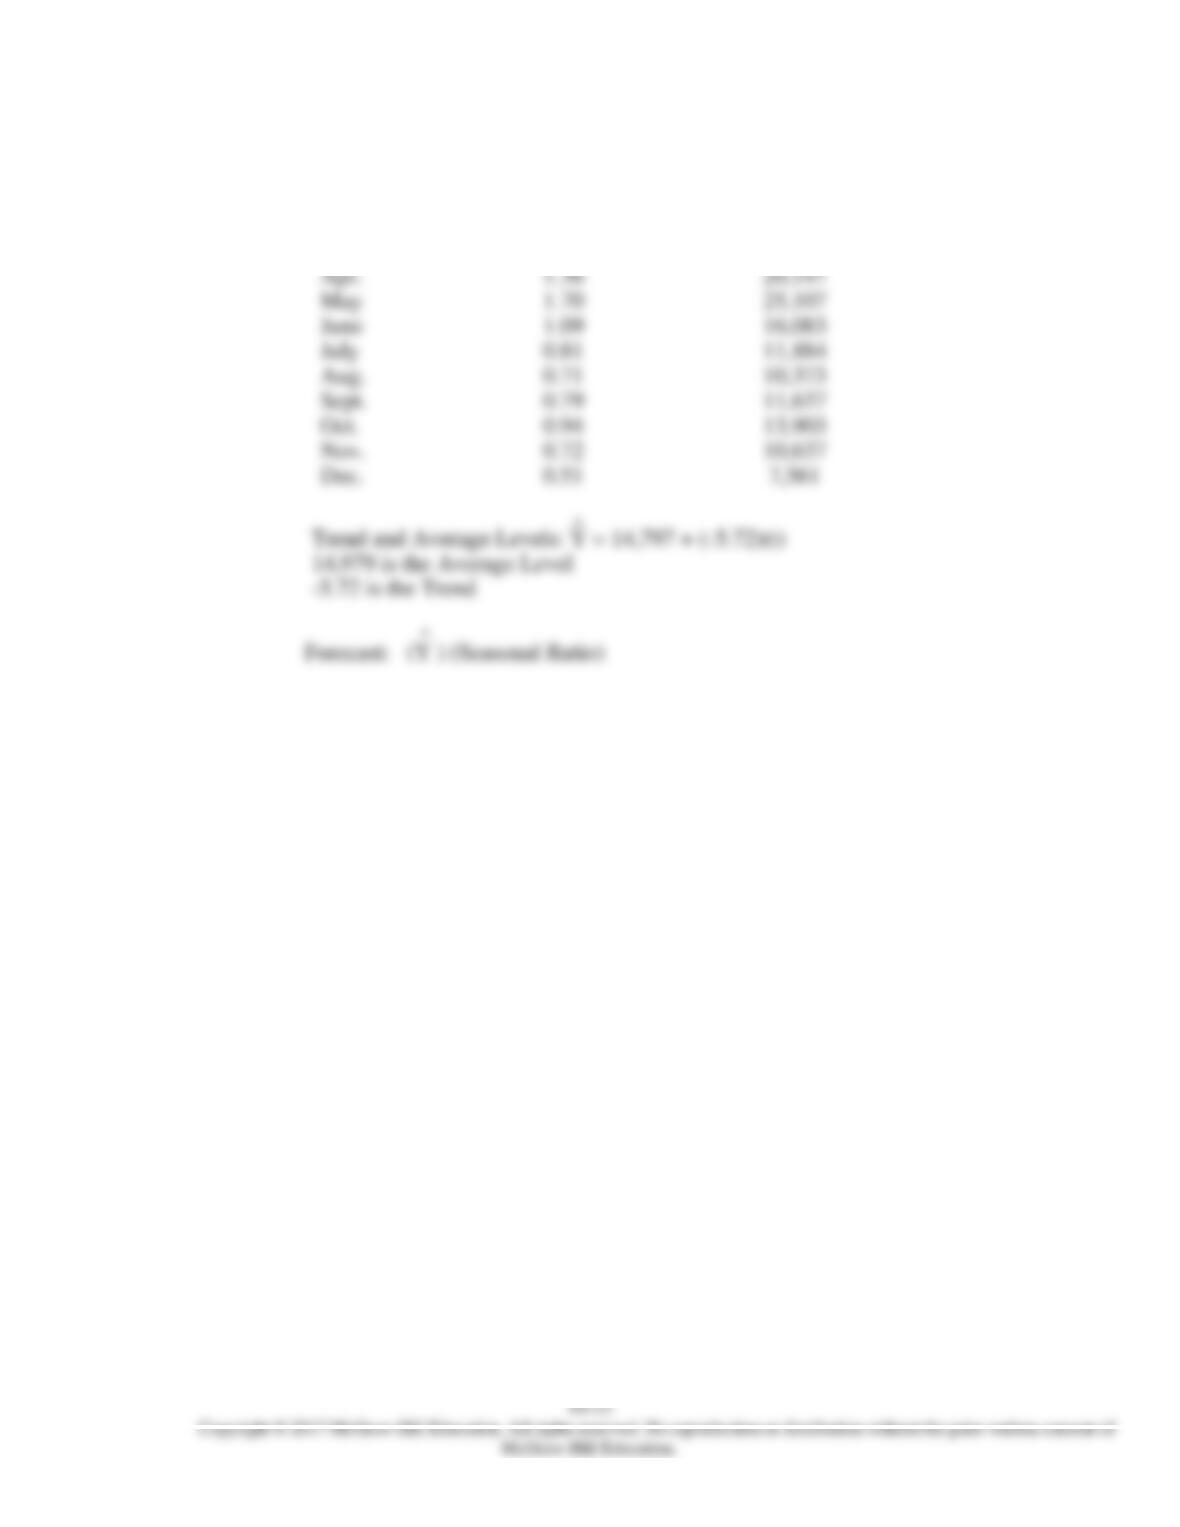
5d. Seasonal
Month Ratio Forecast
Jan 0.85 12,613
Feb. 1.54 22,789
Mar. 1.06 15,621