Unlock document.
This document is partially blurred.
Unlock all pages and 1 million more documents.
Get Access

Best Homes, Inc.: Forecasting
Teaching Note
Synopsis and Purpose
Best Homes is one the largest builders of new residential homes in U.S. with 20,040 new
homes built in 2015. The case presents monthly sales data from 2011 to 2015. This data
is representative of home builders since we estimated the sales of Best Homes based on a
4% market share of the total sales of new homes in the U.S. from the U.S. Census web
site. Thus the trend and seasonality are in line with U.S. home sales in total.
The case explains the problem facing Best Homes in terms of annual planning and the
S&OP process. Forecasting is put in the context of how the forecast will be used. Also,
sales projections are being gathered from the field, and the case asks students to reconcile
those with the forecasts based on historical data.
Discussion Questions
1. What forecasting methods should the company consider? Please justify.
2. Use the classical decomposition method to forecast average demand for 2016 by
month. What is your forecast of monthly average demand for 2016?
3. Best Homes is also collecting sales projections from each of its regions for 2016?
What role should these additional sales projections play, along with the forecast from
question 2 in determining the final national forecast?
Analysis
Question 1:
Because of the seasonality and trend in the data, first order smoothing or an ordinary
Question 2:

Sixty months of data are provided on the template, see Exhibit 1. The first step in classical
decomposition is to develop a 12-month moving average which is done in the 3rd column
on the worksheet. Then a 2-month moving average is developed in the 4th column which is
centered on the original data. The 4th column contains data which is deseasonalized, since
sum of these ratios should be 12 in accordance with the 12-month seasonal period, because
the seasonal ratio is the percentage that a particular month is above or below the average. In
order to obtain a sum of 12, the seasonal ratios are normalized in column 7. This is done by
dividing each ratio by the sum 12.011 and multiplying by 12.
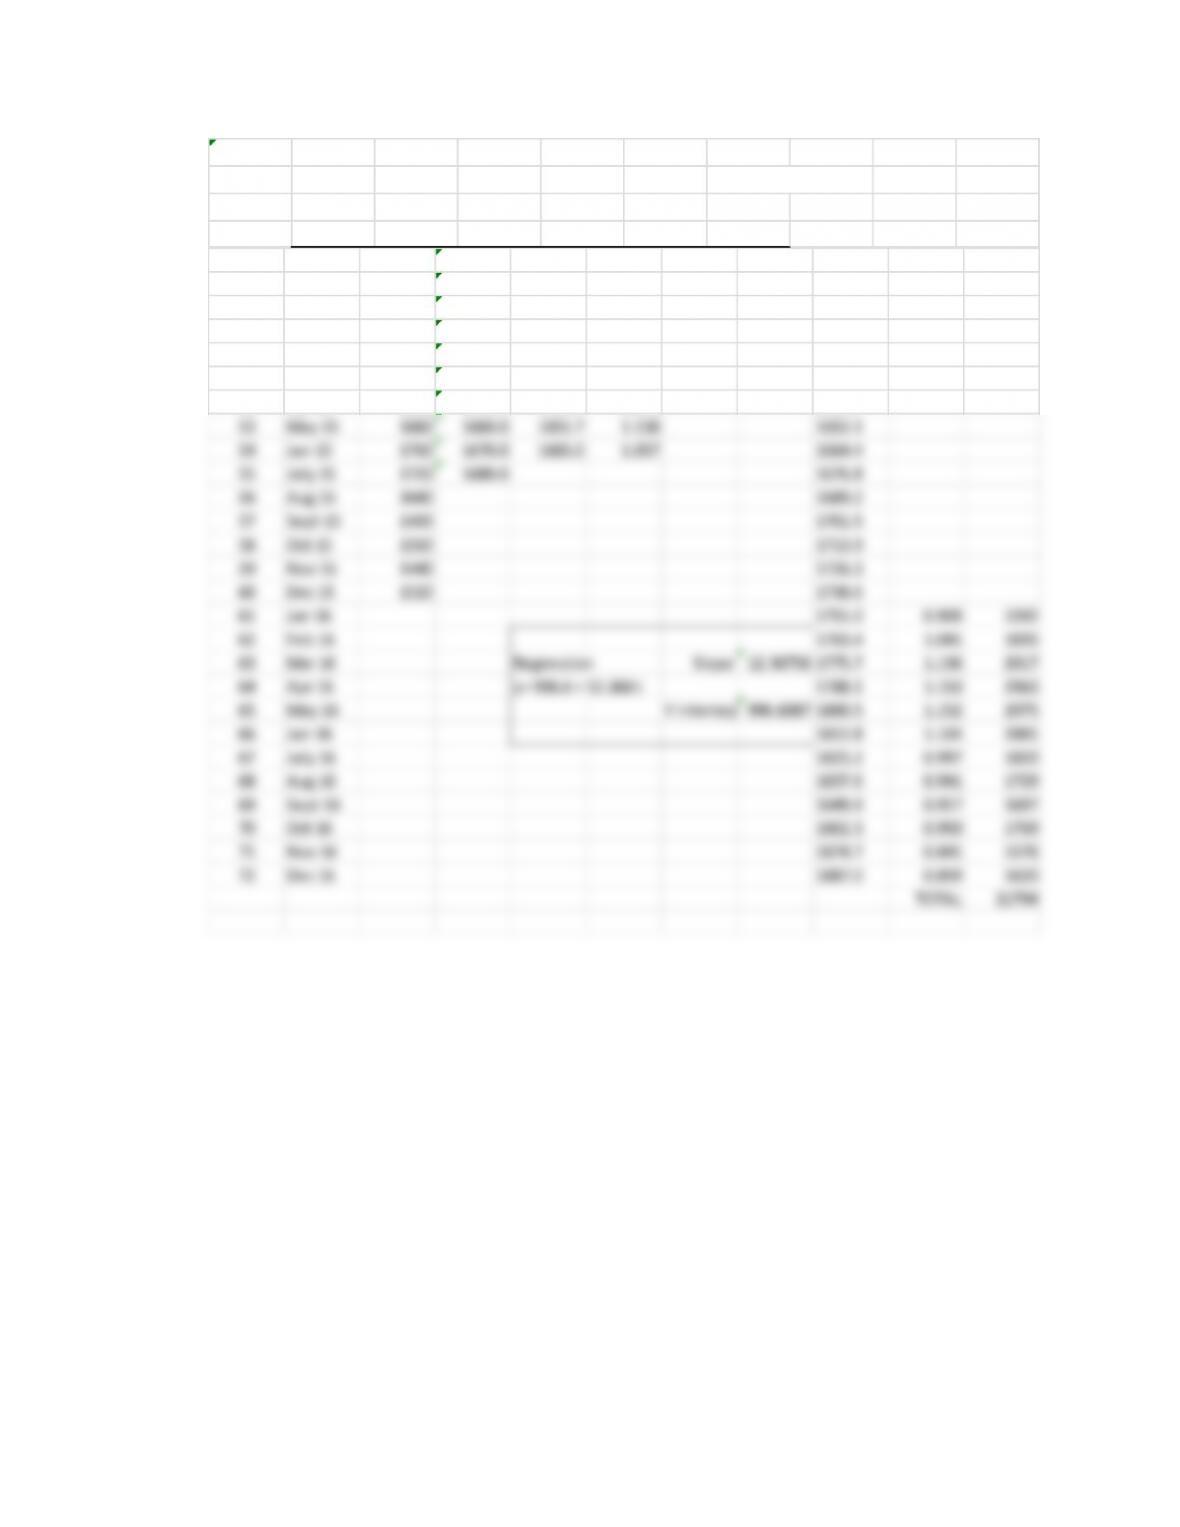
A regression analysis is now run to fit a straight line through the moving average data in
Question 3:
The forecast obtained is a bit concerning. Looking at the historical annual totals from the

2015. The increase from 2014 to 2015 was 2,480 homes. But our forecast from the time
series decomposition is only (21,794 – 20,040) = 1,754.
The question is why the large increase from 2014 to 2015? Can this be expected to
continue, or will sales revert to the more normal increase of approximately 1754? This may
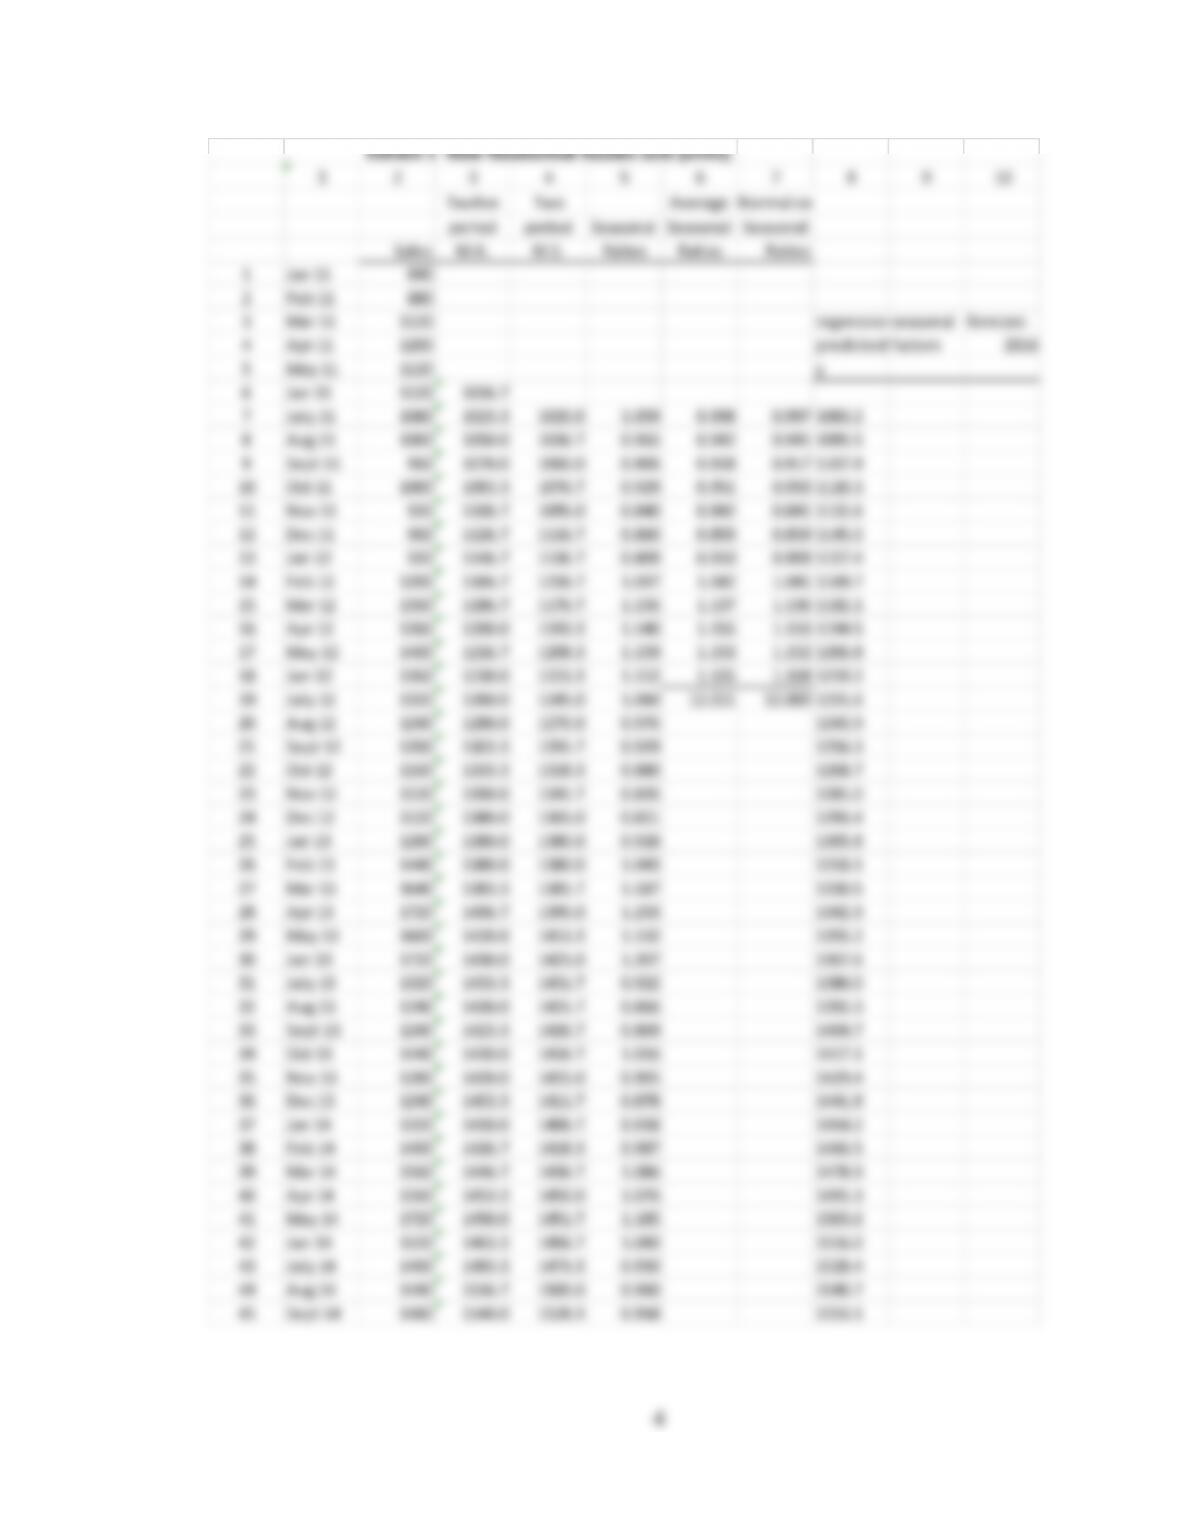
Exhibit 1 New Residential houses sold (units)
12 3 4 5 6 7 8 9 10
Twelve Two Average Normalize
period period Seasonal Seasonal Seasonal
Sales M.A. M.S. Ratios Ratios Ratios
1 Jan 11 840
2 Feb 11 880
3 Mar 11 1120
regression
seasonal forecast
4 Apr 11 1200 predicted factors 2016
5 May 11 1120 y
6 Jun 11 1120 1016.7
7 July 11 1080 1023.3 1020.0 1.059 0.998 0.997 1083.2
8 Aug 11 1000 1050.0 1036.7 0.965 0.942 0.941 1095.5
9 Sept 11 960 1070.0 1060.0 0.906 0.918 0.917 1107.9
10 Oct 11 1000 1083.3 1076.7 0.929 0.951 0.950 1120.3
11 Nov 11 920 1106.7 1095.0 0.840 0.842 0.841 1132.6
12 Dec 11 960 1126.7 1116.7 0.860 0.859 0.859 1145.0
13 Jan 12 920 1146.7 1136.7 0.809 0.910 0.909 1157.4
14 Feb 12 1200 1166.7 1156.7 1.037 1.042 1.041 1169.7
15 Mar 12 1360 1186.7 1176.7 1.156 1.137 1.136 1182.1
16 Apr 12 1360 1200.0 1193.3 1.140 1.155 1.153 1194.5
17 May 12 1400 1216.7 1208.3 1.159 1.153 1.152 1206.8
18 Jun 12 1360 1230.0 1223.3 1.112 1.105 1.104 1219.2
19 July 12 1320 1260.0 1245.0 1.060 12.011 12.000 1231.6
20 Aug 12 1240 1280.0 1270.0 0.976 1243.9
21 Sept 12 1200 1303.3 1291.7 0.929 1256.3
22 Oct 12 1160 1333.3 1318.3 0.880 1268.7
23 Nov 12 1120 1350.0 1341.7 0.835 1281.0
24 Dec 12 1120 1380.0 1365.0 0.821 1293.4
25 Jan 13 1280 1380.0 1380.0 0.928 1305.8
26 Feb 13 1440 1380.0 1380.0 1.043 1318.1
27 Mar 13 1640 1383.3 1381.7 1.187 1330.5
28 Apr 13 1720 1406.7 1395.0 1.233 1342.9
29 May 13 1600 1420.0 1413.3 1.132 1355.2
30 Jun 13 1720 1430.0 1425.0 1.207 1367.6
31 July 13 1320 1433.3 1431.7 0.922 1380.0
32 Aug 13 1240 1430.0 1431.7 0.866 1392.3
33 Sept 13 1240 1423.3 1426.7 0.869 1404.7
34 Oct 13 1440 1410.0 1416.7 1.016 1417.1
35 Nov 13 1280 1420.0 1415.0 0.905 1429.4
36 Dec 13 1240 1403.3 1411.7 0.878 1441.8
37 Jan 14 1320 1410.0 1406.7 0.938 1454.2
38 Feb 14 1400 1426.7 1418.3 0.987 1466.5
39 Mar 14 1560 1446.7 1436.7 1.086 1478.9
40 Apr 14 1560 1453.3 1450.0 1.076 1491.3
41 May 14 1720 1450.0 1451.7 1.185 1503.6
42 Jun 14 1520 1463.3 1456.7 1.043 1516.0
43 July 14 1400 1483.3 1473.3 0.950 1528.4
44 Aug 14 1440 1516.7 1500.0 0.960 1540.7
45 Sept 14 1480 1540.0 1528.3 0.968 1553.1
12 3 4 5 6 7 8 9 10
Twelve Two Average Normalize
period period Seasonal Seasonal Seasonal
Sales M.A. M.S. Ratios Ratios Ratios
46 Oct 14 1520 1570.0 1555.0 0.977 1565.5
47 Nov 14 1240 1583.3 1576.7 0.786 1577.8
48 Dec 14 1400 1603.3 1593.3 0.879 1590.2
49 Jan 15 1560 1630.0 1616.7 0.965 1602.6
50 Feb 15 1800 1646.7 1638.3 1.099 1615.0
51 Mar 15 1840 1640.0 1643.3 1.120 1627.3
52 Apr 15 1920 1643.3 1641.7 1.170 1639.7
53 May 15 1880 1660.0 1651.7 1.138 1652.1
54 Jun 15 1760 1670.0 1665.0 1.057 1664.4
55 July 15 1720 1680.0 1676.8
56 Aug 15 1640 1689.2
57 Sept 15 1400 1701.5
58 Oct 15 1560 1713.9
59 Nov 15 1440 1726.3
60 Dec 15 1520 1738.6
61 Jan 16 1751.0 0.909 1592
62 Feb 16 1763.4 1.041 1835
63 Mar 16 Regression Slope 12.36756 1775.7 1.136 2017
64 Apr 16 y= 996.6 + 12.368 t 1788.1 1.153 2063
65 May 16
Y intercept
996.6087 1800.5 1.152 2075
66 Jun 16 1812.8 1.104 2001
67 July 16 1825.2 0.997 1820
68 Aug 16 1837.6 0.941 1729
69 Sept 16 1849.9 0.917 1697
70 Oct 16 1862.3 0.950 1769
71 Nov 16 1874.7 0.841 1576
72 Dec 16 1887.0 0.859 1620
TOTAL 21794


