
1
CHAPTER 8
COMPLEX DESIGNS
CHAPTER OUTLINE AND OBJECTIVES
I. Overview
II. Describing Effects in a Complex Design
Researchers use complex designs to study the effects of two or more independent variables in one
experiment.
In complex designs, each independent variable can be studied with an independent groups design or
with a repeated measures design.
The simplest complex design is a 2 2 designCtwo independent variables, each with two levels.
The number of different conditions in a complex design can be determined by multiplying the number of
levels for each independent variable (e.g., 2 2 = 4).
More powerful and efficient complex designs can be created by including more levels of an
independent variable or by including more independent variables in the design.
A. An Example of a 2 2 Design
B. Main Effects and Interaction Effects
The overall effect of each independent variable in a complex design is called a main effect and
represents the differences among the average performance for each level of an independent
variable collapsed across the levels of the other independent variable.
An interaction effect between independent variables occurs when the effect of one independent
variable differs depending on the levels of the second independent variable.
C. Describing Interaction Effects
Evidence for interaction effects can be identified using descriptive statistics presented in graphs
(nonparallel lines) or tables (subtraction method).
The presence of an interaction effect is confirmed using inferential statistics.
D. Complex Designs with Three Independent Variables
III. Analysis of Complex Designs
In a complex design with two independent variables, inferential statistics are used to test three effects:
the main effects for each independent variable and the interaction effect between the two independent
variables.

2
Descriptive statistics are needed to interpret the results of inferential statistics.
How researchers interpret the results of a complex design differs depending on whether a statistically
significant interaction effect is present or absent in the data.
A. Analysis Plan with an Interaction Effect
If the analysis of a complex design reveals a statistically significant interaction effect, the source of
the interaction effect is identified using simple main effects analyses and comparisons of two
means.
A simple main effect is the effect of one independent variable at one level of a second independent
variable.
B. Analysis Plan with No Interaction Effect
If the analysis of a complex design indicates the interaction effect between independent variables is
not statistically significant, the next step in the analysis plan is to determine whether the main
effects of the variables are statistically significant.
The source of a statistically significant main effect can be specified more precisely by performing
comparisons of two means or using confidence intervals to compare means two at a time.
IV. Interpreting Interaction Effects
A. Interaction Effects and Theory Testing
Theories frequently predict that two or more independent variables interact to influence behavior;
therefore, complex designs are needed to test theories.
Tests of theories can sometimes produce contradictory findings. Interaction effects can be useful in
resolving these contradictions.
B. Interaction Effects and External Validity
When no interaction effect occurs in a complex design, the effects of each independent variable
can be generalized across the levels of the other independent variable; thus, external validity of the
independent variables increases.
The presence of an interaction effect identifies boundaries for the external validity of a finding by
specifying the conditions in which an effect of an independent variable occurs.
C. Interaction Effects and Ceiling and Floor Effects
When participants’ performance reaches a maximum (ceiling) or a minimum (floor) in one or more
conditions of an experiment, results for an interaction effect are uninterpretable.
D. Interaction Effects and the Natural Groups Design
3
Researchers use complex designs to make causal inferences about natural groups variables when
they test a theory for why natural groups differ.
Three steps for making a causal inference involving a natural groups variable are to state a theory
for why group differences exist, manipulate an independent variable that should demonstrate the
theorized process, and test whether an interaction effect occurs between the manipulated
independent variable and natural groups variable.
V. Summary
REVIEW QUESTIONS AND ANSWERS
These review questions appear in the textbook (without answers) at the end of Chapter 8, and can be used
for a homework assignment or exam preparation. Answers to these questions appear in italic.
1. Identify the number of independent variables, the number of levels for each independent variable, and
the total number of conditions for each of the following examples of complex design experiments:
(a) 2 3 (b) 3 3 (c) 2 2 3 (d) 4 3
2. Identify the conditions in a complex design when the following independent variables are factorially
combined: (1) type of task with three levels (visual, auditory, tactile) and (2) group of children tested with
two levels (developmentally delayed, no delay).
3. Use the Kassin et al. results in Table 8.3 for interrogators= efforts to obtain a confession to show there
are two possible ways to describe the interaction effect.
4. Describe how you would use the subtraction method to decide whether an interaction effect was
present in a table showing the results of a 2 2 complex design.
5. Describe the pattern in a line graph that indicates the presence of an interaction effect in a complex
design.
6. Outline the steps in the analysis plan for a complex design with two independent variables when there is
an interaction effect and when there is not an interaction effect.
7. Use an example to illustrate how a complex design can be used to test predictions derived from a
psychological theory.
8. How is the external validity of the findings in a complex design influenced by the presence or absence of
an interaction effect?
9. Explain why researchers should be cautious about saying that an independent variable does not have
an effect on behavior.
10. Describe the pattern of descriptive statistics that would indicate a ceiling (or floor) effect may be present
in a data set, and describe how this pattern of data may affect the interpretation of inferential statistics
5
(e.g., F-test) for these data.
11. Explain how interaction effects in a complex design can be used as part of the solution to the problem of
drawing causal inferences on the basis of the natural groups design.
CHALLENGE QUESTIONS AND ANSWERS
1. Consider an experiment in which two independent variables have been manipulated. Variable A has
been manipulated at three levels, and Variable B has been manipulated at two levels.
A. Draw a graph showing a main effect of Variable B, no main effect of Variable A, and no interaction
effect between the two variables.
B. Draw a graph showing no main effect of Variable A, no main effect of Variable B, but an interaction
effect between the two variables.
C. Draw a graph showing a main effect of Variable A, a main effect of Variable B, and no interaction
effect between the A and B variables.
7
that flew randomly from all angles of the screen. The screen was split down the middle. Participants
were told one side of the screen represented their own game, and the second side represented the
game of another person playing in an adjacent room (fictitious). Participants could tap the spacebar on
the keyboard to move between their own game and the other player’s game, but their robot wouldn’t be
seen by the other player. Any balls they caught for the other player would simply disappear from the
screen (like other balls in the game). Midway through the playing time, the other player’s robot
appeared stuck on the far side of the screen. The dependent variable was how many balls the
participant caught for the other player as a measure of helping.
The researcher hypothesized that people are less likely to help when their attention is focused on
themselves. She reasoned that a fast game speed would require participants to focus on their own
game, so she manipulated participants’ game speed using two levels, fast and slow. The researcher
also predicted that participants would be less likely to help when given incentives to score high in their
own game (earn money for over 100 balls caught). She tested three levels of incentive: zero incentive,
$5, and $10. Twenty participants were tested in each condition of this complex design. The average
number of balls caught for the other player in each condition are presented below:
Incentive
Game Speed
Zero
$5
$10
Slow
14
10
4
Fast
4
2
1
A. Is there evidence for a possible interaction effect in this experiment?
B. What aspect of the results leads you to be cautious when interpreting an interaction effect, if one
were present in this experiment?
variable.
C. How could the researcher modify her experiment to be able to test for an interaction effect?
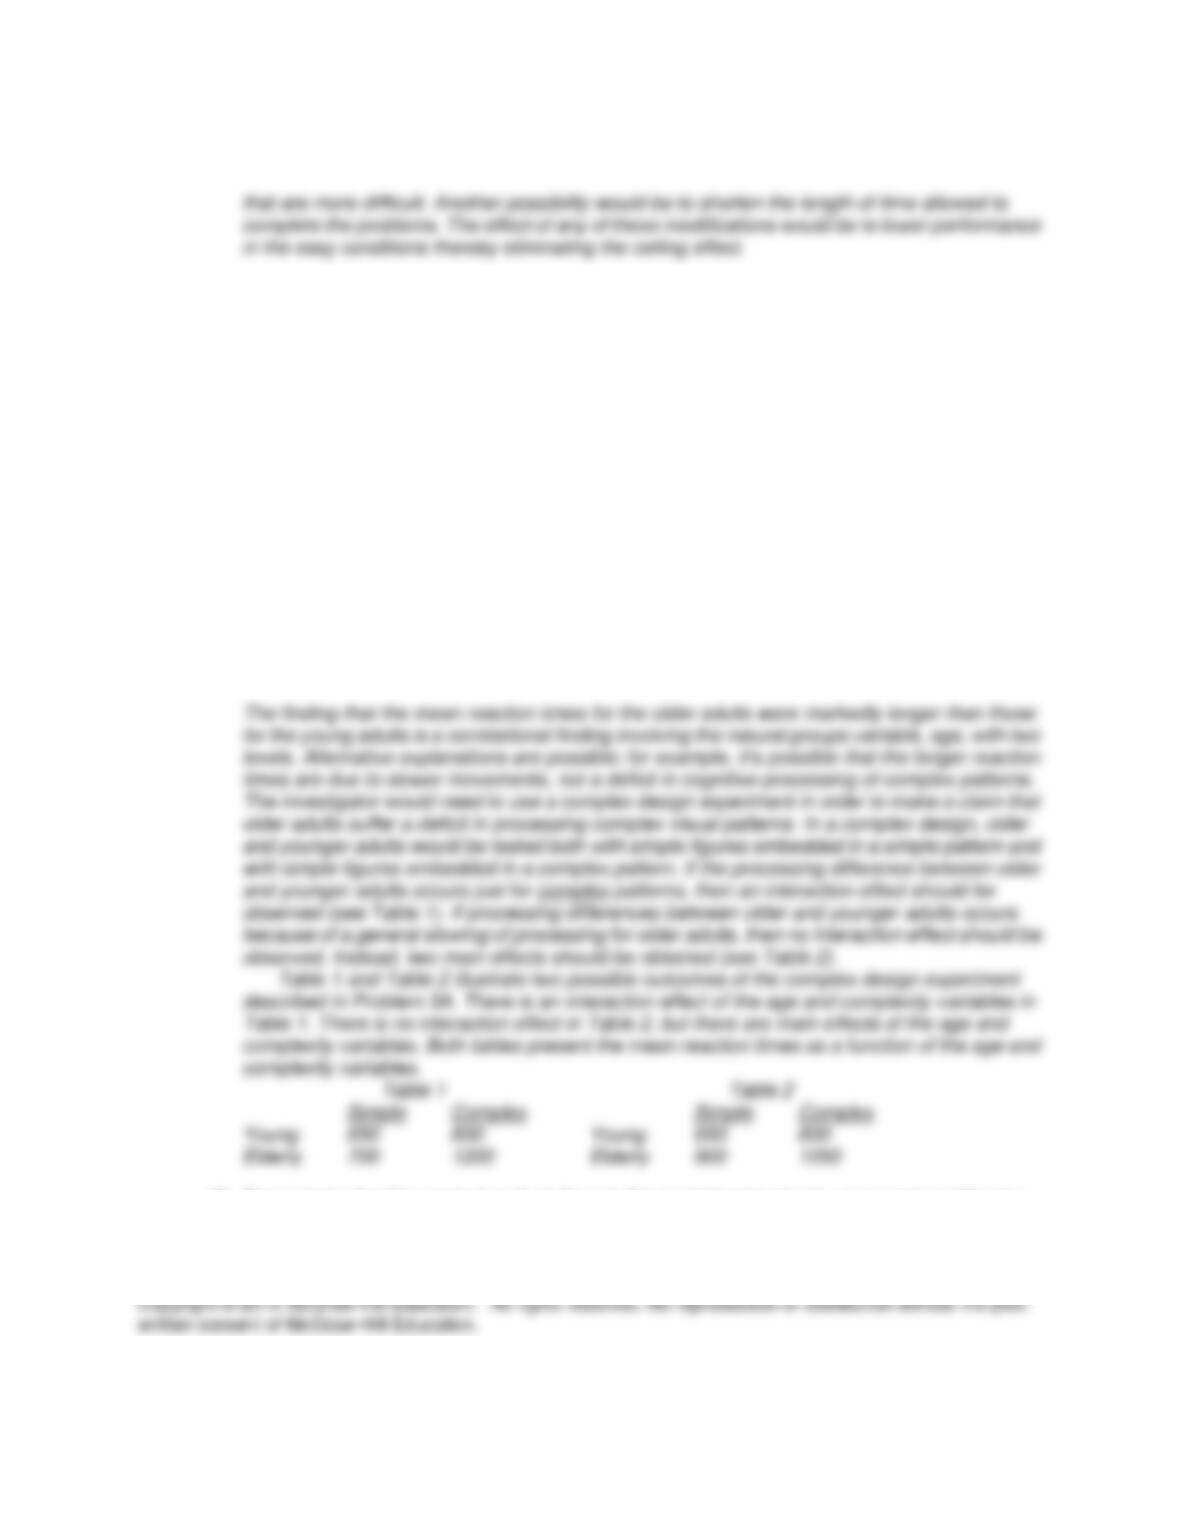
4. A psychologist hypothesized that older people take longer to process complex visual patterns. He
tested 20 older (ages 65-70) and 20 younger (ages 18-23) individuals using an embedded figures test.
In his procedure, a simple figure was displayed on a tablet screen, followed immediately by a complex
8
figure that contained the simple figure. Participants’ task was to locate the simple figure as quickly as
possible in each of 10 trials. When they found the figure, they tapped its location on the tablet. Results
indicated that average response times for finding the simple figure were longer for the older group than
the younger group. The difference was statistically significant.
A. The psychologist concluded that the difference in response times was caused by diminished ability
among older adults to process complex information. What information in this summary allows the
psychologist to make this causal inference? What information is lacking?
B. Another researcher hypothesized that older individuals prefer accuracy over speed (i.e., they make
sure they’re correct before responding), relative to younger adults. He added another independent
variable, reward, with two levels. Participants in the accurate condition were rewarded for accurate
judgments, and participants in the speed condition were rewarded for fast response times.
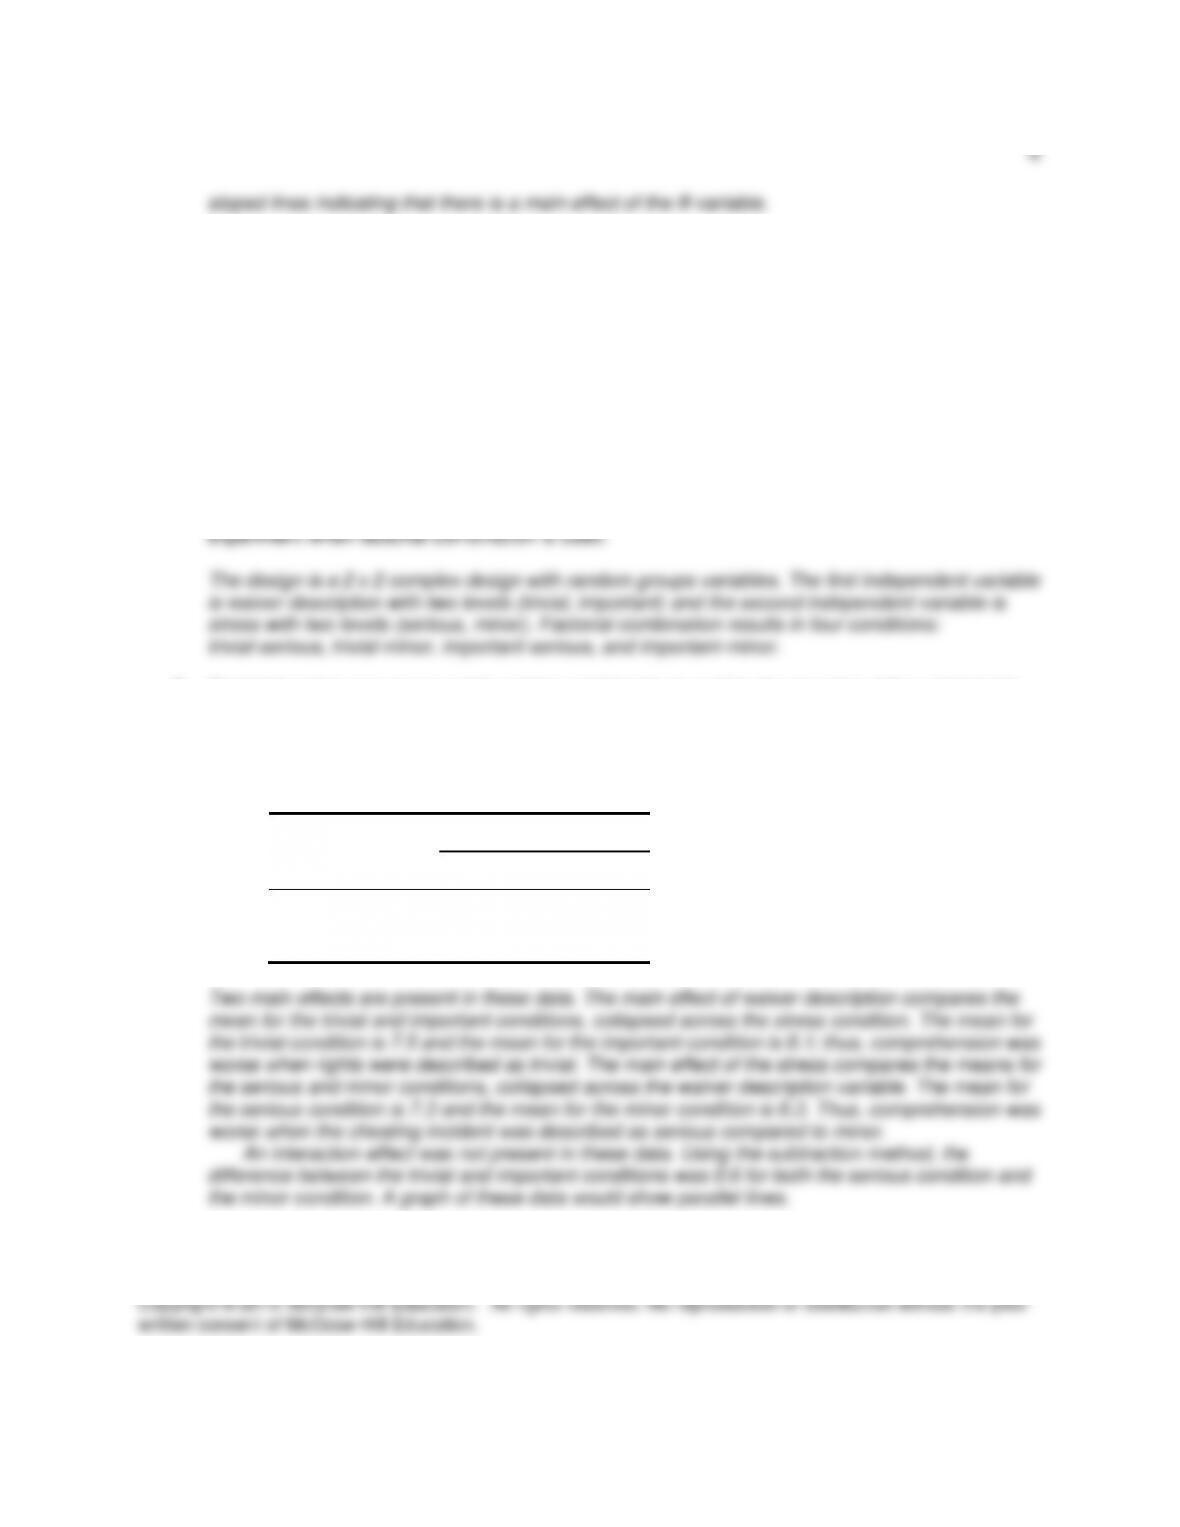
Describe the design of this experiment, including the conditions.
C. The dependent variable was the average response time (in seconds) for correct identifications.
What effects are present in the following data? (Assume equal cell sizes and non-zero differences
are statistically significant.) What do the results indicate about the second researcher’s theory?
Reward
Age Group
Accuracy
Speed
Young
16.0
10.0
Old
24.0
12.0
ISSUES AND PROBLEMS FOR CLASS DISCUSSION
1. Reading Research Critically
This research summary and the accompanying questions could be used in class for small group
discussion. The research summary and questions could be distributed to students in the class session
prior to the scheduled discussion to allow time for students to prepare answers, perhaps as a
homework assignment. NOTE: Answers to the questions for AReading Research Critically@ appear
below. The research summary and questions appear on subsequent pages to facilitate copying.
Answers to Reading Research Critically: Mimicry and Prosocial Behavior
A. Use factorial combination to identify the conditions in van Baaren et al.=s (2004) third experiment.
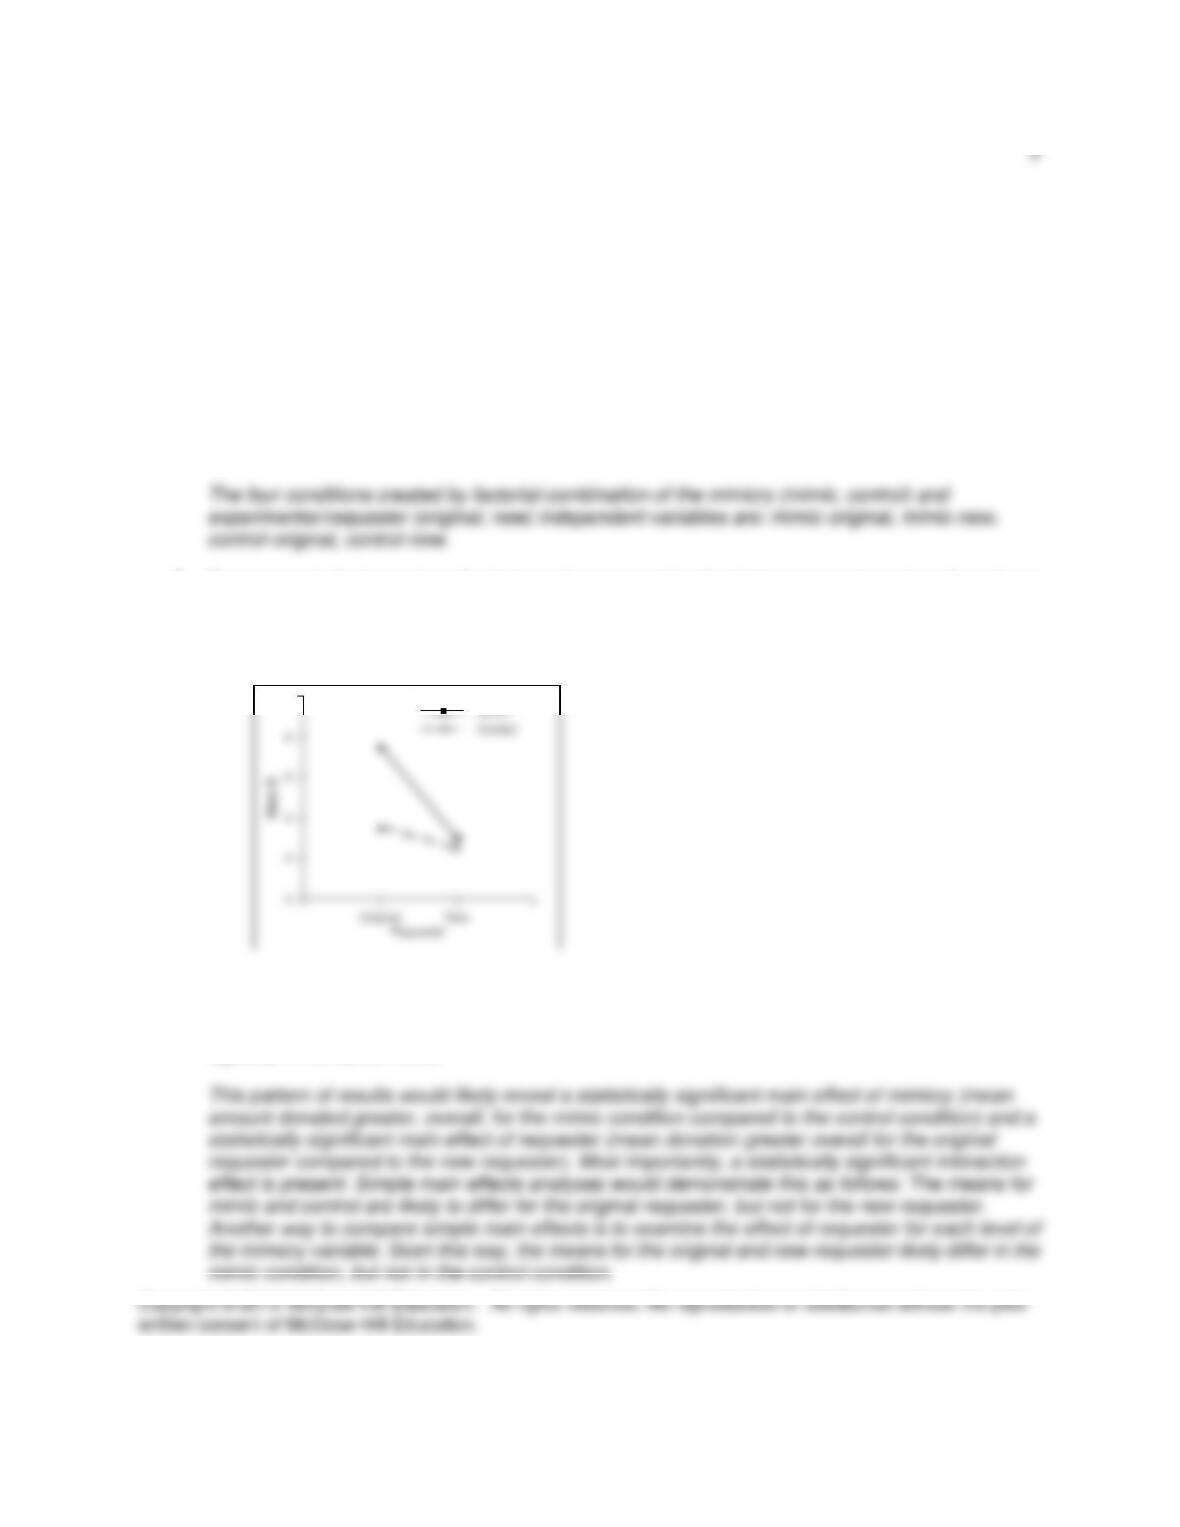
B. Draw a graph displaying hypothetical results observed for the third experiment as described above
(the values for the dependent variable aren’t required; simply assume greater amount of money
donated is higher on the axis).
C. Based on the description of the results and your graph in Part B, describe the effects you would
expect to be Astatistically significant,@ including the follow-up tests you would expect for any
significant interaction effect.
10
Mimic

10
Reading Research Critically
Read the following description of a research study to answer the questions that follow. This description is
based on an article by: van Baaren, R. B., Holland, R. W., Kawakami, K., & van Kippenberg, A. (2004).
Mimicry and prosocial behavior. Psychological Science, 15, 71-74.
Mimicry and Prosocial Behavior
Social psychologists have long been interested in factors that influence prosocial behaviorBthat is, actions
that benefit individuals and society, such as helping others in need. The purpose of three experiments by
van Baaren and his colleagues (2004) was to examine the role of mimicry, or copying another person=s
body movements. In each experiment, participants were interviewed individually by an experimenter and
the participant described his or her reactions to 10 advertisements (not the true purpose of the research).
One group of participants was randomly assigned to the mimicry condition, in which the experimenter
mimicked (copied) the participant=s posture, body orientation (e.g., leaning forward or backward), and arm
and leg positions during the interview. Participants randomly assigned to the control condition were not
mimicked. After the interview, the dependent variable was assessed. In the first experiment, the interviewer
Aaccidentally@ dropped six pens and then noted whether the participant helped by picking up the pens.
Results indicated that all of the participants in the mimic condition picked up the pens, whereas only 33% of
the participants in the control participants helped by picking up the pens. The researchers then sought to
determine whether these prosocial effects of mimicry would generalize to helping a different person. In their
second experiment they manipulated the same independent variable (mimic condition and control
condition), but after the interview a new experimenter entered the room and accidentally dropped pens.
Results replicated the findings for the effects of mimicry: 84% of participants in the mimic condition picked
up the new experimenter=s pens, compared to 48% of control participants.
In their third experiment, van Baaren et al. (2004) used a 2 2 complex design to manipulate mimicry with
the same two levels as in their first two experiments. They also manipulated in this design who requested
help, the original experimenter (interviewer) or a new experimenter who entered the room after the
interview. Thus, rather than manipulating this variable across two different experiments, as they did in
Experiments 1 and 2, they factorially combined this variable with the mimicry variable. The dependent
variable was different. After receiving payment for their research participation, participants were asked if
they were interested in donating any money to a children=s charity (by either the original experimenter or a
new experimenter). The dependent variable was the amount donated. Results of their study replicated the
effects of the first two experiments: (1) compared to a control condition, mimicry produced greater helping
and (2) helping was greater for the original experimenter compared to the new experimenter. Finally, the
pattern of means supported a possible interaction effect in which the effect of mimicry was greater for the
original experimenter than the new experimenter.
A. Use factorial combination to identify the conditions in van Baaren et al.=s (2004) third experiment.
B. Draw a graph displaying hypothetical results observed for the third experiment as described above (the
values for the dependent variable aren’t required; simply assume greater amount of money donated is
higher on the axis).
11
C. Based on the description of the results and your graph in Part B, describe the effects you would expect
to be Astatistically significant,@ including the follow-up tests you would expect for any significant
interaction effect.
2. More Challenges
These challenge questions can be used for class discussion or possible test questions.
A. A researcher has used a complex design to study the effects of training (untrained and trained) and
problem difficulty (easy and hard) on participants’ problem-solving ability. The researcher tested a
total of 80 participants, with 20 randomly assigned to each of the four groups resulting from the
factorial combination of the two independent variables. The data presented below represent the
percentage of the problems that participants solved in each of the four conditions.
Training
Problem Difficulty Untrained Trained
Easy 90 95
Hard 30 60
(1) Is there evidence of a possible interaction effect in this experiment?
(2) What aspect of the results of this experiment would lead you to be hesitant to interpret an
interaction effect if one were present in this experiment?
(3) How could the researcher modify the experiment so as to be able to interpret an interaction
effect if it should occur?
12
13
their reaction times are only slightly longer than the mean for the young adults. Explain how this
outcome would change the psychologist=s conclusion concerning the effect of age on reaction
time. Could the psychologist reach the general conclusion that older adults do not suffer a
deficit in reaction time in this task? Why or why not?
C. A doctor developed a simple training program to help people reduce stress. She wanted to
determine how the effectiveness of the training program was influenced by the length of time a
person spent in training and the severity of the person’s initial stress level. She decided to do an
experiment in which she selected people of high and of moderate stress level (50 of each). The
investigator knew of a reliable and valid measure of stress level; scores on the stress measure
ranged from 0 to 50. Ten people from each stress level were randomly assigned to different
numbers of hours of the training program: 1, 2, 3, 4, or 5 hours. The data in the following table
represent the mean stress scores following training for each of the 10 groups.
Hours of Training
Stress Level 1 2 3 4 5
Moderate 25 15 10 5 5
High 40 30 20 10 5
(1) Which designs were used in this experiment for the Stress Level variable and for the Hours of
Training variable?
(2) Is there evidence of an interaction effect in this experiment?
(3) What means would you use to describe the main effect of the Stress Level variable?
(4) Is there any reason why you might be hesitant to interpret the interaction effect in this
experiment?
D. An investigator selected two groups of people; one group included obese individuals and the other
group included people who were underweight. To each group he displayed a series of pictures
showing various servings of food on a plate. Each picture was shown for a brief period of time, and
the participant was required to make a judgment about how much food was shown in each picture.
The obese participants consistently underestimated the amount of food shown, whereas the
underweight participants consistently overestimated the amount of food shown. At least one other
set of judgments should have been obtained before the investigator could begin to tie the
judgments of the amount of food to a person=s weight. What are those judgments and why should
they be taken?
E. An experiment was done on vocabulary learning in which there were two independent variables.
Each of 96 introductory psychology students was asked to learn 20 unfamiliar English vocabulary
words. Participants studied the vocabulary words either with a familiar synonym (Synonym
condition), with a dictionary definition (Definition condition), with a literary passage in which the
word was used correctly (Passage condition), or without any accompanying information (Control
condition). In addition, half the participants were asked to write sentences using the new words
during study (Active Processing), while the other half simply studied without writing (Passive
Processing). Thus, there were 8 groups of 12 participants in this 4 2 design. Participants were
randomly assigned to the eight groups. The mean number correct (out of 20) for each group on the
final vocabulary test is shown in the following table.
Study Condition
Processing Control Passage Definition Synonyms
Active 9.5 13.0 16.0 14.0
Passive 10.5 13.5 15.0 13.5
(1) The overall analysis of this experiment revealed that there was not a statistically significant
interaction effect between type of processing and study condition. In light of this information,
describe the analysis plan you would use to analyze further this experiment. Be sure to explain
why you would do the analyses you propose. Your analysis plan should include at least one
comparison of two means.
significant. Comparisons of means considered two at a time would not be required after testing

16
LEARNING BY DOING RESEARCH
One of the most satisfying experiences in teaching research methods is to see students develop and use
their research skills by doing research projects. It is especially satisfying when students recognize at the
end of the course that they are completing research projects that they would not have been able to do prior
to taking the course.
One good assignment to help students recognize how far they have come in the course is to ask students to
present a poster describing a research proposal they have developed. The handout we give to students
describes the nature of the assignment. The handout appears immediately after this introduction to the
assignment.
The poster session can take place at the scheduled time for the final exam. We describe the assignment to
students about 3-4 weeks prior to the time when the poster session is scheduled. Students need to have
completed Chapter 8 before they can work on this assignment because their proposed experiments must
involve a complex design. The last two sessions of the class are devoted entirely to the preparation of the
students’ proposals. During the time of the second-to–last class the instructor meets individually for 10-15
minutes with each pair of students who are working together on a proposal. These meetings have been
previously scheduled. During the last class session students have time to work away from class on their
posters. At the poster session each student is assigned to read the posters of three other students. For
each poster, the student completes the evaluation sheet that appears at the end of the handout describing
the poster assignment. With this system, each pair of students who wrote a poster together receive
feedback from six of their fellow students. The poster session typically lasts about 40-50 minutes. The
poster session brings closure to the class with a much different feeling than is the case when the class ends
with a final exam. The handout presented next describes one way to structure the writing of a research
proposal that is presented in poster format.

17
Guidelines for Preparing APA Poster
Often when researchers conduct studies they answer their original questions but they also create new
questions. Researchers do not usually conduct isolated studies. Their investigations form part of a research
program that is typically based on the study of a particular issue, phenomenon, or theory. The research
program involves a series of studies that are connected to each other.
As part of your concluding experience in the research methods class, we want you to explore how studies
develop from previous ones, giving you a sense of the continuity of a research program. Thus, your final
assignment involves exploring questions left unanswered by previous research. You need to write a poster
in which you present your questions, describe how you would go about answering them, and discuss what
you expect to find and what conclusions you would draw if you found what you expect. Basically this
means you will be writing a proposal for a future experiment. Your proposed experiment will very likely be a
partial replication of a previous experiment.
This assignment will be done by pairs of students. The poster should be typed using a slightly larger than
normal font. You will display the pages of your poster on tack boards like those used at psychology
conventions. Your poster should include a title and the names of the authors. You want to make it attractive
and easy to read so that people will want to learn about your work. Your poster should include an
introduction, a method section, and an expected results and conclusions section. Your experiment must be
a complex design.
I. Introduction. You may design your complex design experiment based on studies we=ve conducted in
the course, or on research described in class and in the textbook. You may also explore a topic of
interest to you or a study you learned about in your other course work, although you will have to do
more extensive literature review to prepare your introduction if you choose a research area not
addressed in this course. [If you choose this option you need to identify a journal article and not just a
secondary source (e.g., textbook) for a reference.] Whichever option you select as the basis for your
experiment, you need to identify questions left unanswered, or issues that were not addressed in the
previous research. Then you need to summarize your thoughts regarding the question or issue of
interest, and provide a rationale for why this is important to study. You need to clearly state the design
of your study, including the independent and dependent variables, and your predictions or hypotheses.
Your introduction should be no more than two pages.
II. Method. Once you have identified your question, you need to decide how you would test your idea. How
could you go about answering your question? In other words, you need to decide on a method to
investigate your question. You need to decide what type of participants you would need, what type of
materials, and what procedure you would use. As in most research programs, you will likely base your
method on the methods used in prior research. You need to summarize your method in 1-2 pages; you
need to describe the design, participants, materials and procedure you will use.
III. Expected Results and Conclusions. You need to have a clear idea of what you expect to find, for
example, which groups will differ and how will they differ. You should present this information either in a
table or in a figure. You will need to indicate in your poster whether your results involve an interaction
effect and you should follow the analysis plan appropriate to your expected results. Your poster
concludes with a brief statement of the conclusions and implications of your findings.
Your poster should have a title page and not more than 6 text pages. You will likely need at least 4 text
pages. Results from studies are often presented at conferences using the poster format. People walk