
Chapter 09 – Short-Term Profit Planning: Cost-Volume-Profit (CVP) Analysis
9-48 (Continued-4)
The above data table provides the results of a sensitivity analysis.
Specifically, we are looking at the sensitivity of the breakeven point to
the assumption regarding sales mix for the two products. Based on the
above results management will form a judgment as to the sensitivity of
the B/E point to changes in the sales mix. The greater the perceived
sensitivity, the greater the uncertainty in the calculations (and therefore
in the CVP model). Given greater uncertainty, management may invest
resources to provide a more refined estimate of sales mix.
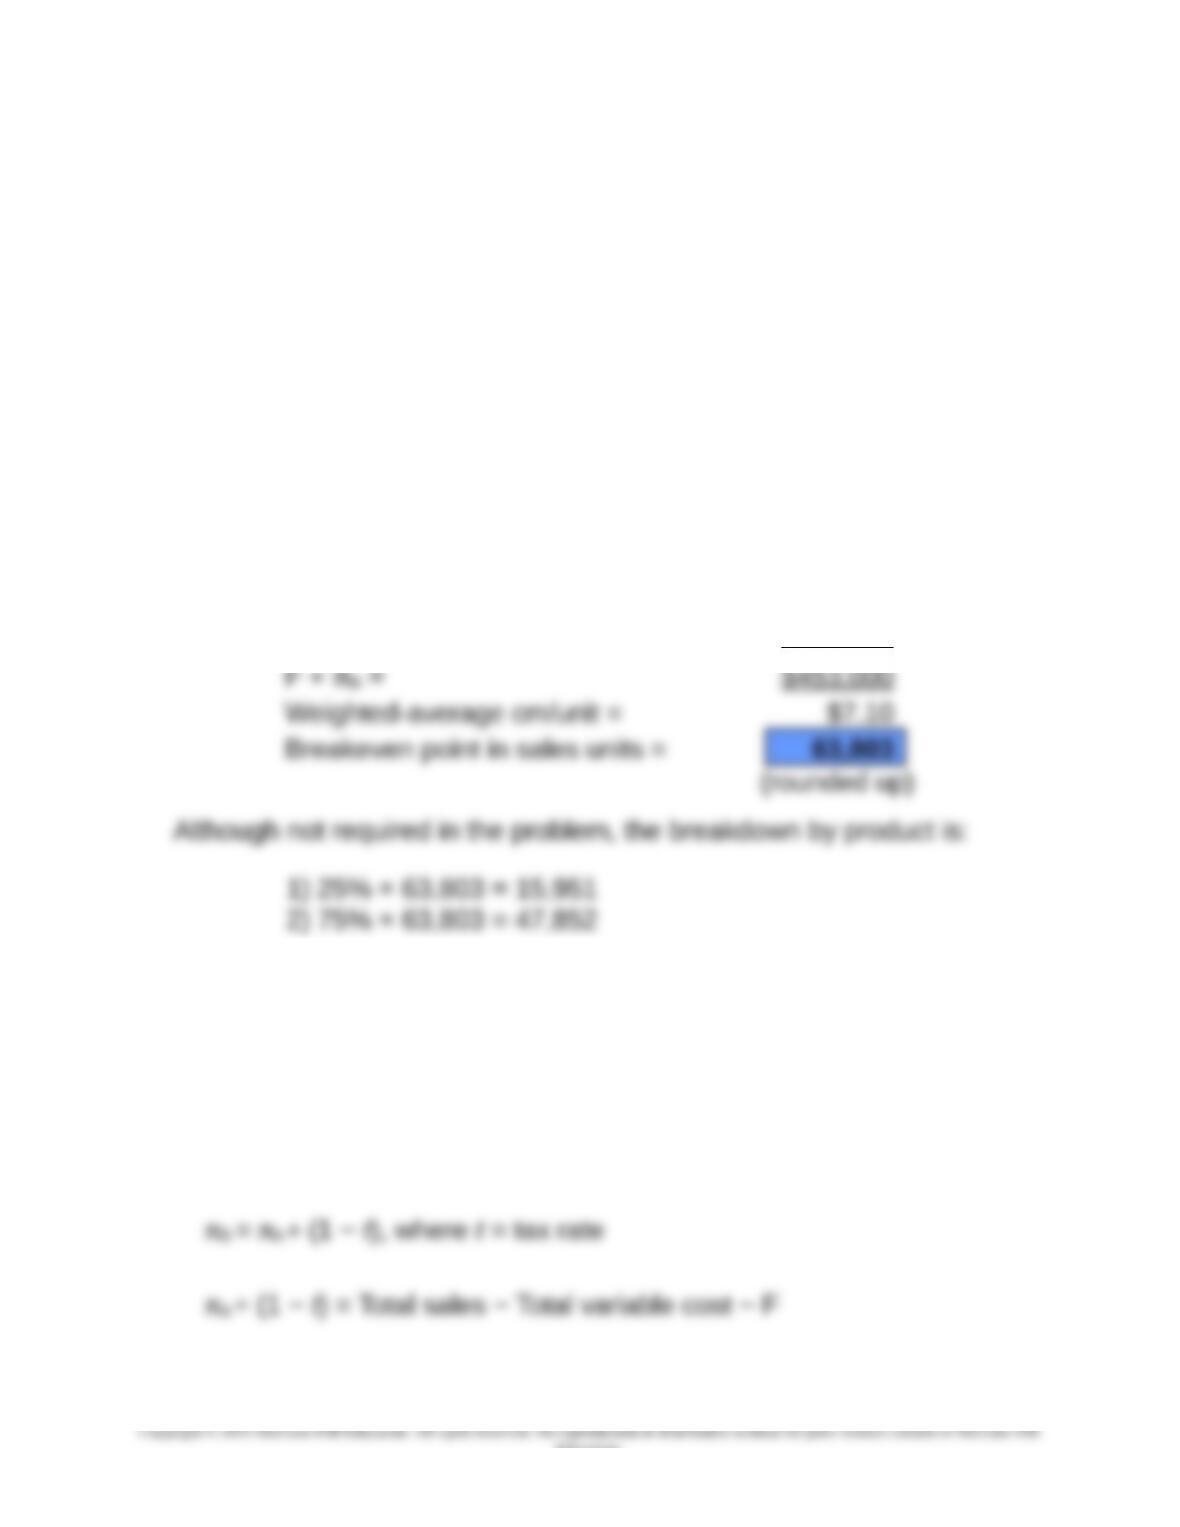
6. Given the assumed sales mix (25%:75%), the required sales volume (in
total units) to generate a before-tax profit, πB, of $ 75,000 is 63,803 units
(rounded up):
Targeted before-tax profit target, πB = $75,000
Fixed Costs (F) = $378,000
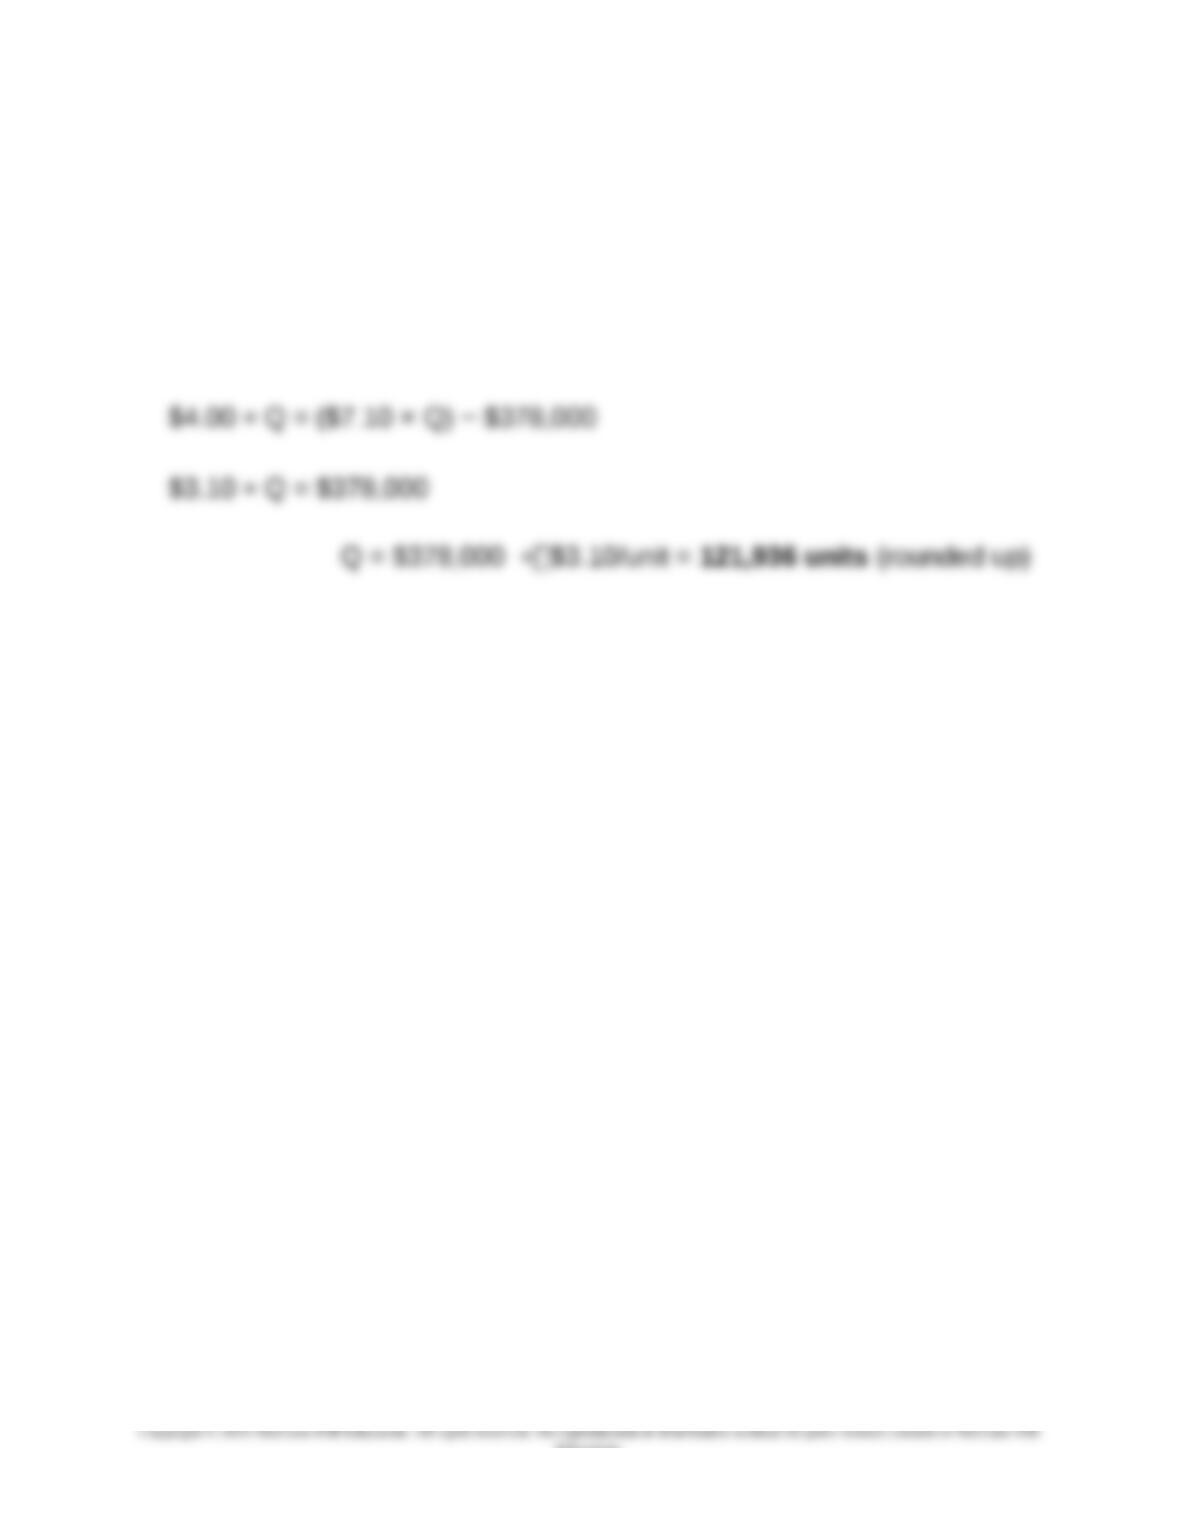
7. Given the assumed sales mix, what is the required sales volume (in total
units) to generate an after-tax profit, πA, equal to 10% of sales dollars?
Let Q = the required sales volume (in units) to achieve the profit objective
πB= Total sales − Total variable cost − Total fixed cost (F)
9-48 (Continued-5)
9-70
Education.
Chapter 09 – Short-Term Profit Planning: Cost-Volume-Profit (CVP) Analysis
(0.10 × (sp/unit × Q)) ÷ (1 − t) = Total contribution margin − F
(0.10 × (sp/unit × Q)) ÷ (1 − t) = (cm per unit × Q) − F
(0.10 × $28.00/unit × Q) ÷ (1 − 0.30) = ($7.10 × Q) − $378,000
8. The point of this question is to get the students started thinking about the
competitive context in which the firm operates. There are many different
relevant points that could be made. If the discussion is slow to start, ask
them to think about what a firm like HPC must do to be competitive.
There are a number of critical success factors that are likely to be
important for both domestic and foreign subscriptions. These would
include quality of presentation and timeliness and accuracy of
information, as well as competitive price. However, other factors will differ
across countries. For example, in some countries the cost of distribution
including selling and handling costs are quite high, so that it is critical in
these countries to devise new ways to deliver the subscriptions profitably.
Other factors include changes in literacy rates, the business climate, and
investment opportunities in different countries.
9-71
Education.
Chapter 09 – Short-Term Profit Planning: Cost-Volume-Profit (CVP) Analysis
9-49 CVP Analysis; Strategy; Sensitivity Analysis (75-90 min)
1.
Current Proposed
Selling price per unit $600.00 $600.00
Less: variable cost per unit:
Materials and purchased parts 180.00 195.00
Direct labor 55.00 62.50
Variable overhead 70.00 80.00
Variable GSA per unit 25.00 25.00
Total variable cost per unit $330.00 $362.50
Contribution margin per unit (CM) $270.00 $237.50
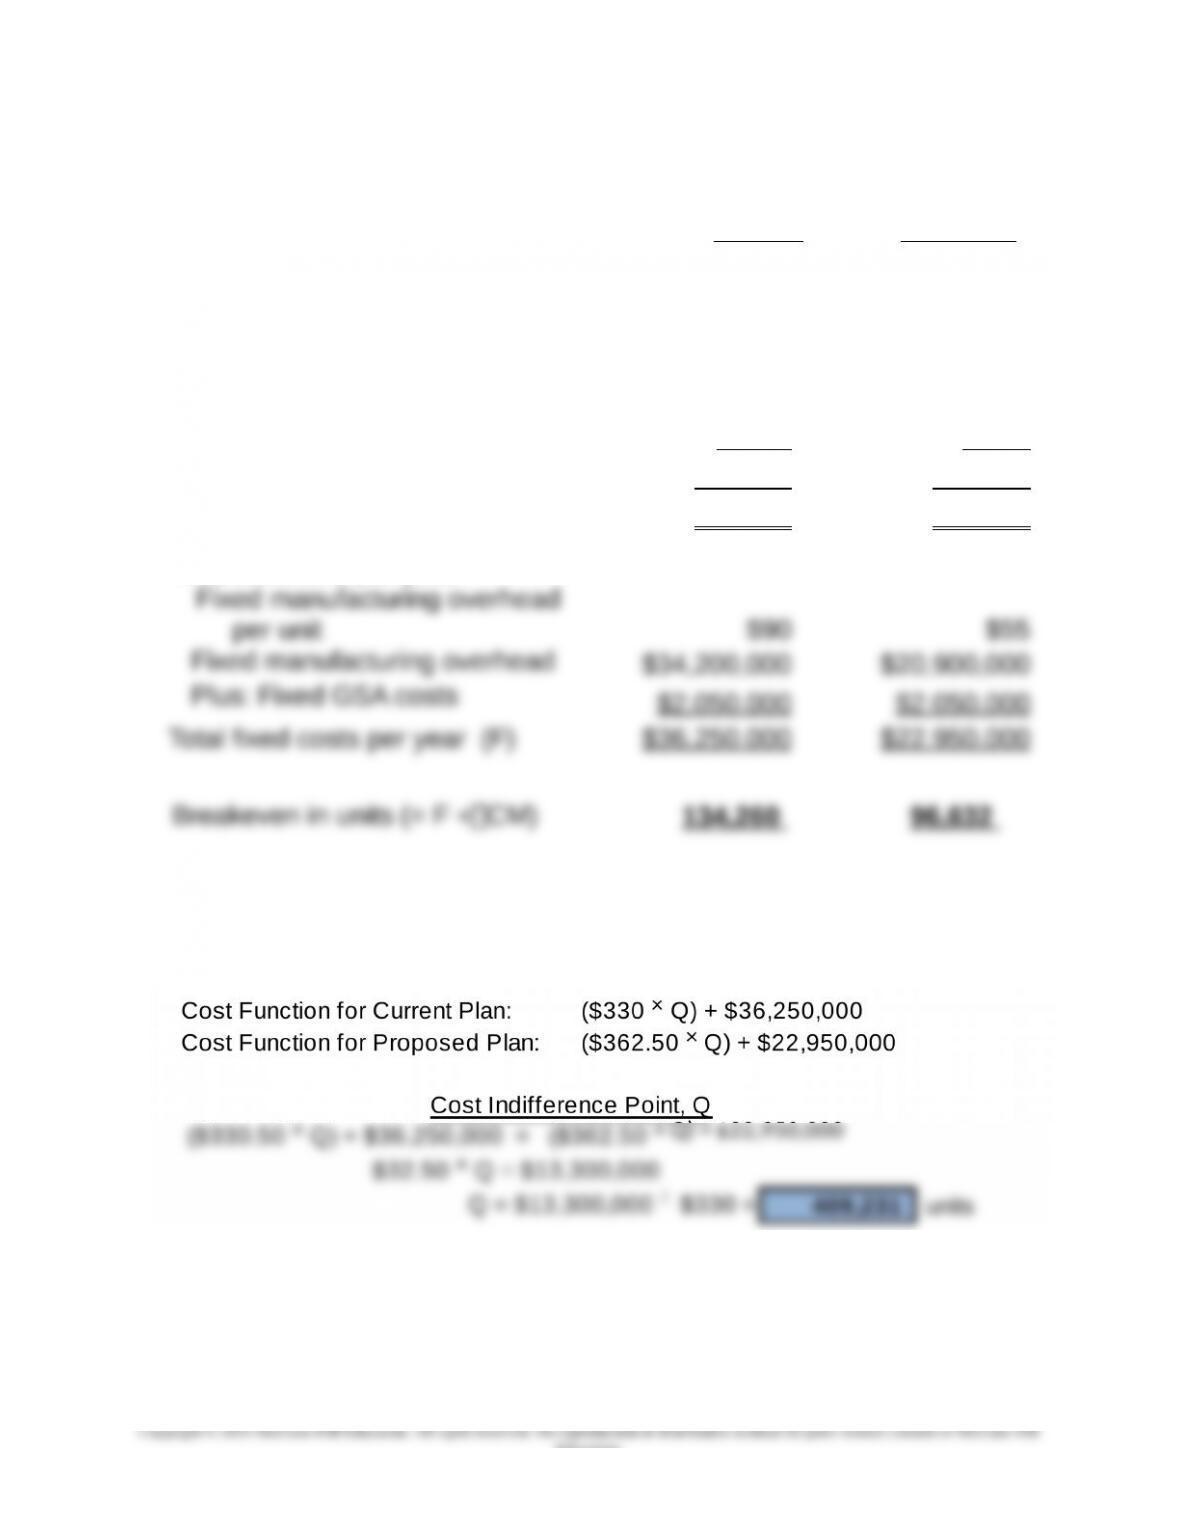
Total fixed cost per year:
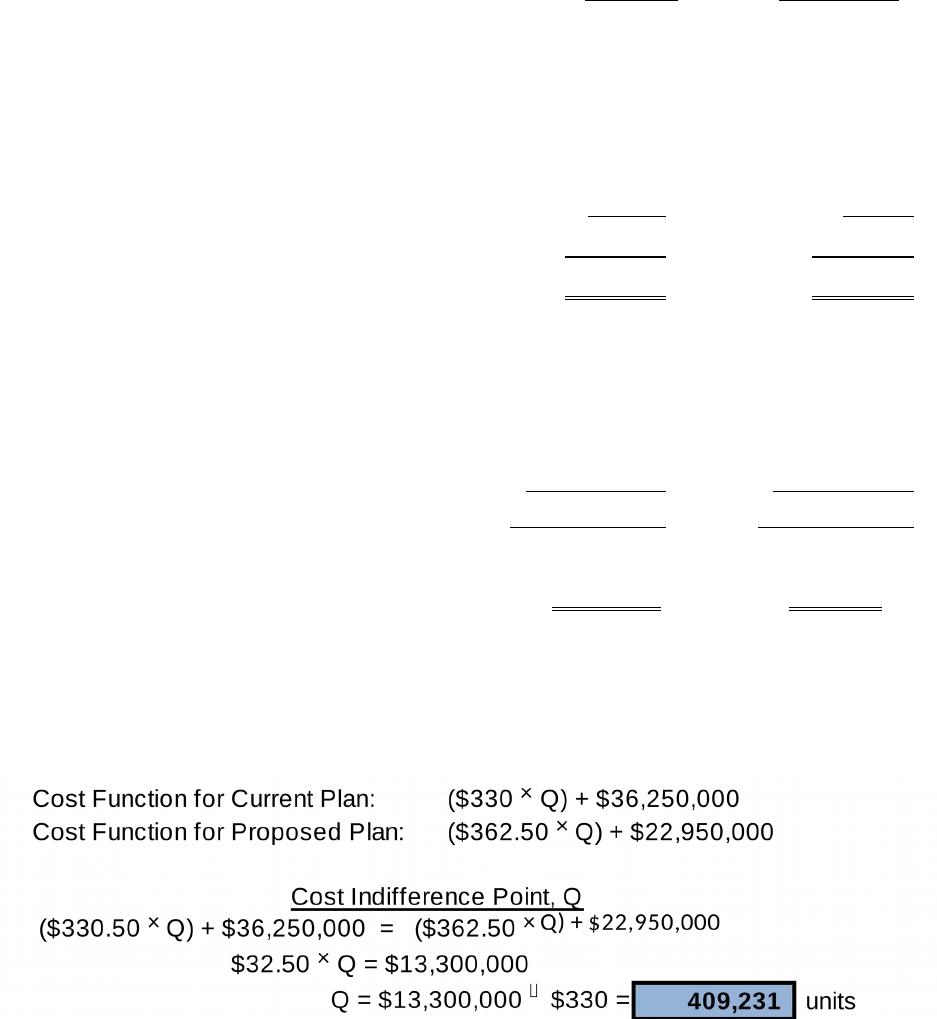
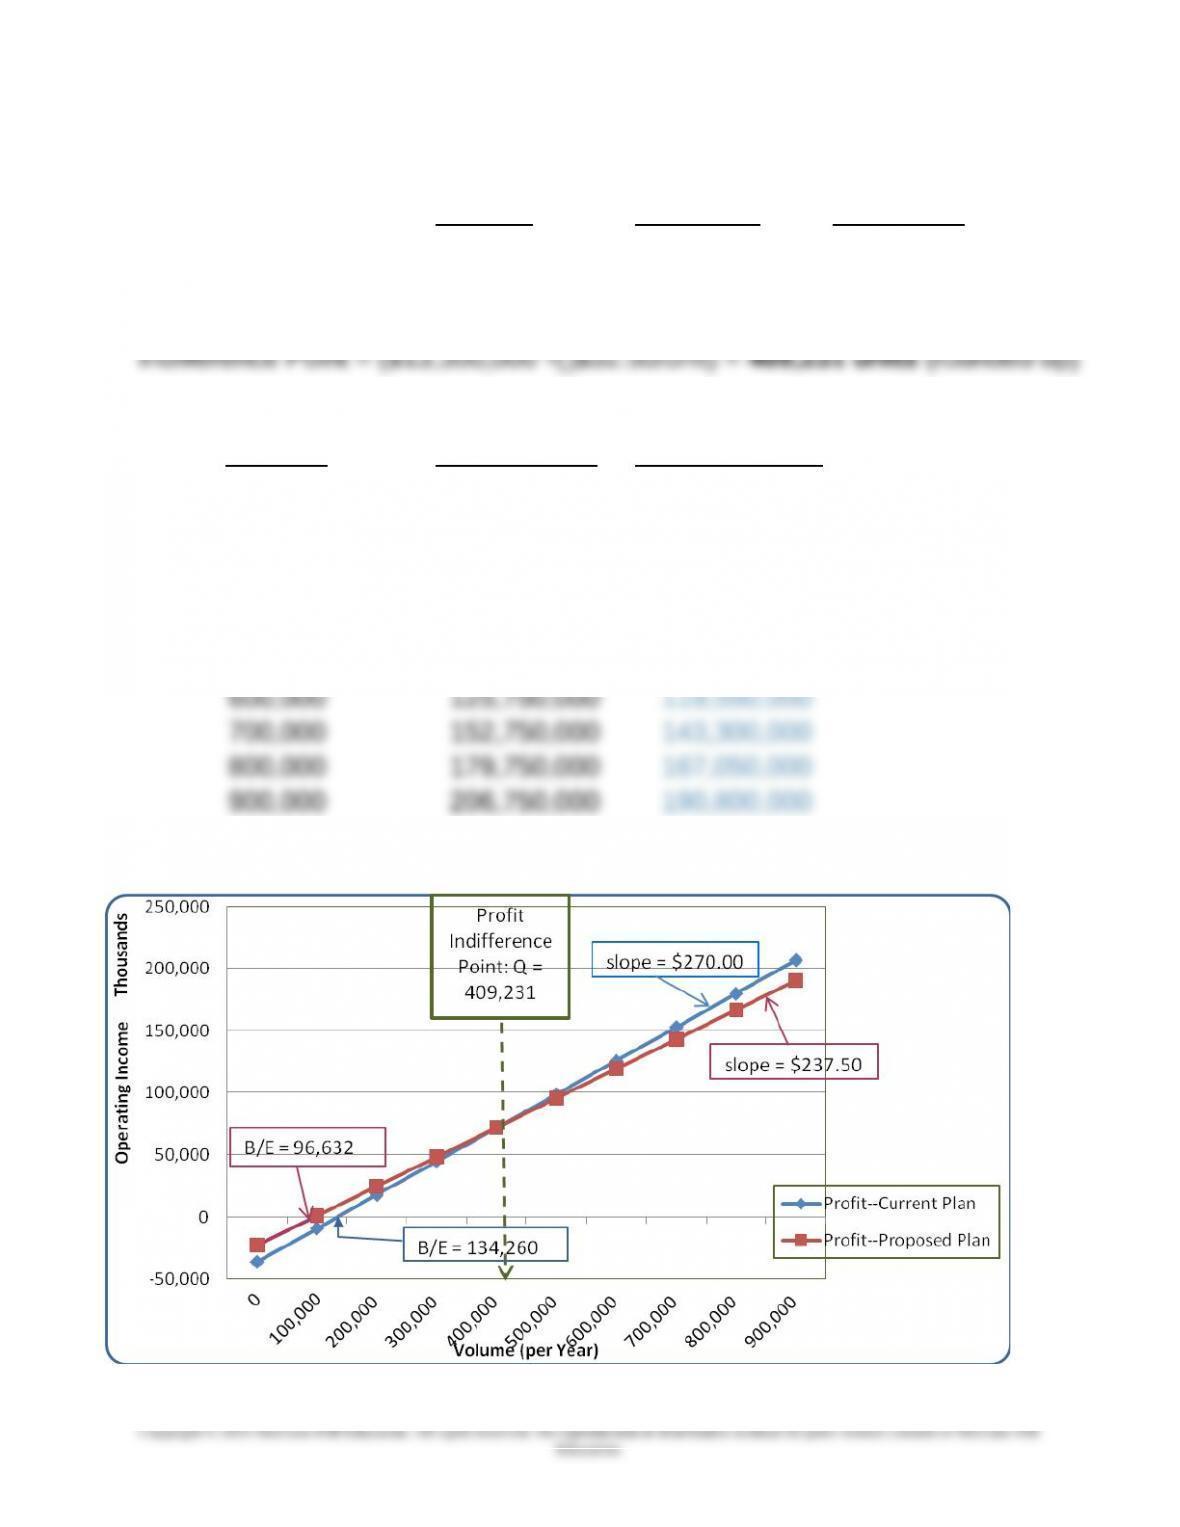
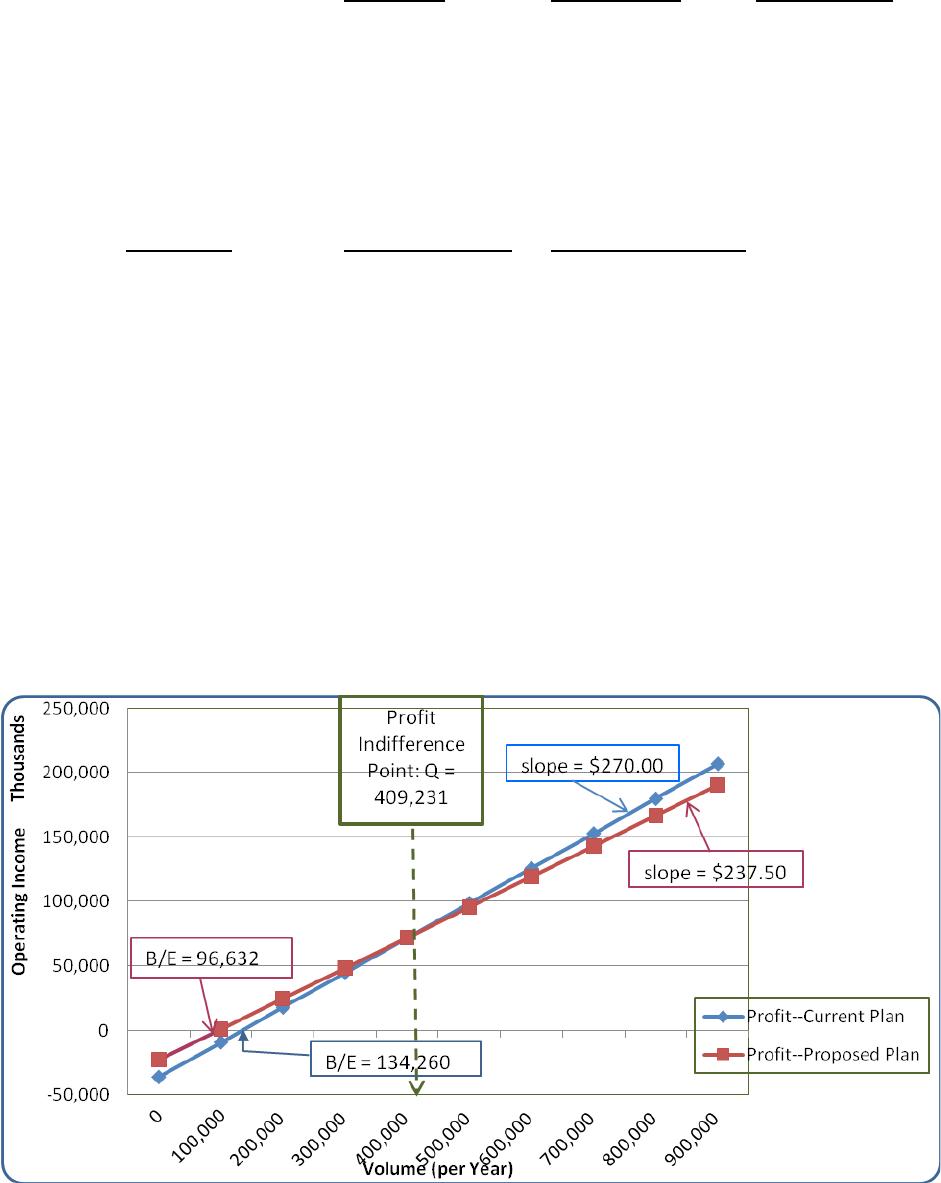
2. Indifference Point Calculation: the indifference point, in terms of cost, is
defined as the volume level (Q) in which total cost is the same for both
production options, as follows:
The above calculation shows that at the current level of 380,000 units,
the firm would prefer the low-fixed-cost strategy (i.e., the proposed
plan)
9-72
Education.
Chapter 09 – Short-Term Profit Planning: Cost-Volume-Profit (CVP) Analysis
9-49 (continued-1)
3. a) SolarFlex’s strategy is best described as differentiation, since the firm
has succeeded by innovation in product design. Further, the firm
operates in an industry in which innovation and product design are
critical to success. An important element of the firm’s strategy is also
the fact that the technology, as for many firms in the industry, is not
proven. That is, there is a significant level of risk that the firm’s
b) The calculations in part 2 above support a decision to go to the new
plan; at the current level of 380,000 units, costs are lower for the new
plan, and will continue to be lower for the new plan as long as volume
stays below 409,231 units.
Strategically, the new plan is preferred since it is an appropriate
response to the firm’s risk, as noted in part a above. By reducing
operating leverage (that is, by reducing manufacturing fixed costs
from $34,200,000 to $20,900,000) the firm is less exposed to a
possible failure of the innovation and then drop-off in sales. The
reduction in fixed costs also helps the firm to manage cash flows.
Thus, the new plan is more consistent with the firm’s strategy of
Sensitivity analysis. Since uncertainty is important in this case,
SolarFlex should use some of the tools as illustrated below. Note that
the proposed method is preferred if projected demand increases.
9-73
Chapter 09 – Short-Term Profit Planning: Cost-Volume-Profit (CVP) Analysis
9-49 (continued-3)
Current Proposed Difference
CM $270.00 $237.50 $32.50
Fixed Cost $36,250,000 $22,950,000 $13,300,000
Assumed Levels of
Demand Profit-Current Profit-Proposed
0 -36,250,000 -22,950,000
100,000 -9,250,000 800,000
200,000 17,750,000 24,550,000
300,000 44,750,000 48,300,000
400,000 71,750,000 72,050,000
500,000 98,750,000 95,800,000
4. Excel Charts (P-V function for each of the two decision alternatives)
9-74
Chapter 09 – Short-Term Profit Planning: Cost-Volume-Profit (CVP) Analysis
9-49 (continued-4)
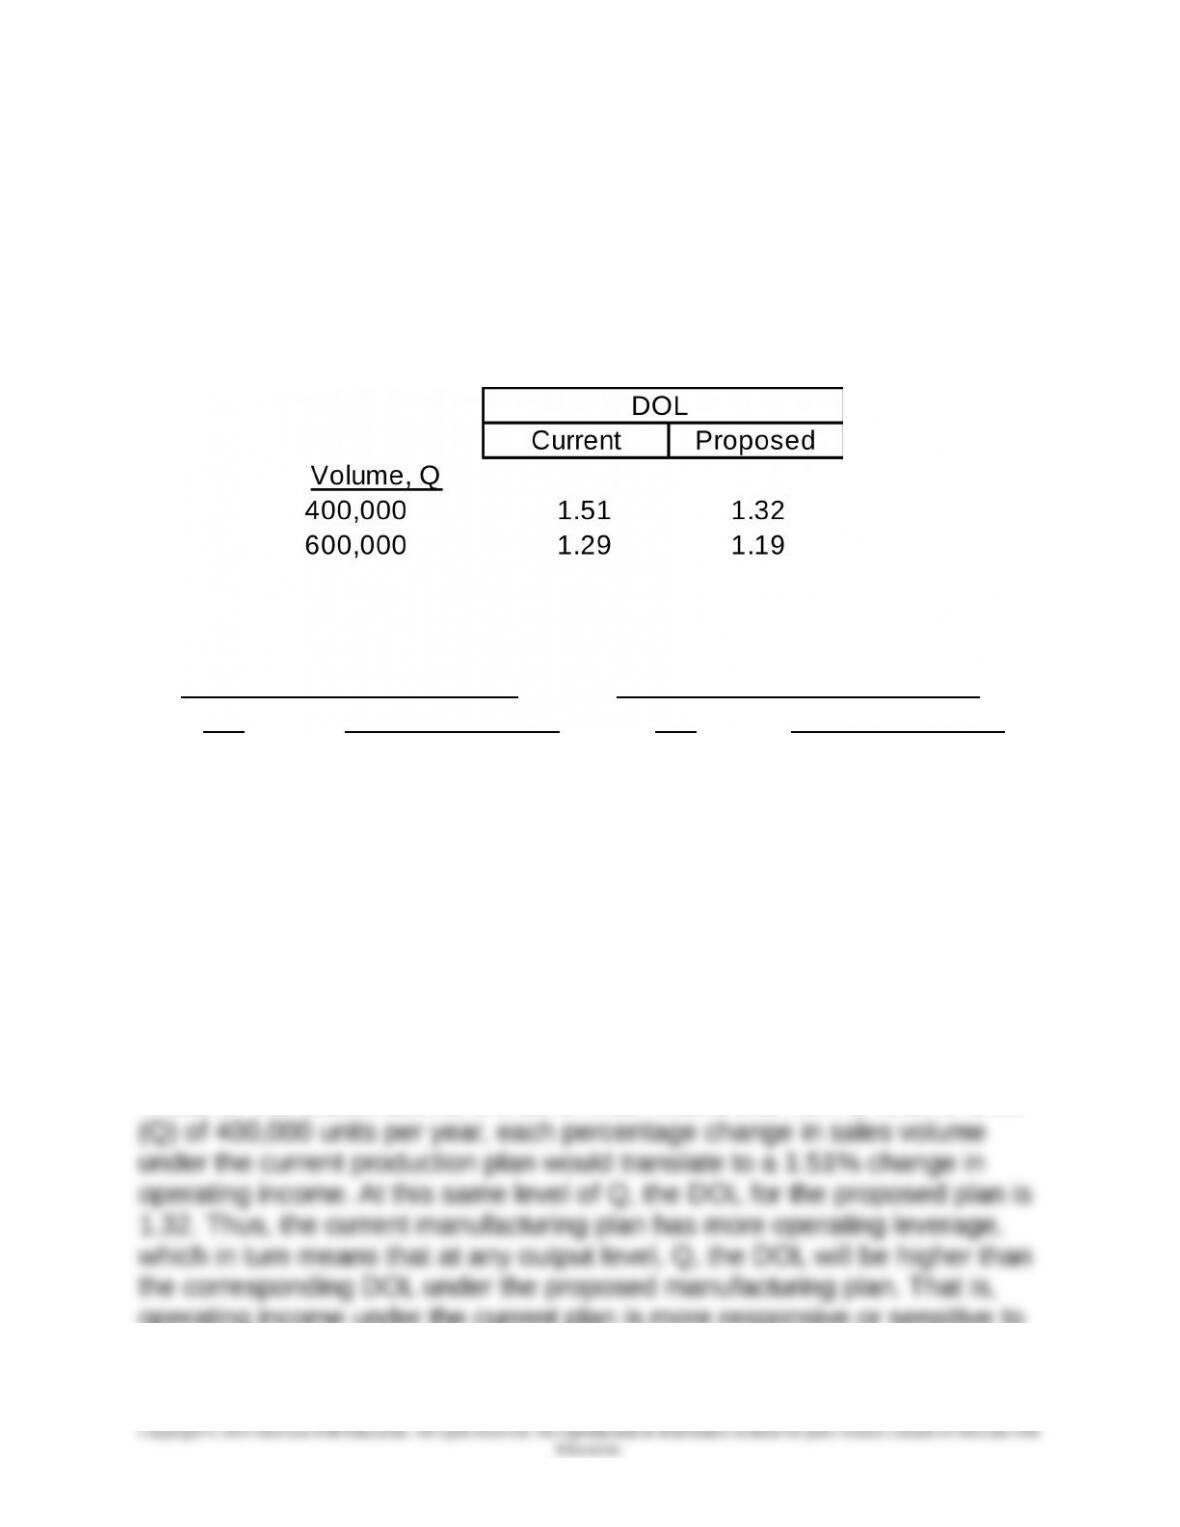
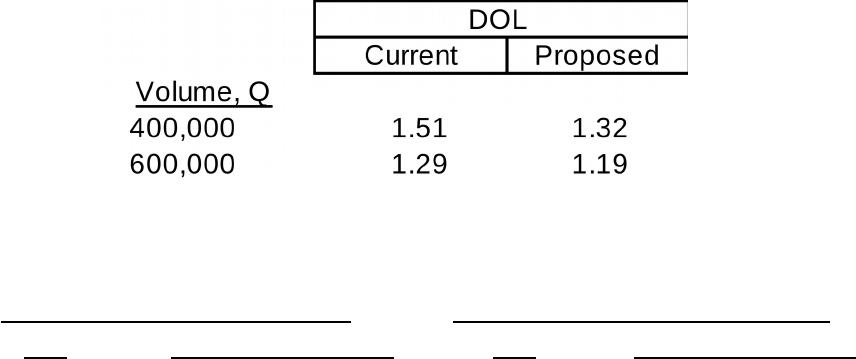
5. Calculation and interpretation of degree of operating leverage (DOL)
under each decision alternative at Q = 400,000 units and at Q = 600,000
units.
DOL, at any volume level, Q = CM ÷ Operating Income
Backup information for DOL calculations:
DOL Components (Current) DOL Components (Proposed)
CM Operating Income CM Operating Income
$108,000,000 $71,750,000 $95,000,000 $72,050,000
$162,000,000 $125,750,000 $142,500,000 $119,550,000
Operating leverage refers to the extent to which fixed costs characterize an
organization’s cost structure. The greater the fixed costs, the greater the
operating leverage and the more sensitive or responsive profits are to
changes in sales volume.
A measure of the extent to which profits vary in response to changes in
sales volume is the degree of operating leverage (DOL). DOL represents
the percentage change in operating profit per percentage change in sales.
Thus, for the results above, a DOL of 1.51 means that from a volume level
operating income under the current plan is more responsive or sensitive to
9-75

Chapter 09 – Short-Term Profit Planning: Cost-Volume-Profit (CVP) Analysis
9-49 (continued-5)
changes in sales volume. Relative to the proposed plan, the current plan
would generate greater percentage reductions in operating income if sales
volume declines, but greater percentage increases in operating income in
response to increases in sales volume. In this sense, the operating risk
associated with the current plan is greater than the operating risk
associated with the proposed plan.
9-76
Education.

Chapter 09 – Short-Term Profit Planning: Cost-Volume-Profit (CVP) Analysis
Problem 9-50: CVP Analysis; Sustainability; Uncertainty; Decision Tables
(60-75 min)
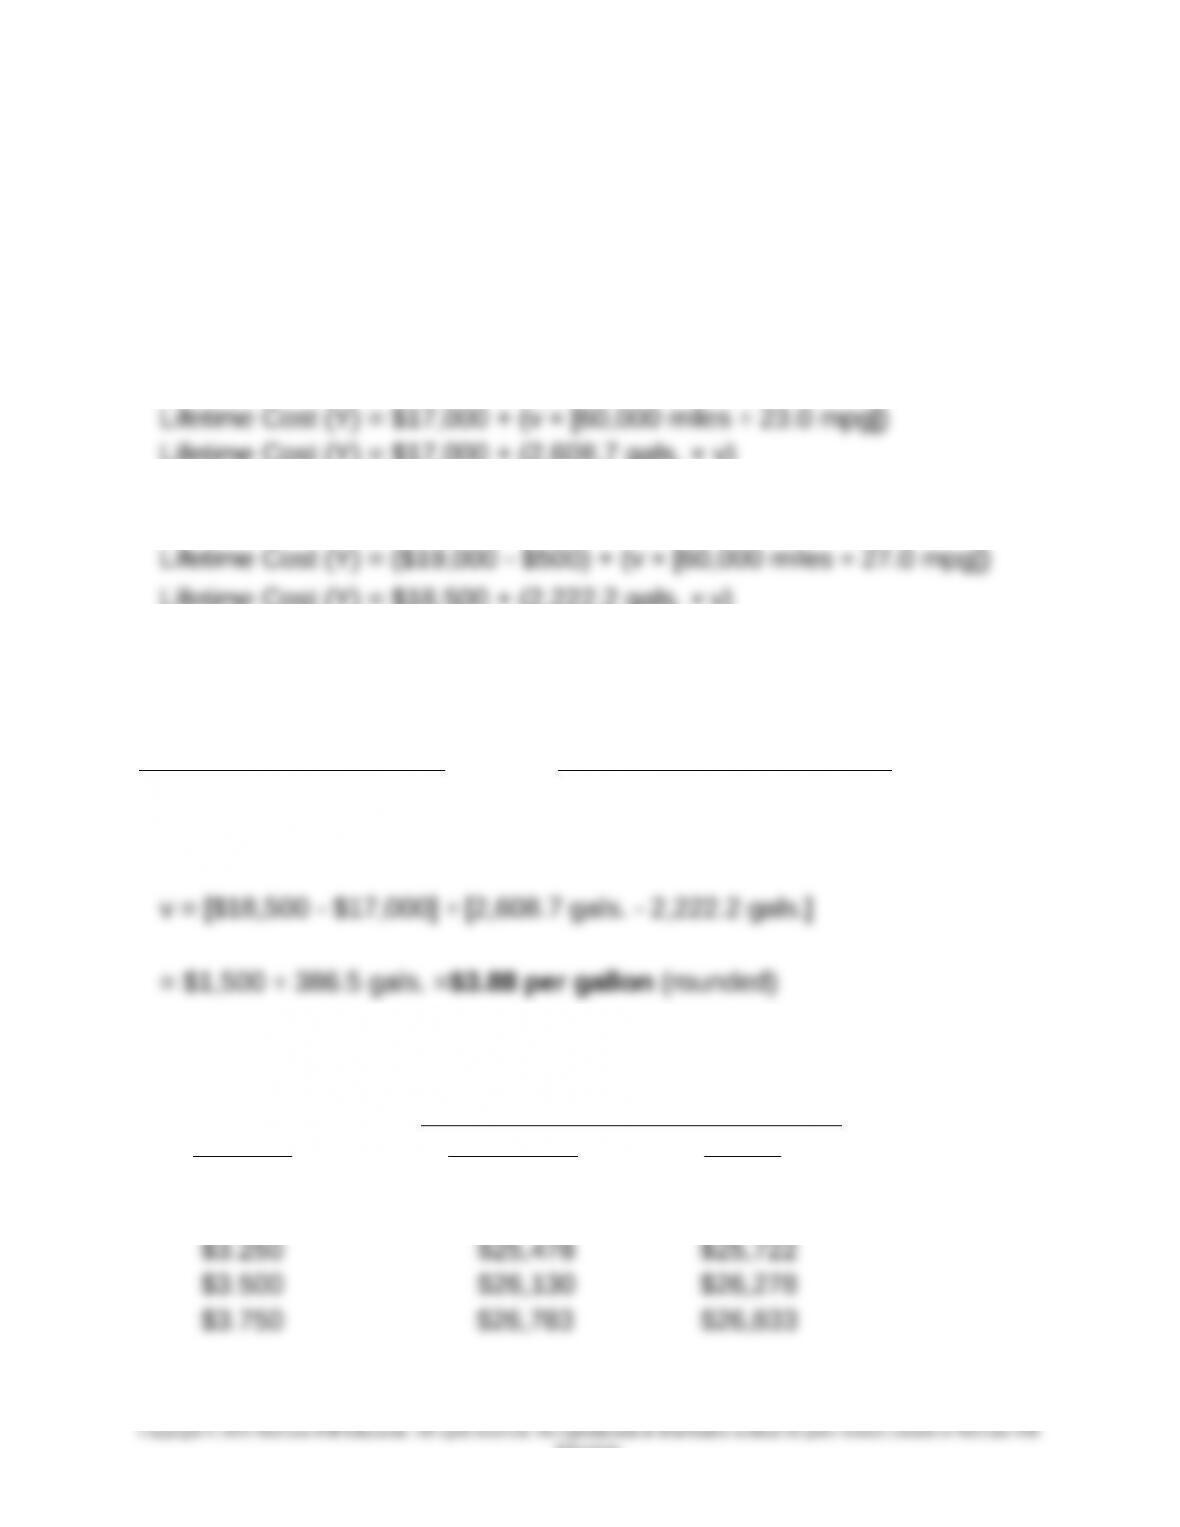
1. Lifetime cost functions: let Y = lifetime cost, and v = cost per gallon of
gas
Regular model:
Lifetime Cost (Y) = Fixed Cost + Variable Cost
Lifetime Cost (Y) = $17,000 + (2,608.7 gals. × v)
Hybrid model:
Lifetime Cost (Y) = Fixed Cost + Variable Cost
Lifetime Cost (Y) = $18,500 + (2,222.2 gals. × v)
2. Breakeven gas price (point of cost indifference): let “v” = breakeven price
per gallon
Lifetime Cost–Gas Model = Lifetime Cost–Hybrid Model
$17,000 + (2,608.7 gals. × v) = $18,500 + (2,222.2 gals. × v)
3. Graph of Lifetime Cost Function–Regular and Hybrid Models
X (price Lifetime Cost
per gal.) Gas Model Hybrid
$2.750 $24,174 $24,611
$3.000 $24,826 $25,167
9-77
Education.