Chapter 09 – Short-Term Profit Planning: Cost-Volume-Profit (CVP) Analysis
9-46 (Continued-1)
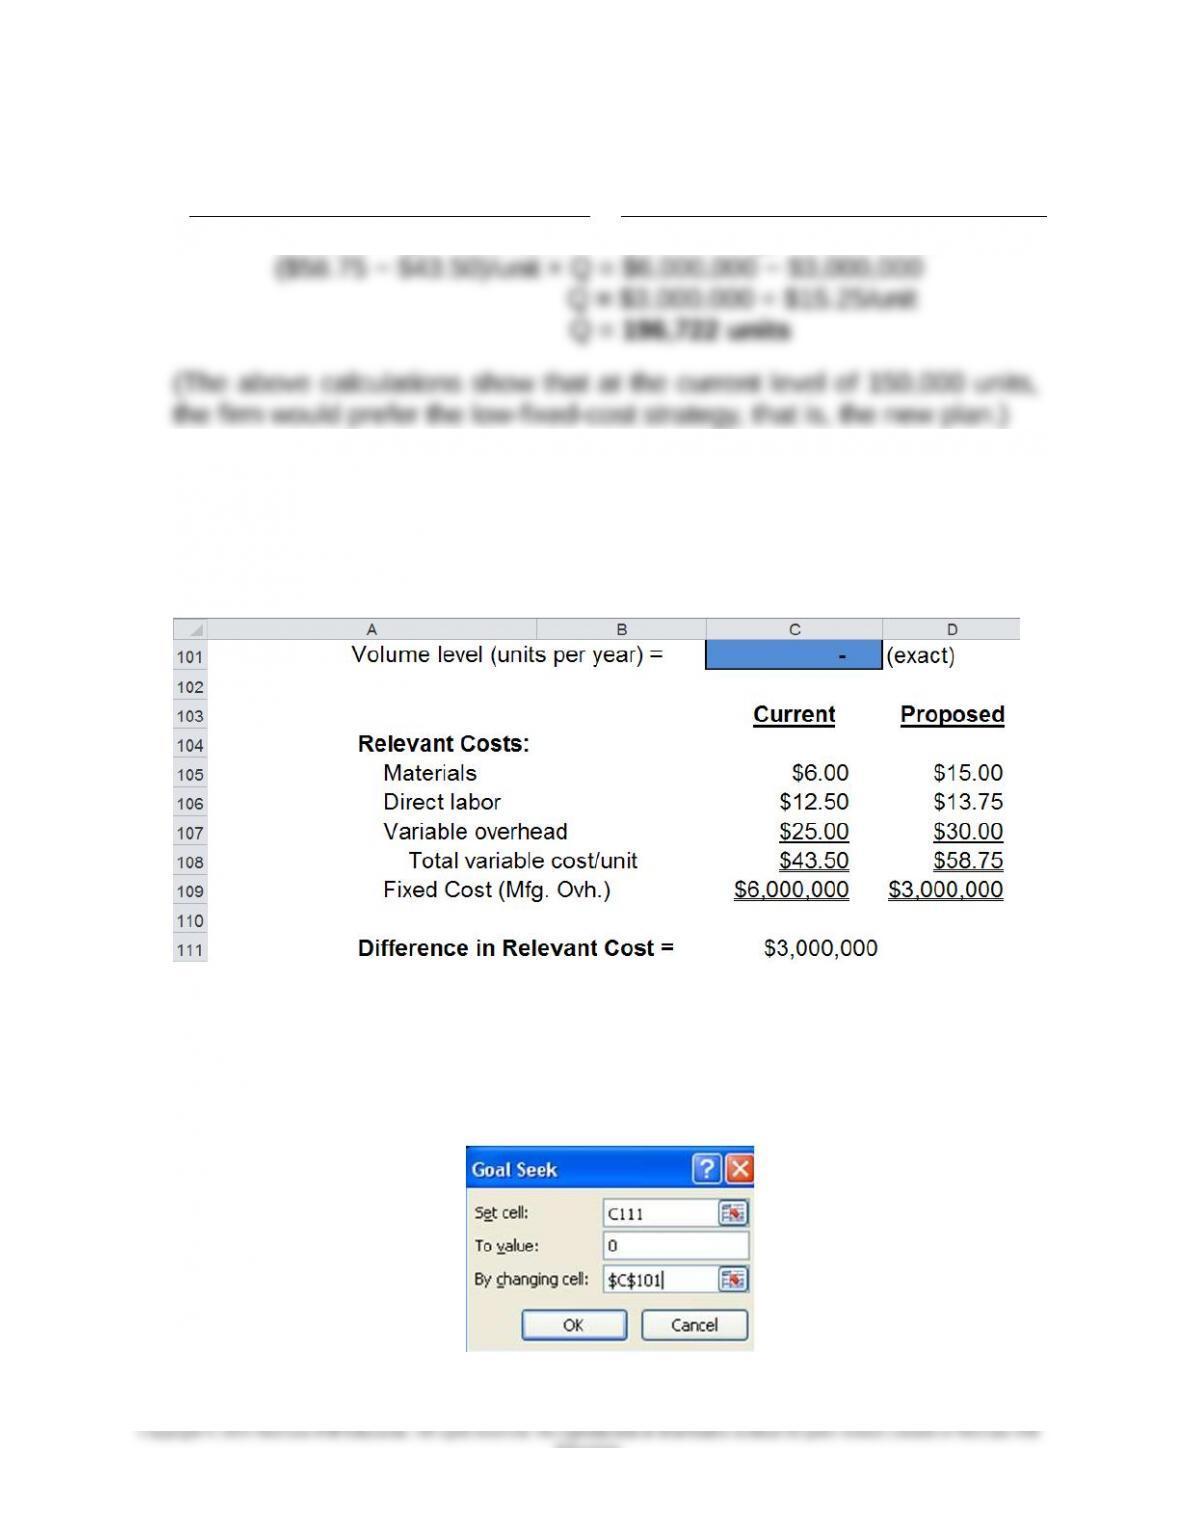
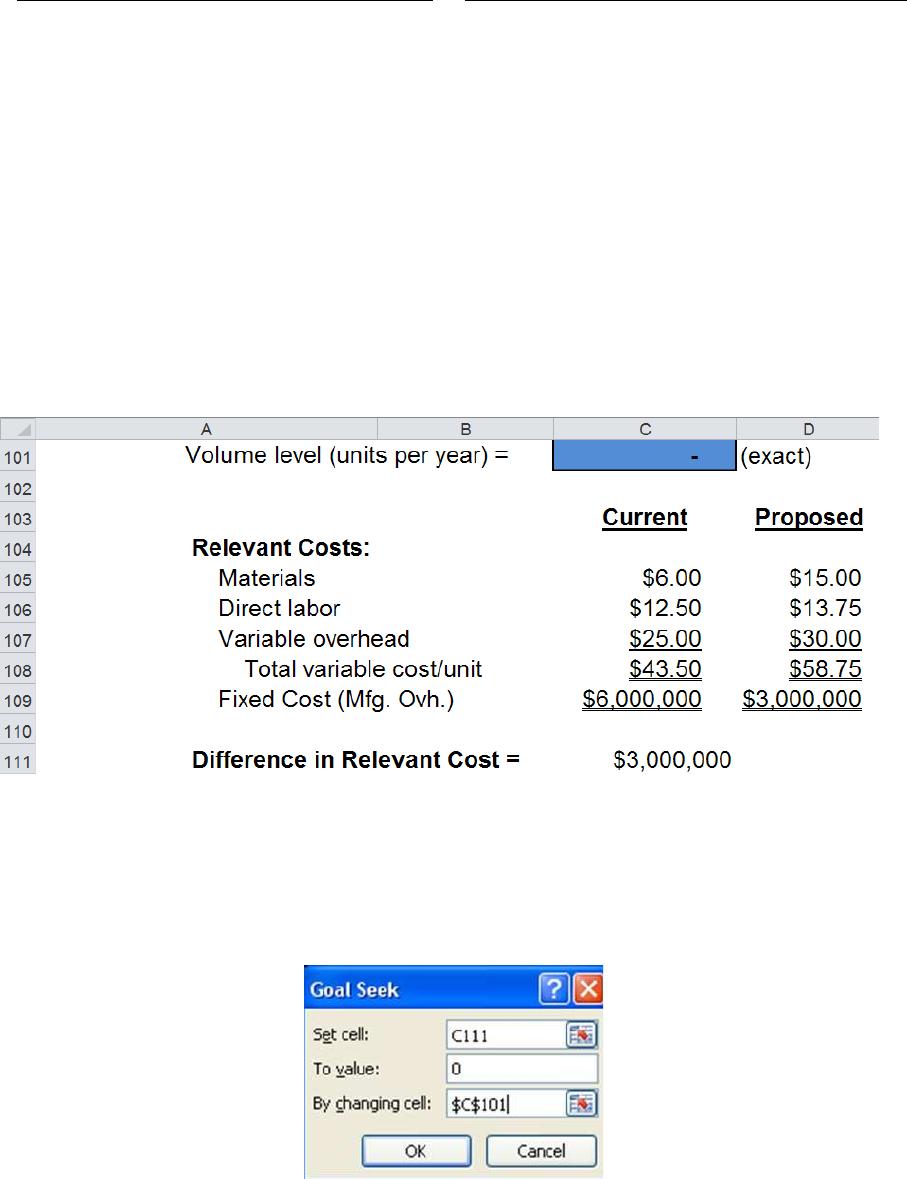
Total Relevant Cost, Current Plan = Total Relevant Cost, Proposed Plan
($43.50 × Q) + $6,000,000 = ($58.75 × Q) + $3,000,000
3. Use Goal Seek in Excel to confirm the answer found above in
Requirement 2:
Step #1: Define the Cost-Differential Equation (i.e., Relevant Cost of
Current Production Plan – Relevant Cost of Proposed Plan)
Note: Cell C111 contains the formula:
((C101*C108) + C109) – ((C101*D108) + D109)
Step #2: Run Goal Seek, as follows:
9-60
Education.
Chapter 09 – Short-Term Profit Planning: Cost-Volume-Profit (CVP) Analysis
9-46 (Continued-2)
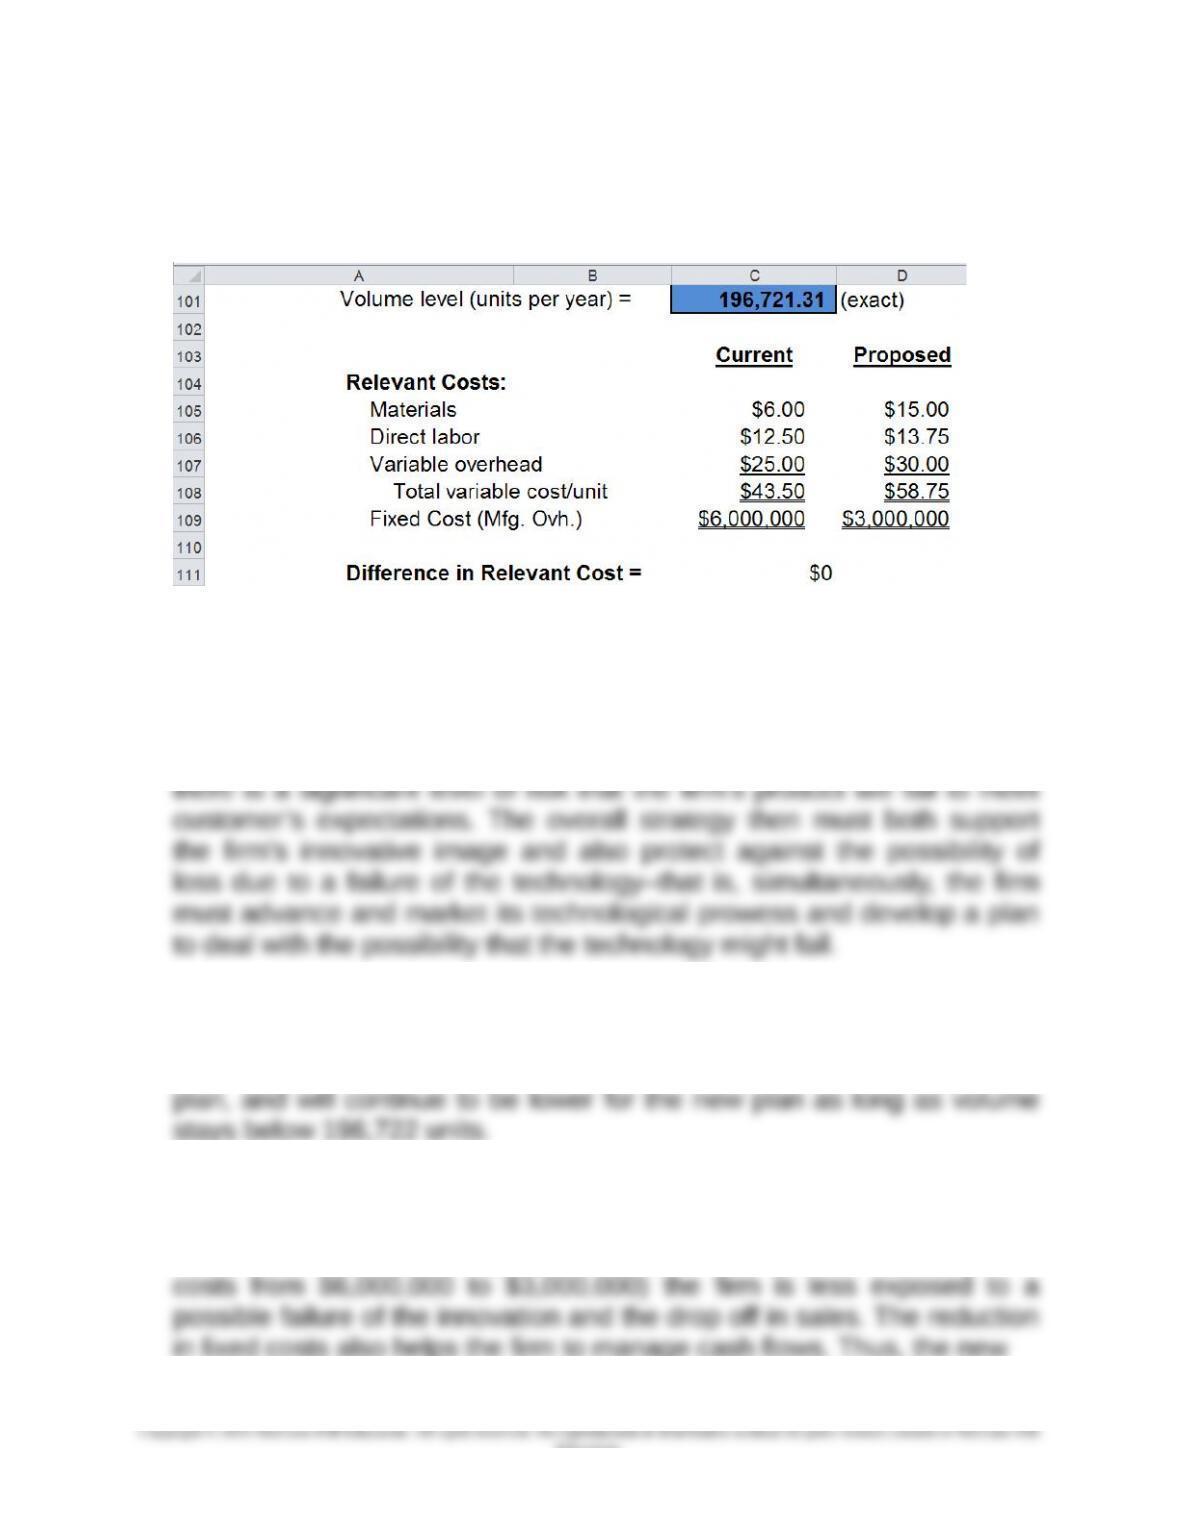
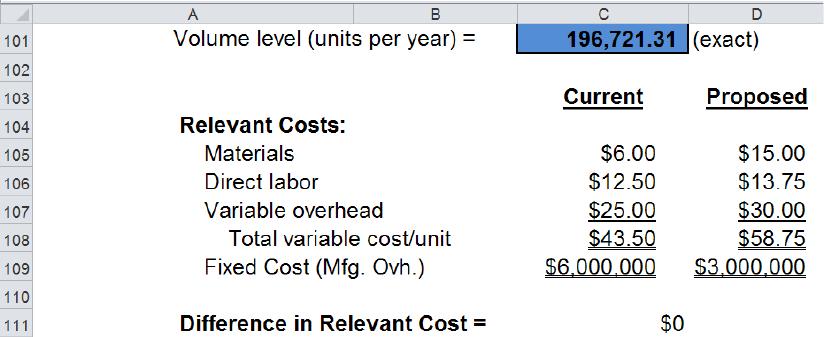
Step #3: Generate Results, as follows:
4. CG’s strategy is best described as differentiation, since the firm has
succeeded by innovation in product design. Further, the firm operates in
an industry in which innovation and product design are critical to
success. An important element of the firm’s strategy is also the fact that
the technology, as for many firms in the industry, is not proven. That is,
5.
a) The calculations in part 2 above support a decision to go to the new
plan; at the current level of 150,000 units, costs are lower for the new
b) Thinking strategically, the new plan is also preferred since it is an
appropriate response to the firm’s risk, as noted in Part 3 above. By
reducing operating leverage (that is, by reducing manufacturing fixed
9-61
Education.

Chapter 09 – Short-Term Profit Planning: Cost-Volume-Profit (CVP) Analysis
9-46 (Continued-3)
plan is more consistent with the firm’s strategy of developing an
innovative product and also dealing with the risk of potential loss
because of a possible failure of the technology in the market place.
Also, one could look at the proposal as consistent with the firm’s core
strength, which appears to be product innovation. There is no evidence
design and development.
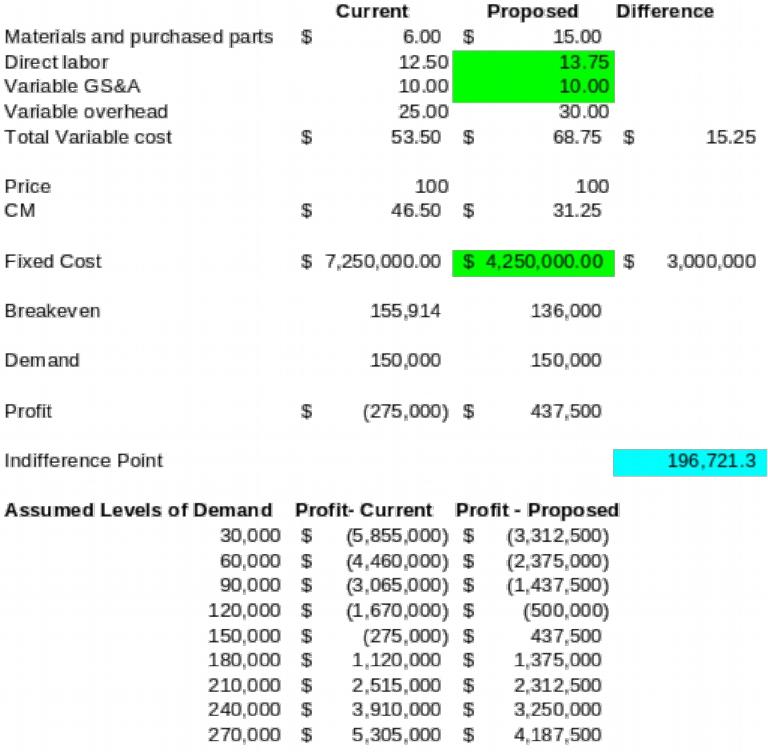
c) Sensitivity analysis: since uncertainty is important in this case, CG
Graphics should use some of the tools as illustrated below. Note that
the current method looks good if projected demand rises.
9-62
Education.

Chapter 09 – Short-Term Profit Planning: Cost-Volume-Profit (CVP) Analysis
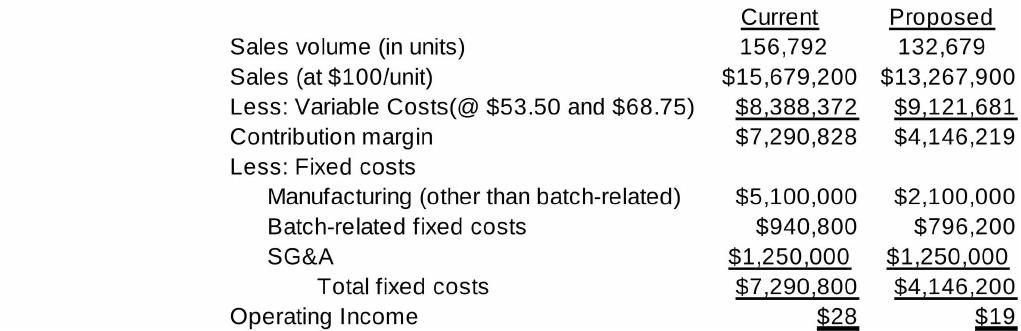
9-47 CVP Analysis, Activity-Based Costing (ABC) (30 min)
1. Total fixed overhead cost, including setup cost, is equal to $6,000,000
(i.e., $40/unit × 150,000 units).
Setup costs are $300 per setup (given). Under the current production
plan there are 3,000 setups, so total setup costs must be $900,000
(3,000 setups × $300/setup).
Thus, the total fixed manufacturing costs for the current plan, other
than setup costs, must be $5,100,000 (i.e., $6,000,000 − $900,000).
Therefore, under the current production plan, total variable costs per
manufacturing plan the variable cost per unit is $74.75 (including setup
costs), as follows:
Current Proposed
Materials and purchased parts $6.00 $15.00
Direct labor $12.50 $13.75
Variable overhead $25.00 $30.00
9-63
Education.

Chapter 09 – Short-Term Profit Planning: Cost-Volume-Profit (CVP) Analysis
9-47 (Continued-1)
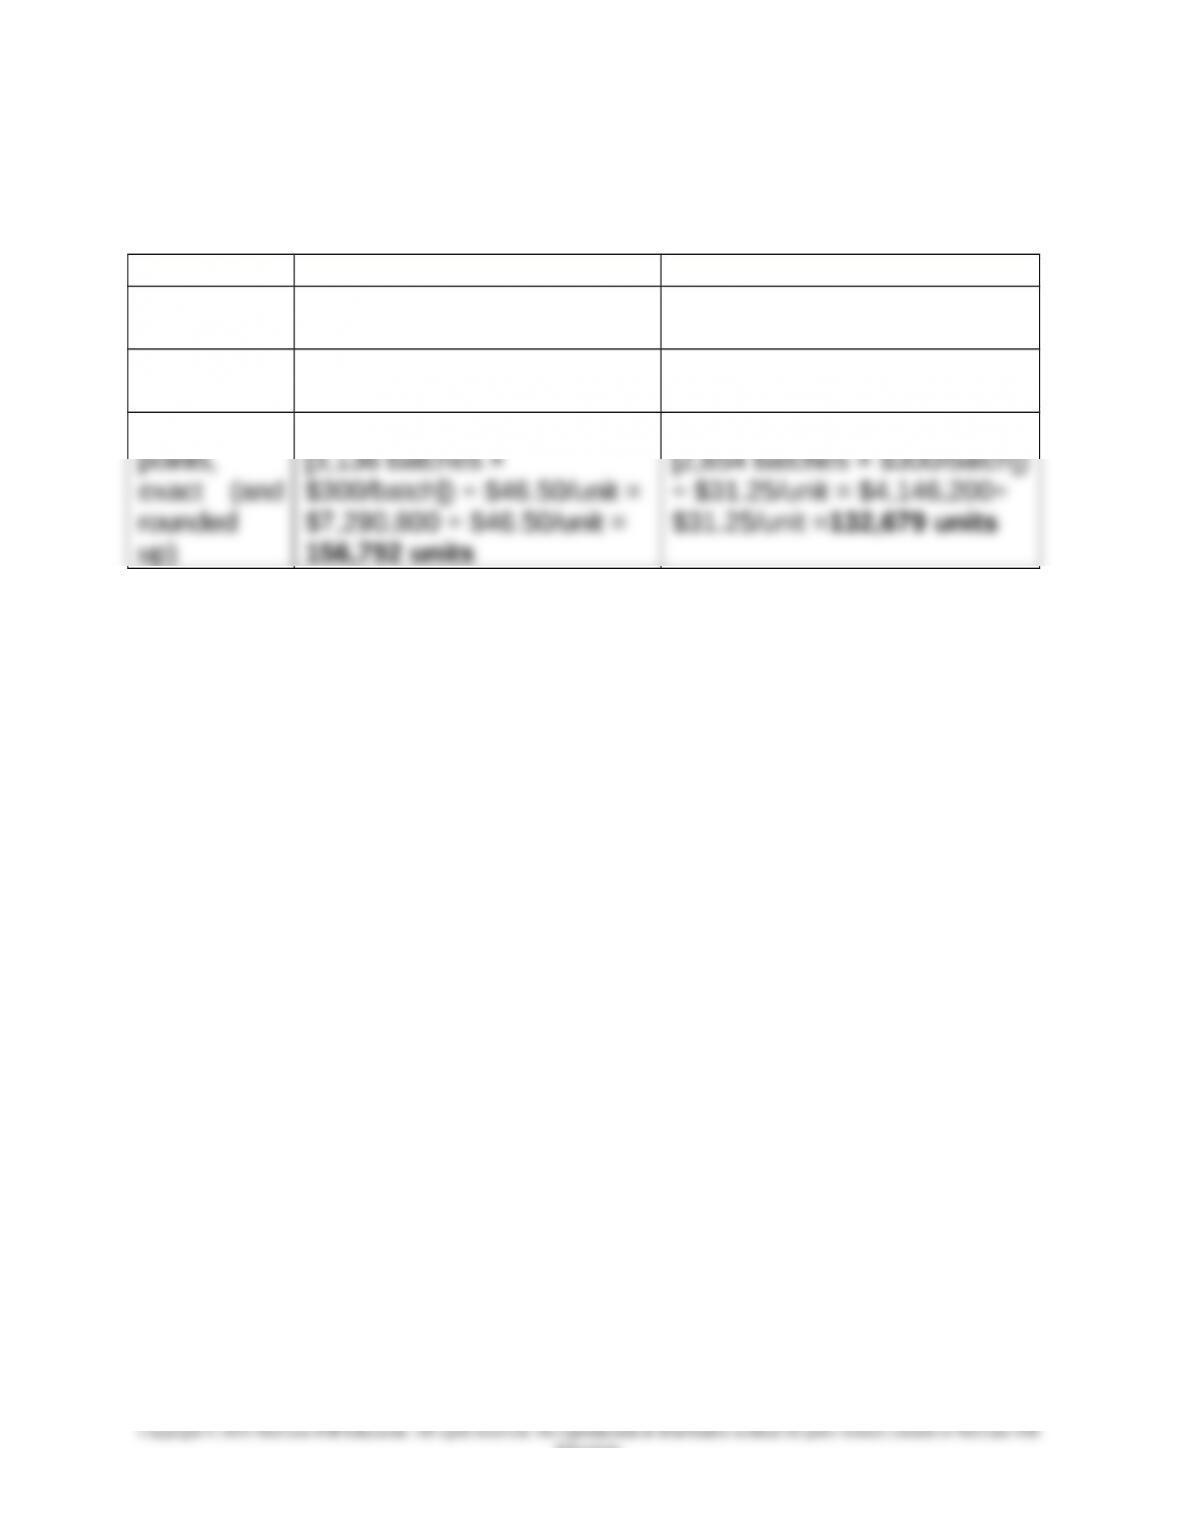
The ABC breakeven points can be determined as follows:
Current Plan Proposed Plan
Contributio
n Margin
$100 − $59.50 = $40.50/unit $100 − $74.75 = $25.25/unit
Breakeven
points
($5,100,000 + $1,250,000) ÷
$40.50 = 156,790 units
($2,100,000+$1,250,000) ÷
$25.25 = 132,673 units
Breakeven
($5,100,000 + $1,250,000 +
($2,100,000 + $1,250,000 +
Notes:
1. In the “breakeven, exact” calculations above, total batch-level costs
are added to the numerator (at the rate of $300 per batch), while
being excluded from the denominator (i.e., $6/unit).
2. For the current plan, all batches but the last batch (batch #3,136)
are of 50 units. Thus, under the current plan we would produce 3,135
batches @ 50 units/batch = 156,750 units. Batch #3,136 would
consist of 42 units, resulting in a combined total of 156,792 units.
Under the proposed plan, total units to break even equals 132,673.
This level of output would be produced using 2,653 batches of 50
units/batch (or, 132,650 units) and batch #2,654 consisting of 29 units
(i.e., 132,679 – 132,650 units).
3. Note that the breakeven point for the current manufacturing plan is
above the current operating level of 150,000 units. Also, since the
operating level of 150,000 is based on the assumption of 50 batches
of 3,000 each, to achieve breakeven will require more than 3,000
batches. Thus, breakeven analysis under ABC gives a higher
breakeven number than the volume-based approach; it recognizes a
larger number of setups and therefore larger setup cost ($940,800
versus $900,000).
9-64
Education.
Chapter 09 – Short-Term Profit Planning: Cost-Volume-Profit (CVP) Analysis
9-47 (Continued-2)
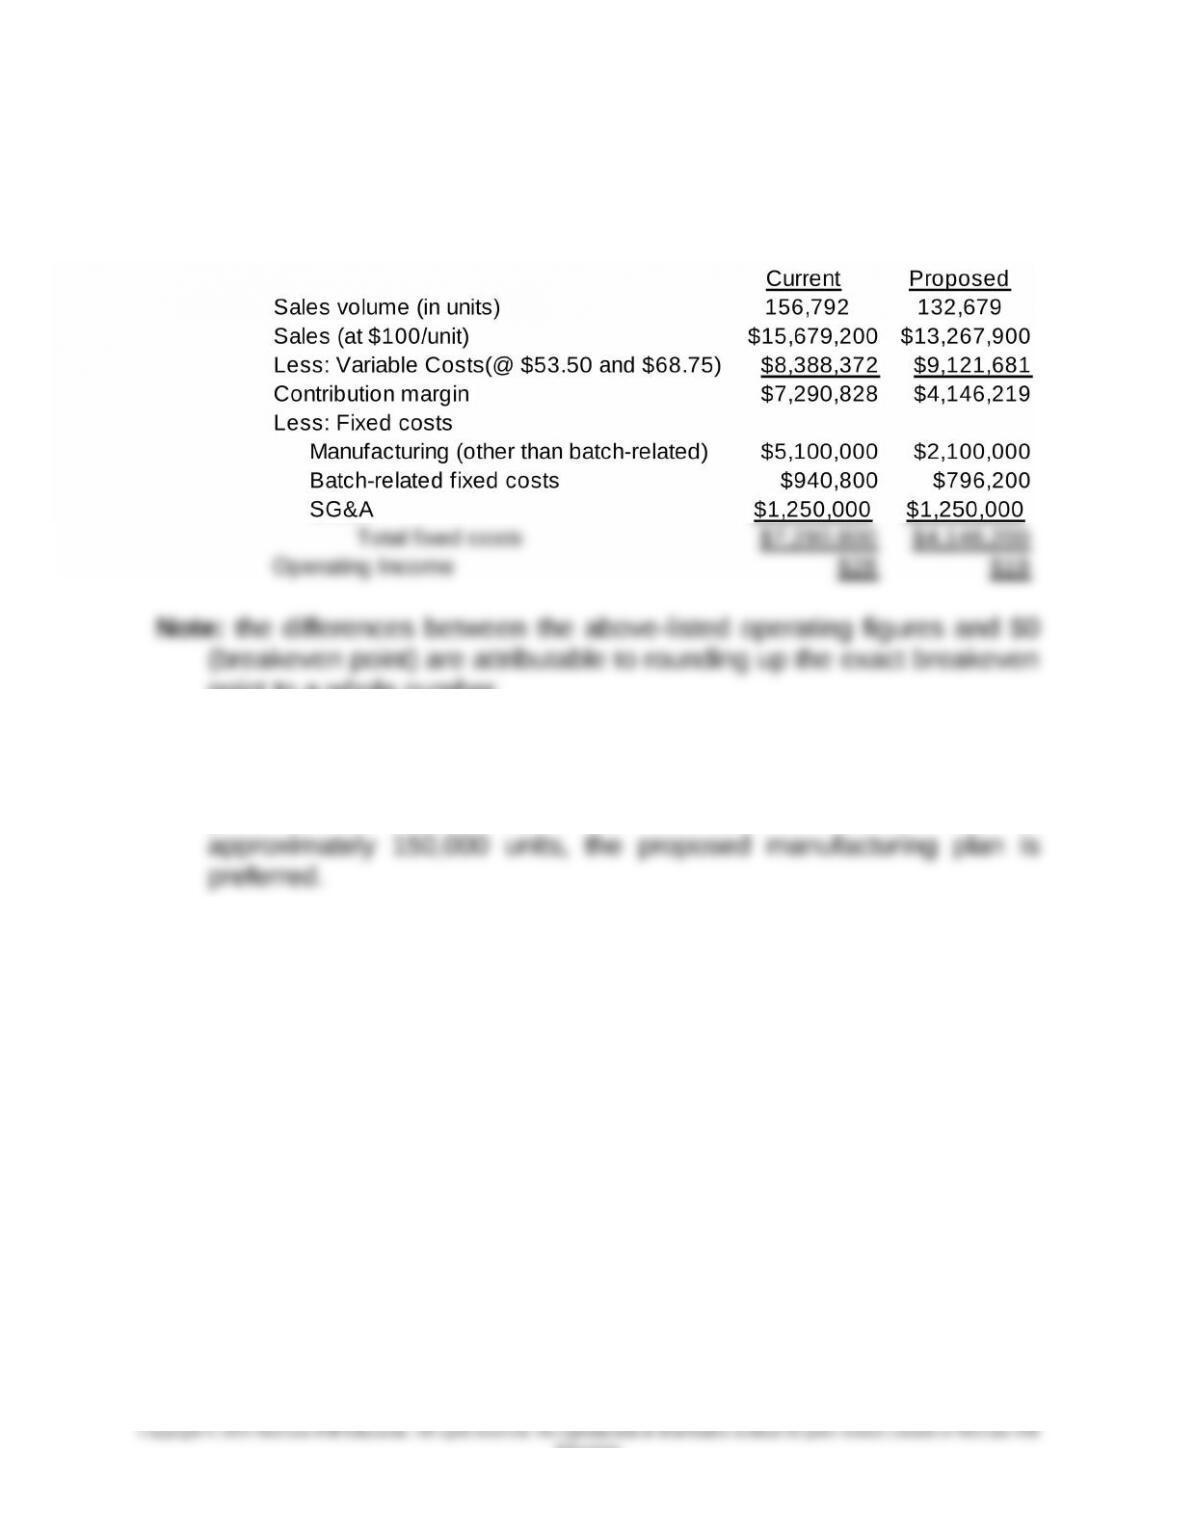
2. Contribution Income Statements, Exact Breakeven Points:
point to a whole number.
3. The ABC costing breakeven calculations do not differ much from that
for the volume-based calculations in Problem 9-46, and they both
point to the same answer–at the current volume level of
9-65
Education.

Chapter 09 – Short-Term Profit Planning: Cost-Volume-Profit (CVP) Analysis
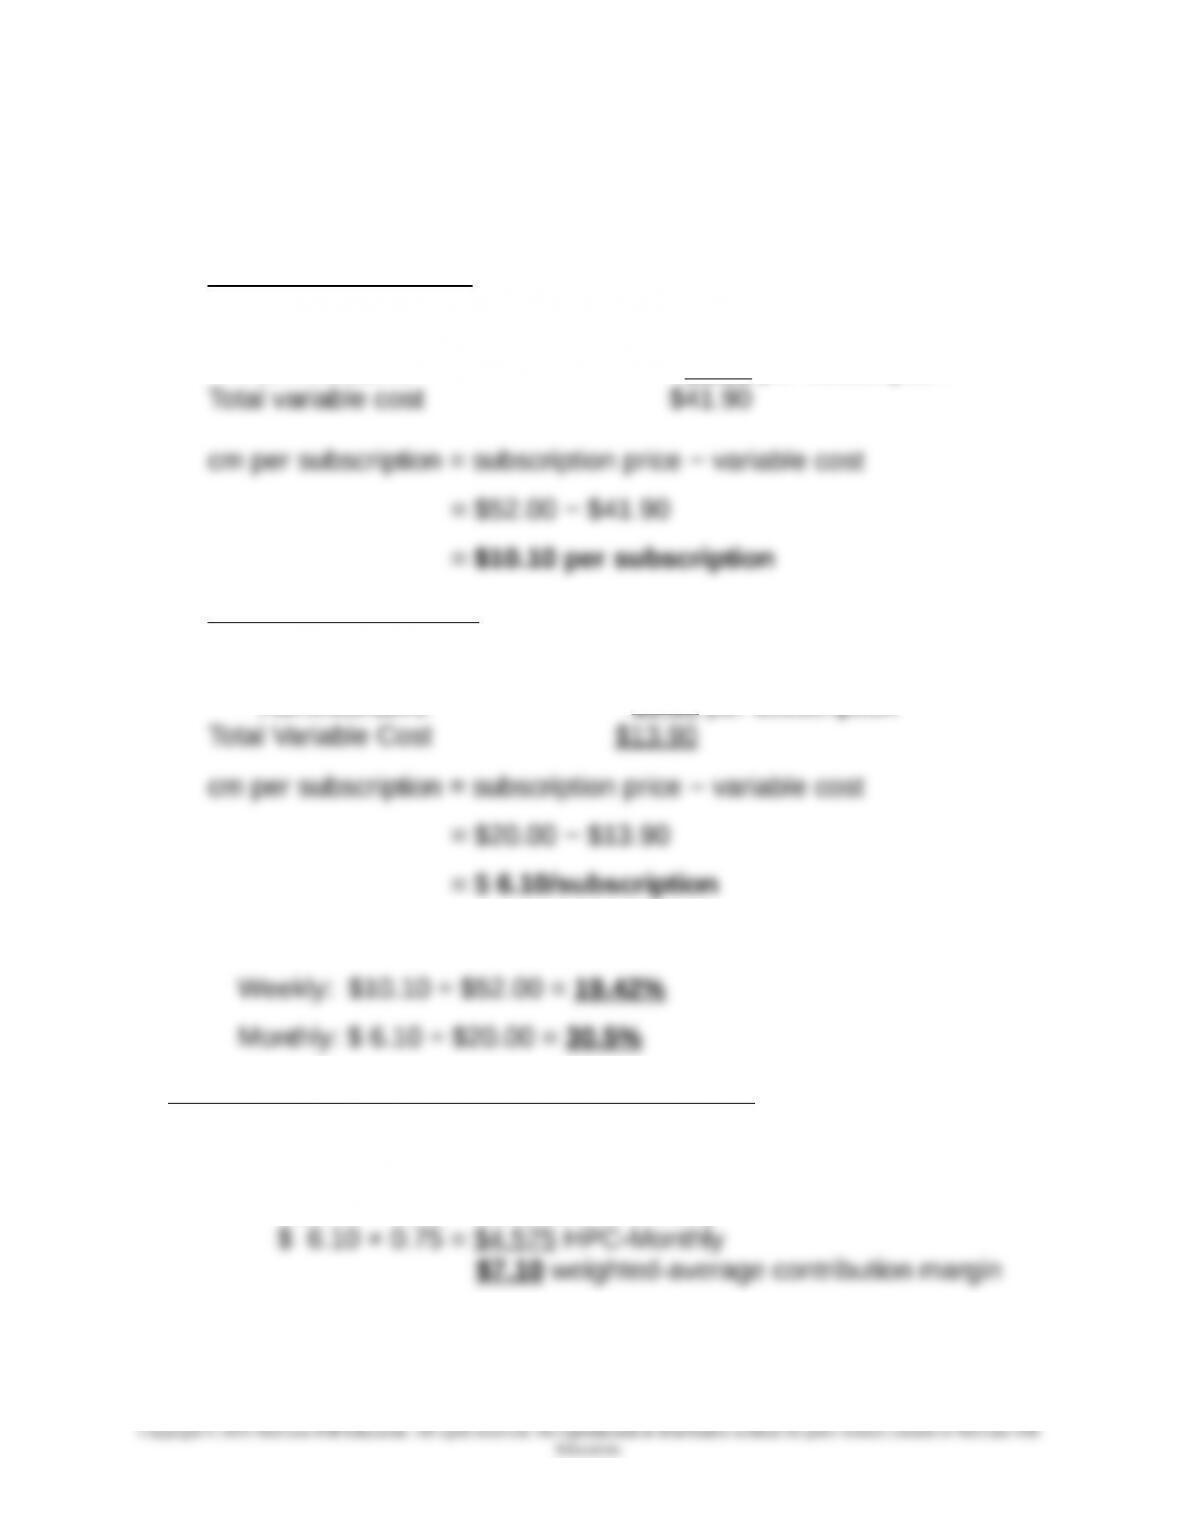
9-48 Multiple-Product CVP Analysis; Sensitivity Analysis (75-90 min)
1. Contribution margin per unit = subscription price − variable costs
Weekly Subscriptions:
Mailing = $0.70 per issue × 52 = $36.40 per subscription
Commission $3.50 per subscription
Administrative $2.00 per subscription
Monthly Subscriptions:
Mailing $0.70 per issue × 12 = $8.40 per subscription
Commission $3.50 per subscription
Administrative $2.00 per subscription
2. Contribution Margin Ratio (CMR) = cm per unit ÷ subscription price
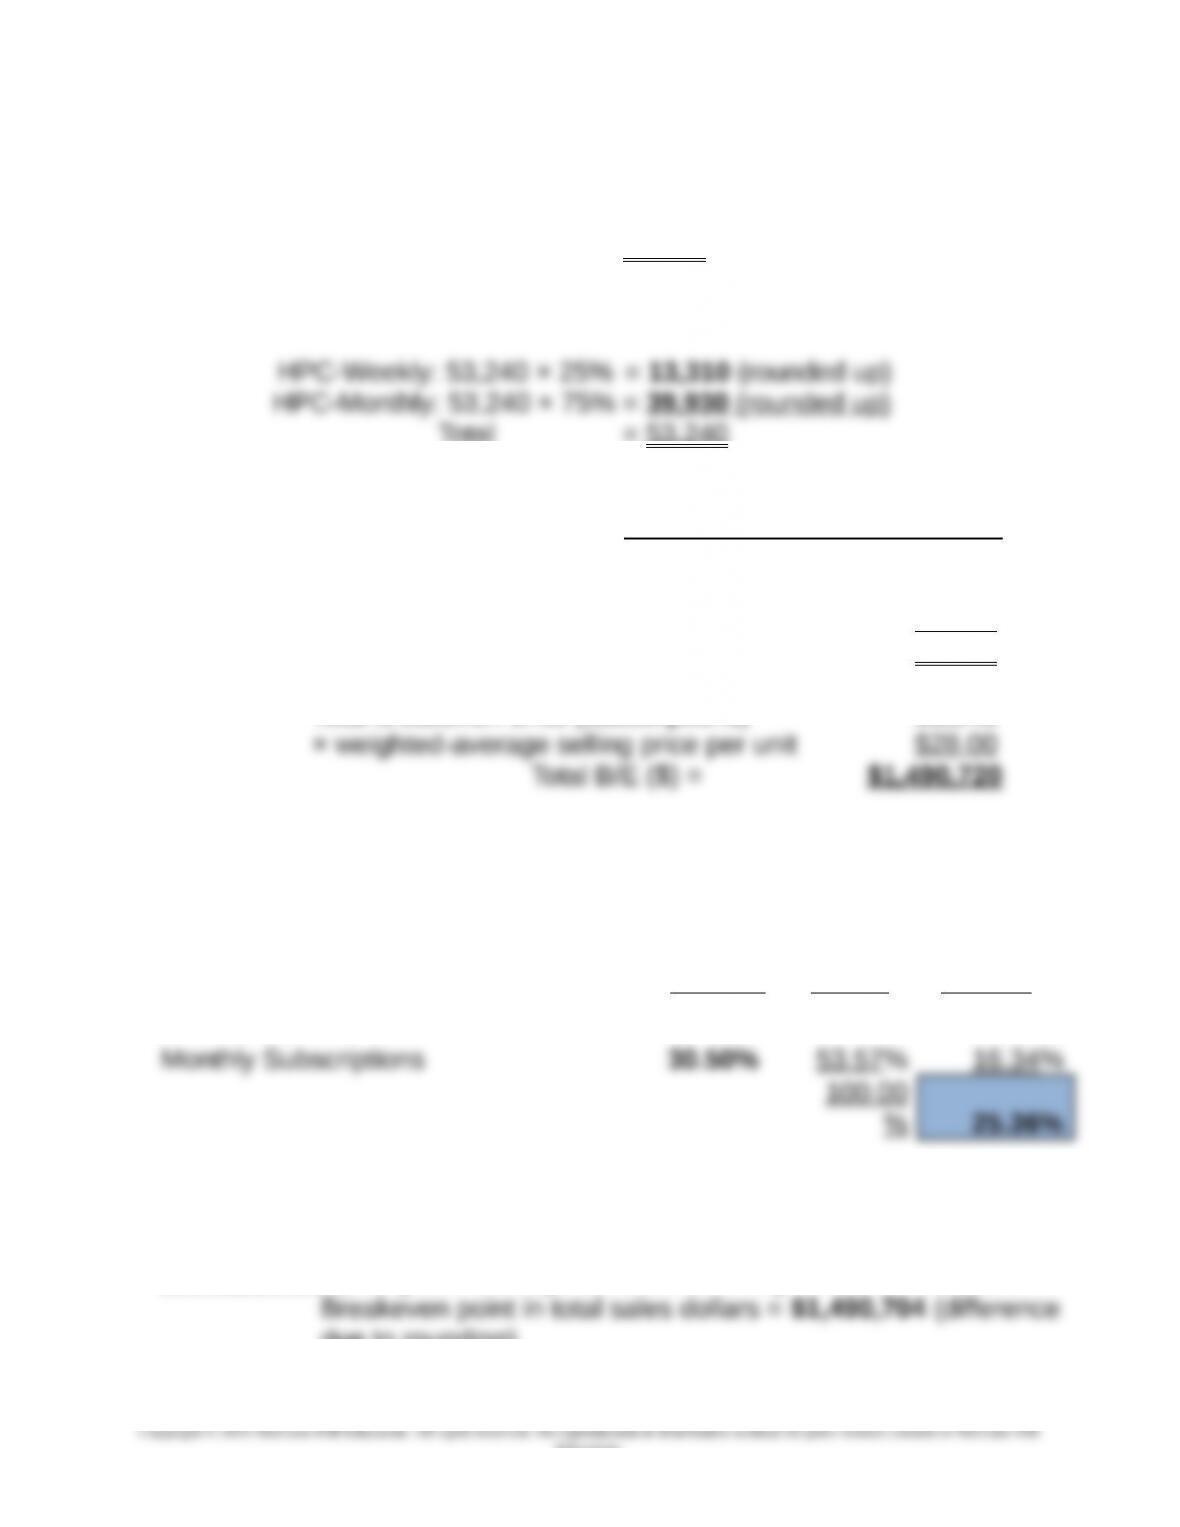
3. Breakeven in total sales units (# of subscriptions)
Weighted-average cm per unit = ∑ (cm/unit)(weight)i, i = 1,2
$10.10 × 0.25 = $2.525 HPC-Weekly
9-66

Chapter 09 – Short-Term Profit Planning: Cost-Volume-Profit (CVP) Analysis
9-48 (Continued-1)
Overall breakeven point = F ÷ weighted-average contribution margin/unit
= $378,000 ÷ $7.10/subscription = 53,240 subscriptions (rounded up)
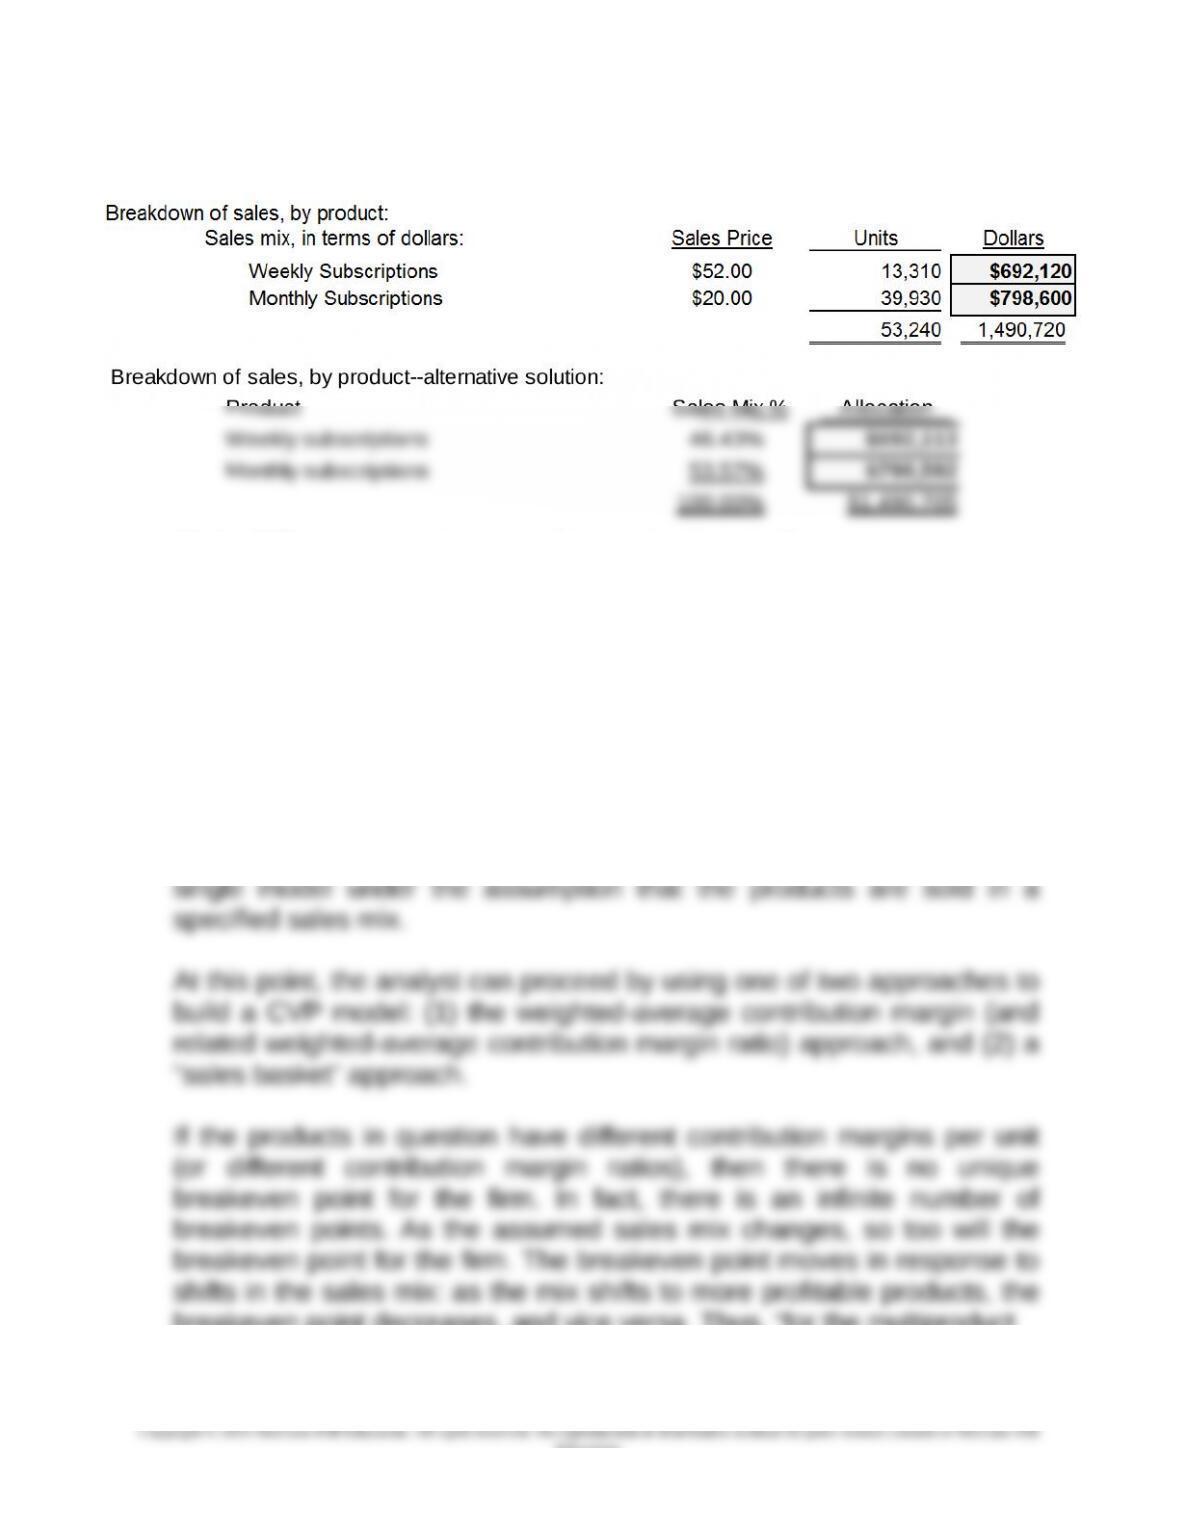
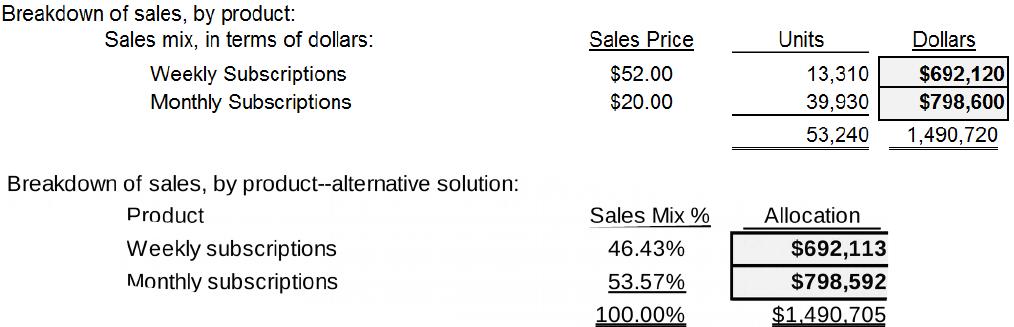
Breakdown into individual products:
Total = 53,240
Breakeven point in dollars:
Weight Selling Price Product
Wtd.-avg. selling price/unit:
Weekly Subscriptions 25% $52.00 $13.00
Monthly Subscriptions 75% $20.00 $15.00
100% $28.00
Breakeven ($):
Total breakeven units (subscriptions) 53,240
Breakeven point in dollars–alternative solution:
Breakeven in $ = F ÷weighted-average contribution margin ratio
Weighted-average contribution margin ratio:
cm ratio weight product
Weekly Subscriptions 19.42% 46.43% 9.02%
B/E ($) = Annual Fixed Costs ÷weighted-average contribution ratio
Annual Fixed Costs = $378,000
÷Weighted-average contribution margin ratio = 25.36%
due to rounding)
9-67
Education.
Chapter 09 – Short-Term Profit Planning: Cost-Volume-Profit (CVP) Analysis
9-48 (Continued-2)
Note: Differences in above results are due to rounding.
4. “For the multiproduct (or multiservice) firm, there is no breakeven point
independent of the sales mix assumption.”
One option for multiproduct CVP analysis is to trace and/or allocate total
fixed costs across the products and then prepare a separate CVP model
for each product. Regardless of the ability to allocate such costs across
products, this approach fails to capture demand interdependencies
among products. Thus, for either of these two reasons, the conventional
approach to multiproduct (or multiservice) CVP analysis is to prepare a
breakeven point decreases, and vice versa. Thus, “for the multiproduct
9-68
Education.

Chapter 09 – Short-Term Profit Planning: Cost-Volume-Profit (CVP) Analysis
9-48 (Continued-3)
firm, there is no breakeven point independent of the sales mix
assumption.” The only exception to this rule is when each product has
the same contribution margin per unit, which is considered a trivial case.
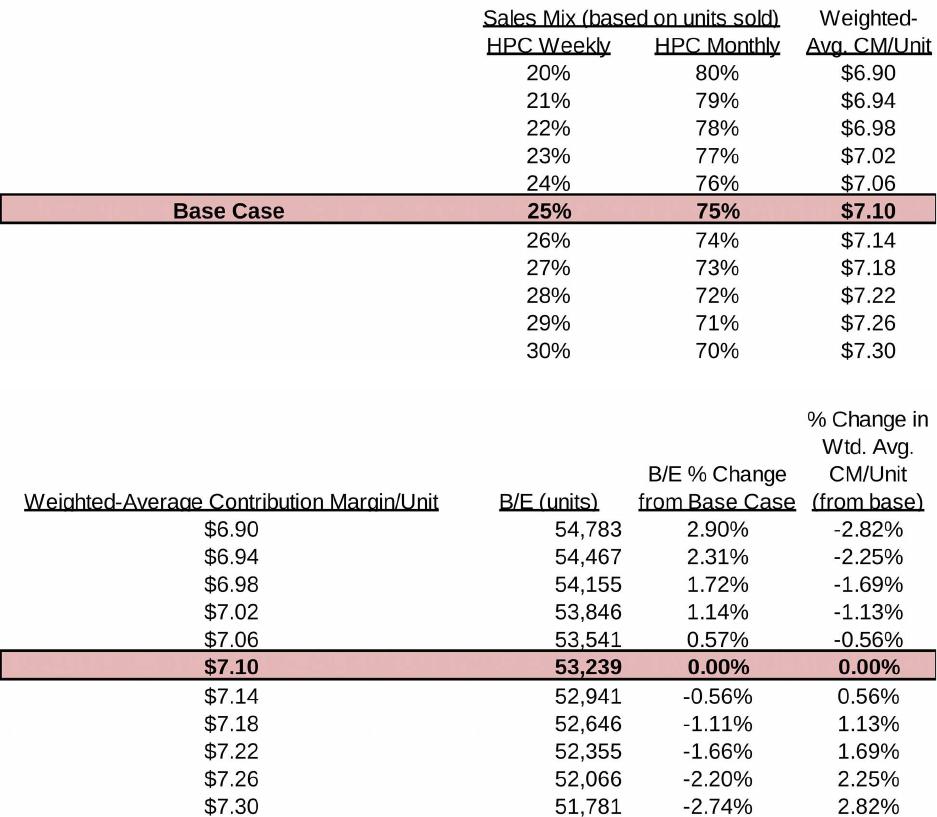
5. Sensitivity analysis table: what happens to the breakeven point as the
sales mix changes (in increments of 1%), from 20% to 30% for HPC
Weekly? Of what value to management is this type of analysis?
9-69
Education.