Chapter 08 – Cost Estimation
8-57 Cross-Sectional Regression (30 min)
1.
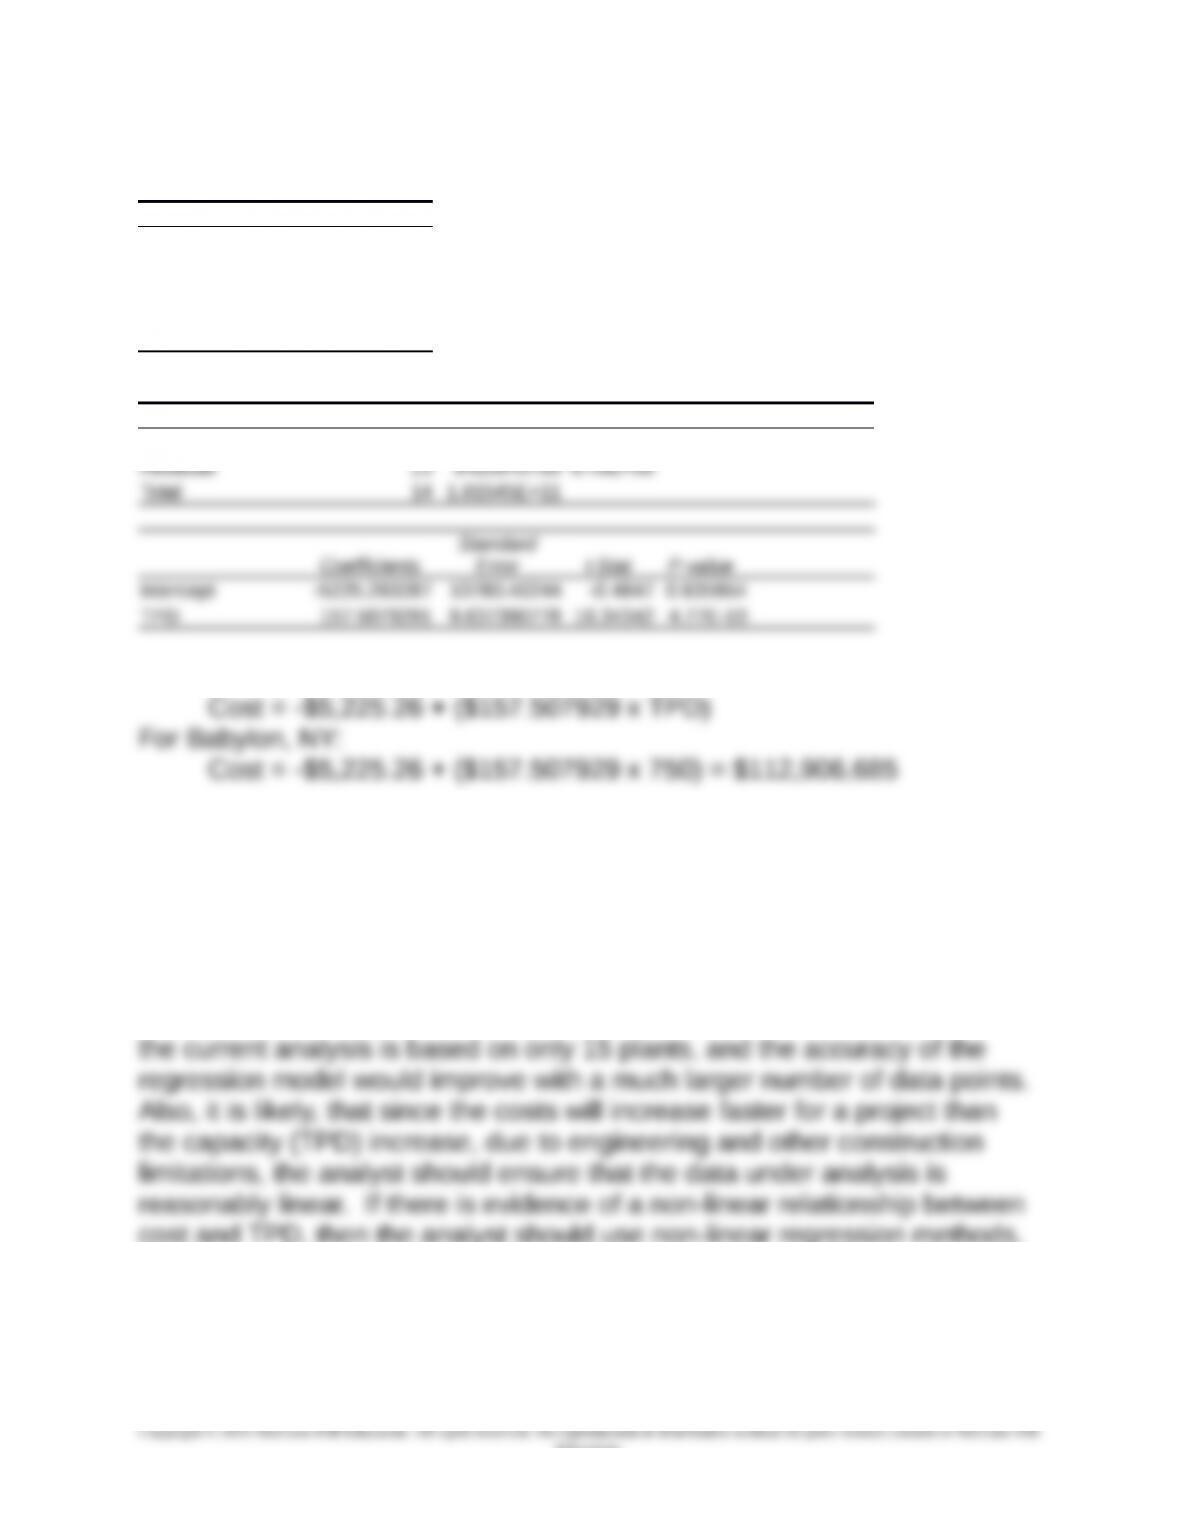
Regression Statistics
Multiple R 0.976518934
R Square 0.953589229 999
Adjusted R Square 0.95001917
Standard Error 25458.32309
Observations 15
ANOVA
df SS MS F Significance F
Regression 1 1.73119E+11 1.73E+11 267.1074 4.77053E-10
Construction Cost Equation
2. The regression has strong statistical measures. The R-squared is
relatively high at 95.35%; the t-value for the independent variable TPD is
high and the risk level (p) is low; the standard error of the estimate, at
25,458, is relatively small given the amounts predicted for the dependent
variable, so overall, the regression looks very strong, and the management
accountant should feel comfortable to rely on it in cost estimation. One
way it would be improved is to significantly increase the amount of data;
cost and TPD, then the analyst should use non-linear regression methods.
There are a variety of non-linear regression approaches. A practical and
relatively simple method is to convert the data by taking the natural log of
each data point and then running the regression with the logged data.
8-57 (continued -1)
8-68
Education.
Chapter 08 – Cost Estimation
The conversion of logs removes the multiplicative type of non-linearity from
the equation. To see this, review the discussion in footnote 12 in the
costs may be higher for the larger plants.
3. From the standpoint of sustainability, the focus of the analysis needs to
move from construction costs to environmental metrics that measure the
effect on ground water, air quality, overall energy consumption in the
process of wastewater treatment, and other environmental variables. This
would add to the analysis such factors as the location of the facility, the
design of the facility, and other environmental considerations. Regression
operating cost.
Source: Richard K. Ellsworth, “Cost-to-Capacity Analysis for Estimating
Project Costs,” Construction Accounting and Taxation, September/October
2005, pp 5-10.
8-69

Chapter 08 – Cost Estimation
8-58 Developing a Regression Model (20 min)
Here is a case in which it is somewhat difficult to provide appropriate
quantitative measures for the dependent and the independent variables.
I use the case by asking the students for suggestions for dependent
renewable energy.
Then I ask them to rank the variable measures in terms of how likely we
can determine reliable quantitative measures. While the students will not
likely agree on the ranking, the exercise will persuade them that the task of
identifying variables, while difficult, is critical to a reliable forecasting model.
Measures for Dependent Variables
BTUs of renewable energy consumption (see U.S, Energy Information
Administration at http://www.eia.gov/renewable/)
Also: data from the U.S. Statistical Abstract
(https://www.census.gov/compendia/statab/cats/energy_utilities.html)
And: See also sources of news such as Renewable Energy World.com
(http://www.renewableenergyworld.com/rea/home)
Measures for Independent Variables
A key point to make is that while it is useful for understanding the
forecasting issues to make the distinction between Level 1 and Level 2
drivers, it is not helpful in developing a regression model for predicting
demand for renewable energy. The reason is that we are trying to forecast
demand and not so cial opinion or political action.
Variables to Represent Climate Change
Temperature change, number of days over 90 degrees, sea level
Increase, extent of drought, etc.
Sources include: the Natural Resources Defense Council
(http://www.nrdc.com), National Aeronautics and Space
Administration (http://climate.nasa.gov/)
8-58 (continued -1)
8-70
Education.
Chapter 08 – Cost Estimation
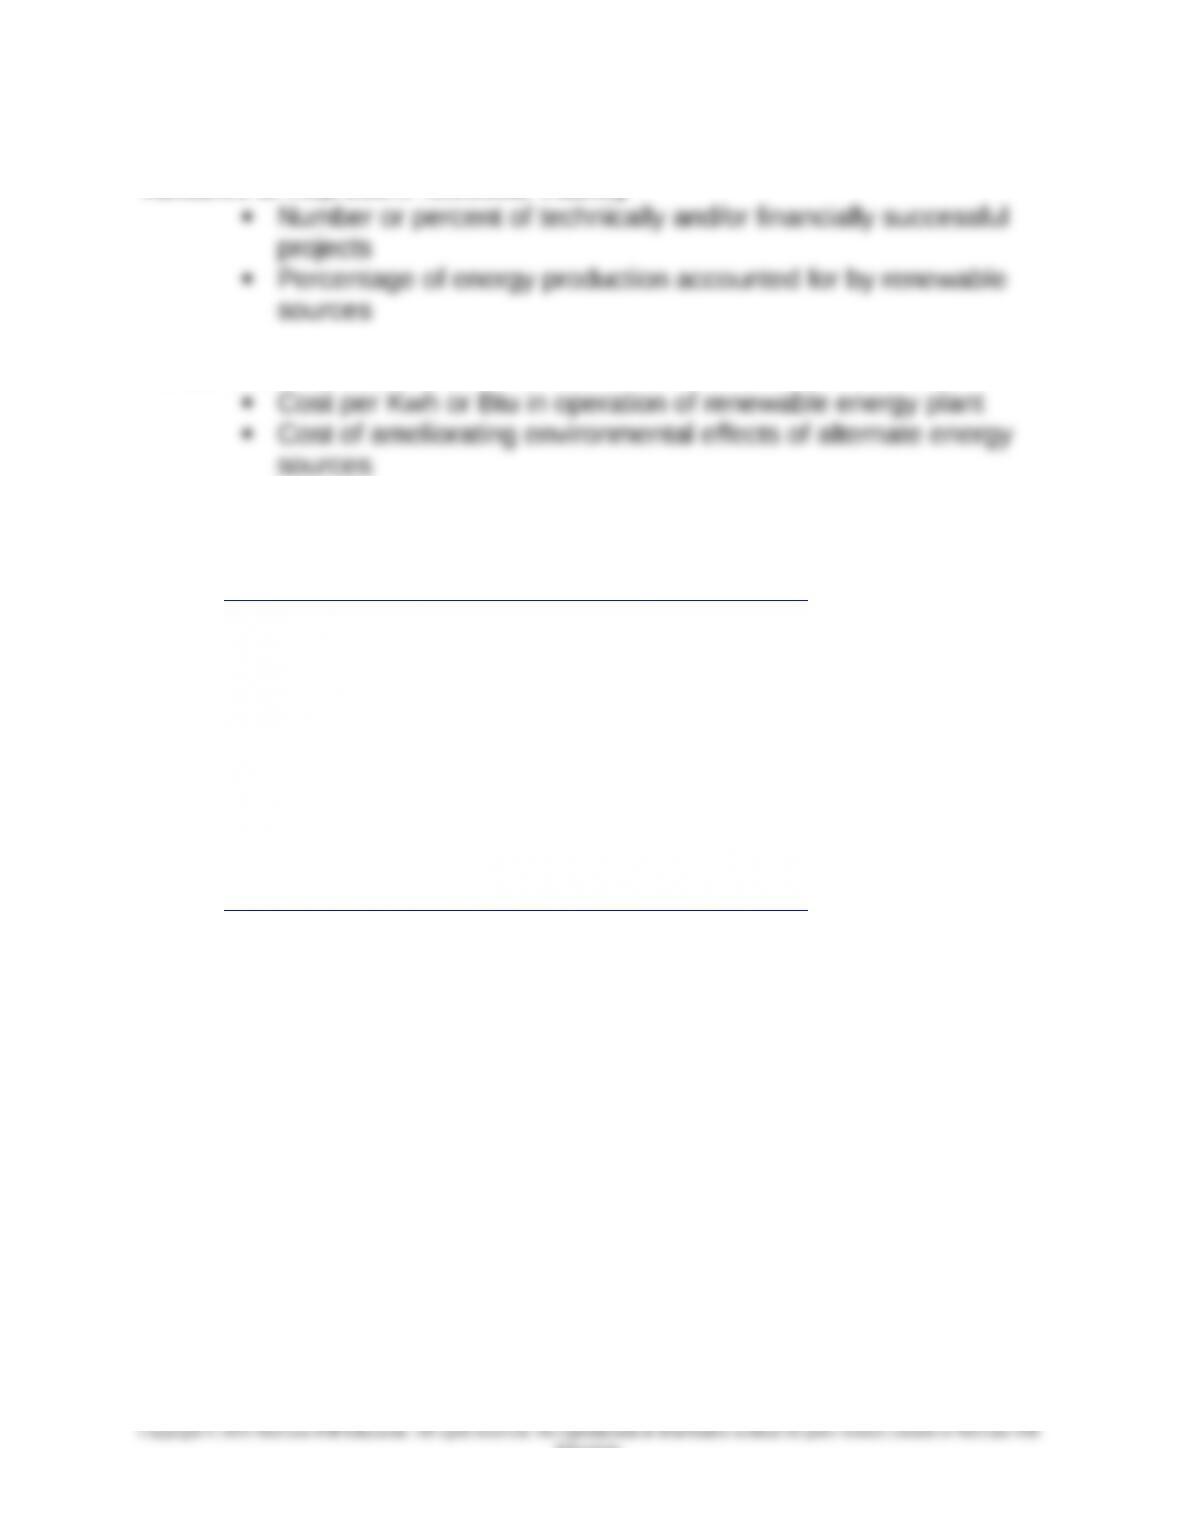
Variables to Represent Technical Viability
Variables to Represent Cost
Variables to Represent Governmental Subsidies
Renewable Energy World.com
(http://www.renewableenergyworld.com/rea/home)
Variables to Represent Regulations
Use a dummy variable to indicate the existence (or not) of
selected regulations.
Variables to Represent Tax Benefits
(note that both renewable energy efforts and fossil fuel companies
receive significant tax breaks)
See also Renewable Energy World.com
(http://www.renewableenergyworld.com/rea/home)
Source for Electric IQ reference (note that the name Electric IQ is the
disguised name of an actual company): David A.J. Axson, “Scenario
Planning: Navigating Through Today’s Uncertain World,” Journal of
Accountancy, March 2011, pp 22-27.
8-71
Education.
Chapter 08 – Cost Estimation
8-59 Analysis of Regression Results (15 min)
Based on R-squared, the most reliable regressions are for the balanced
cantilever bridge, followed by the precast construction, and then the cost-
in-situ construction. However, the results of the MAPE tests are different;
for MAPE the most reliable estimates are from the precast construction,
followed by cost-in-situ and balanced cantilever bridges. The authors cited
The regression models in this case predict concrete and steel consumption
in the bridge construction, and thus they predict cost only indirectly.
Therefore from this data it is not possible to say which bridge type is most
costly.
Source: N. Fragkakis, S. Lambropoulos, J. Pantouvakis, “A Cost Estimate
Method for Bridge Superstructures Using Regression Analysis and
Bootstrap,” Organization, Technology and Management in Construction,
Volume 2, Number 2 (2010), pp 182-190.
8-72
Education.
Chapter 08 – Cost Estimation
8-60 Cost Estimating for Defense Contracting; Using the Internet (25
min)
1. The cost estimation methods described in the document are called CERs
(cost estimating relationships) which are defined as mathematical
expressions relating the cost as the dependent variable to one or more
independent variables. The CERs described in the document include
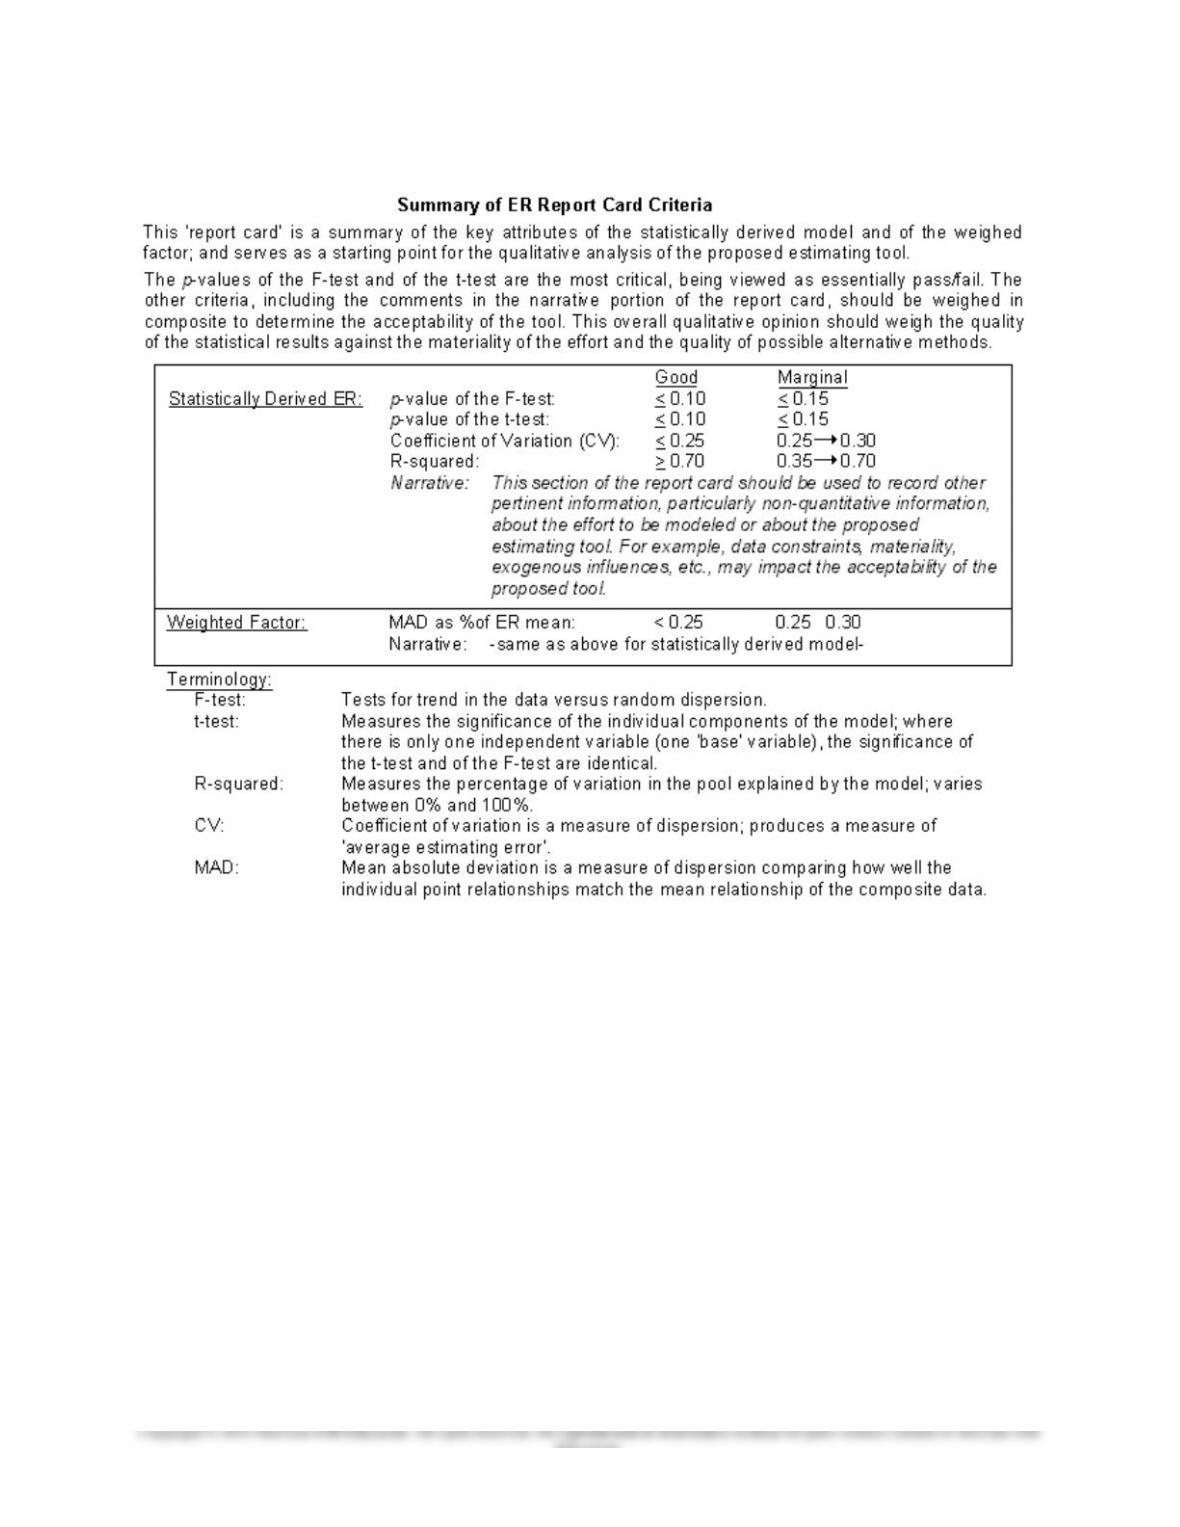
2. The model validation criteria in Exhibit 3.6 “Summary of Estimating
Relationship Report Card Criteria” on p 3-10 of the handbook are very
similar to those suggested in the text for most statistical measures, and
less restrictive than the text for other measures. For example, the
The “Summary of ER Report Card Criteria” is shown on the following page.
8-60 (continued -1)
8-73
Education.
Chapter 08 – Cost Estimation
8-74
Education.