Chapter 08 – Cost Estimation
8-45 (continued -1)
The global nature of the Pilot Shop’s operations adds another
limitation to the analysis. The purchasing and shipping costs will vary
with international business conditions and also with fluctuations in
8-41
Education.
Chapter 08 – Cost Estimation
8-46 Regression Analysis (20 min)
1.
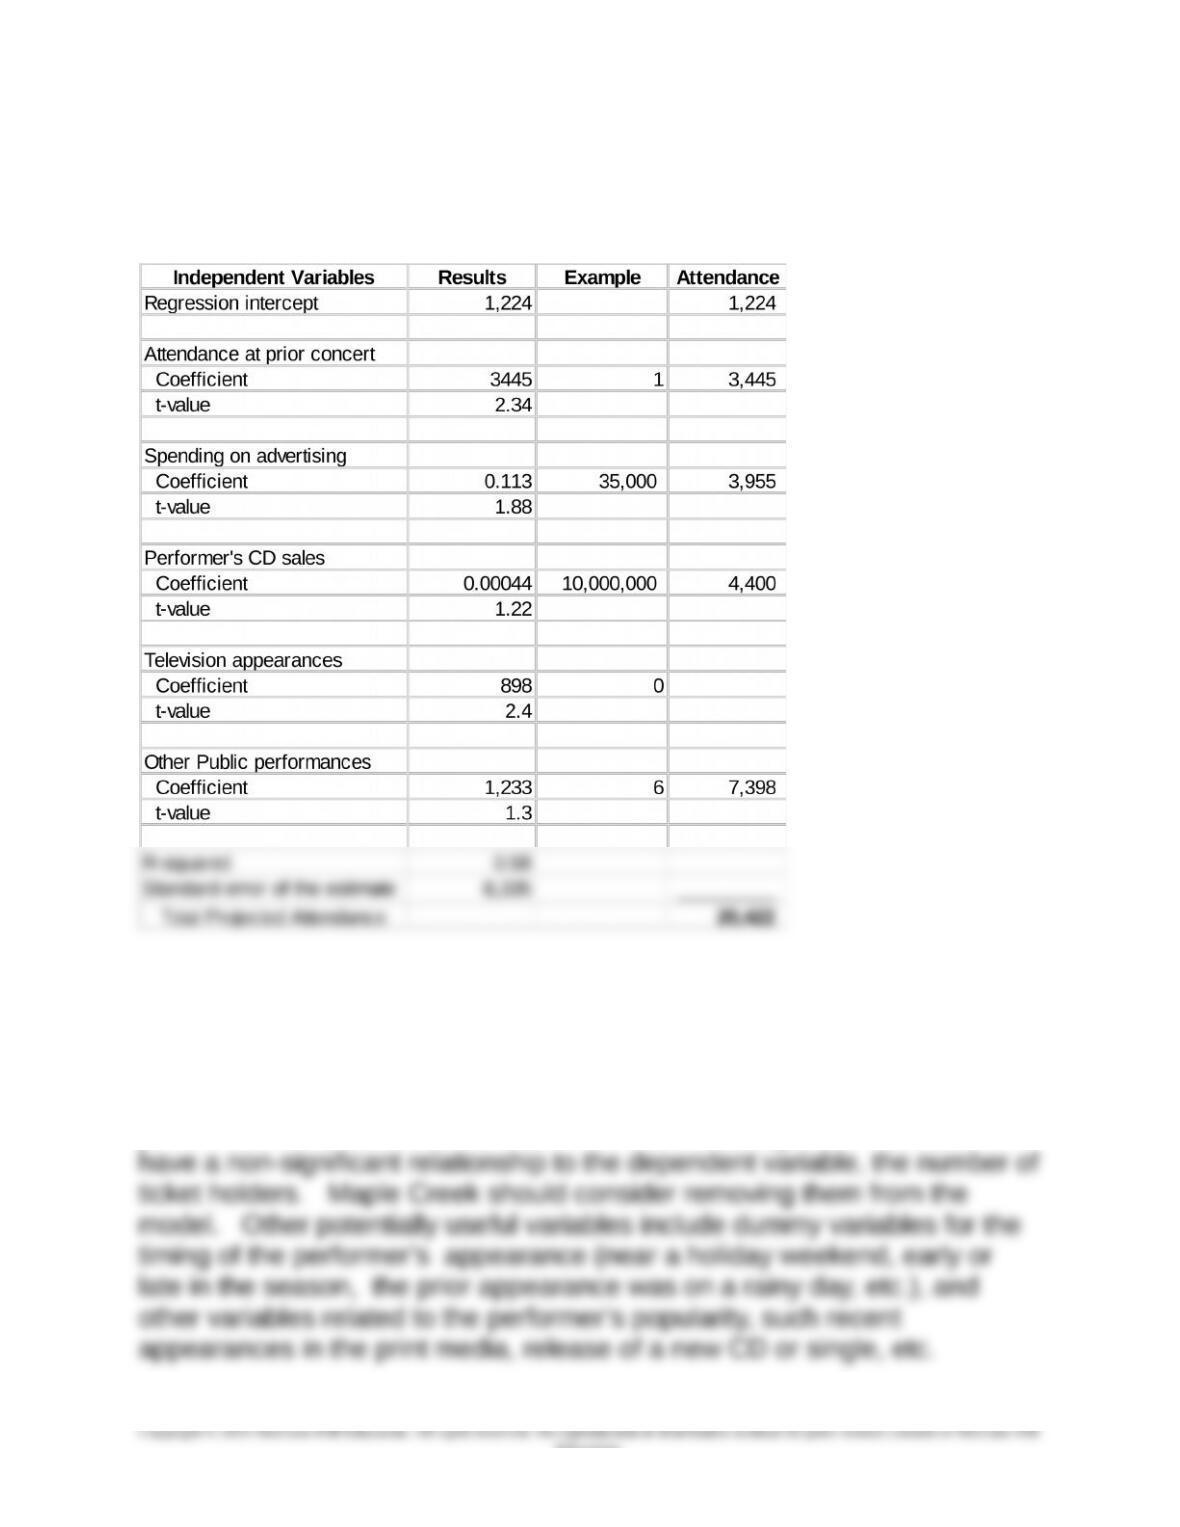
The total projected attendance is 20,422, as determined below.
2. The overall reliability of the regression, as measured by R-squared, is
modest, at 58% and the standard error of the estimate, at 8,335 is relatively
poor, considering the level of predicted attendance, 20,422. Also, three of
the five independent variables have unsatisfactory t-values. The t-values
for the advertising variable and the CD sales, and the other public
performances variables are all less than 2.0, indicating these variables
8-42
Education.
8.47 Correlation Analysis (20 min)
1.
The correlation analysis shows that only two of the correlations are
significant at the .05 level – order size vs runtime and complexity vs setup
time. In the case of order size vs runtime, the relationship is negative, or
inverse. That is, the larger the order size, the smaller the runtime per unit.
In the case of complexity vs setup time, the relationship is positive, that is,
the higher the complexity, the larger the setup time.
The findings for runtime and order size are based on an actual
2. The information above is particularly useful to PPI as it begin to focus on
smaller customers in order to find profitable alternatives to the low-cost
competition it now faces. The key point is that selling in smaller and more
customized orders will likely increase setup and runtime costs, as
8-43
Education.
Chapter 08 – Cost Estimation
8-48 Regression Analysis (20min)
1. Assuming that all purchases of autos for resale (cost of goods sold)
represent variable costs
Price = $30,000,000÷1,500 = $20,000
Variable cost per unit =
Profit for 2,000 units sold
Sales 2,000 x $20,000 = $40,000,000
Less Variable costs 2,000 x $18,455 = 36,910,000
2.
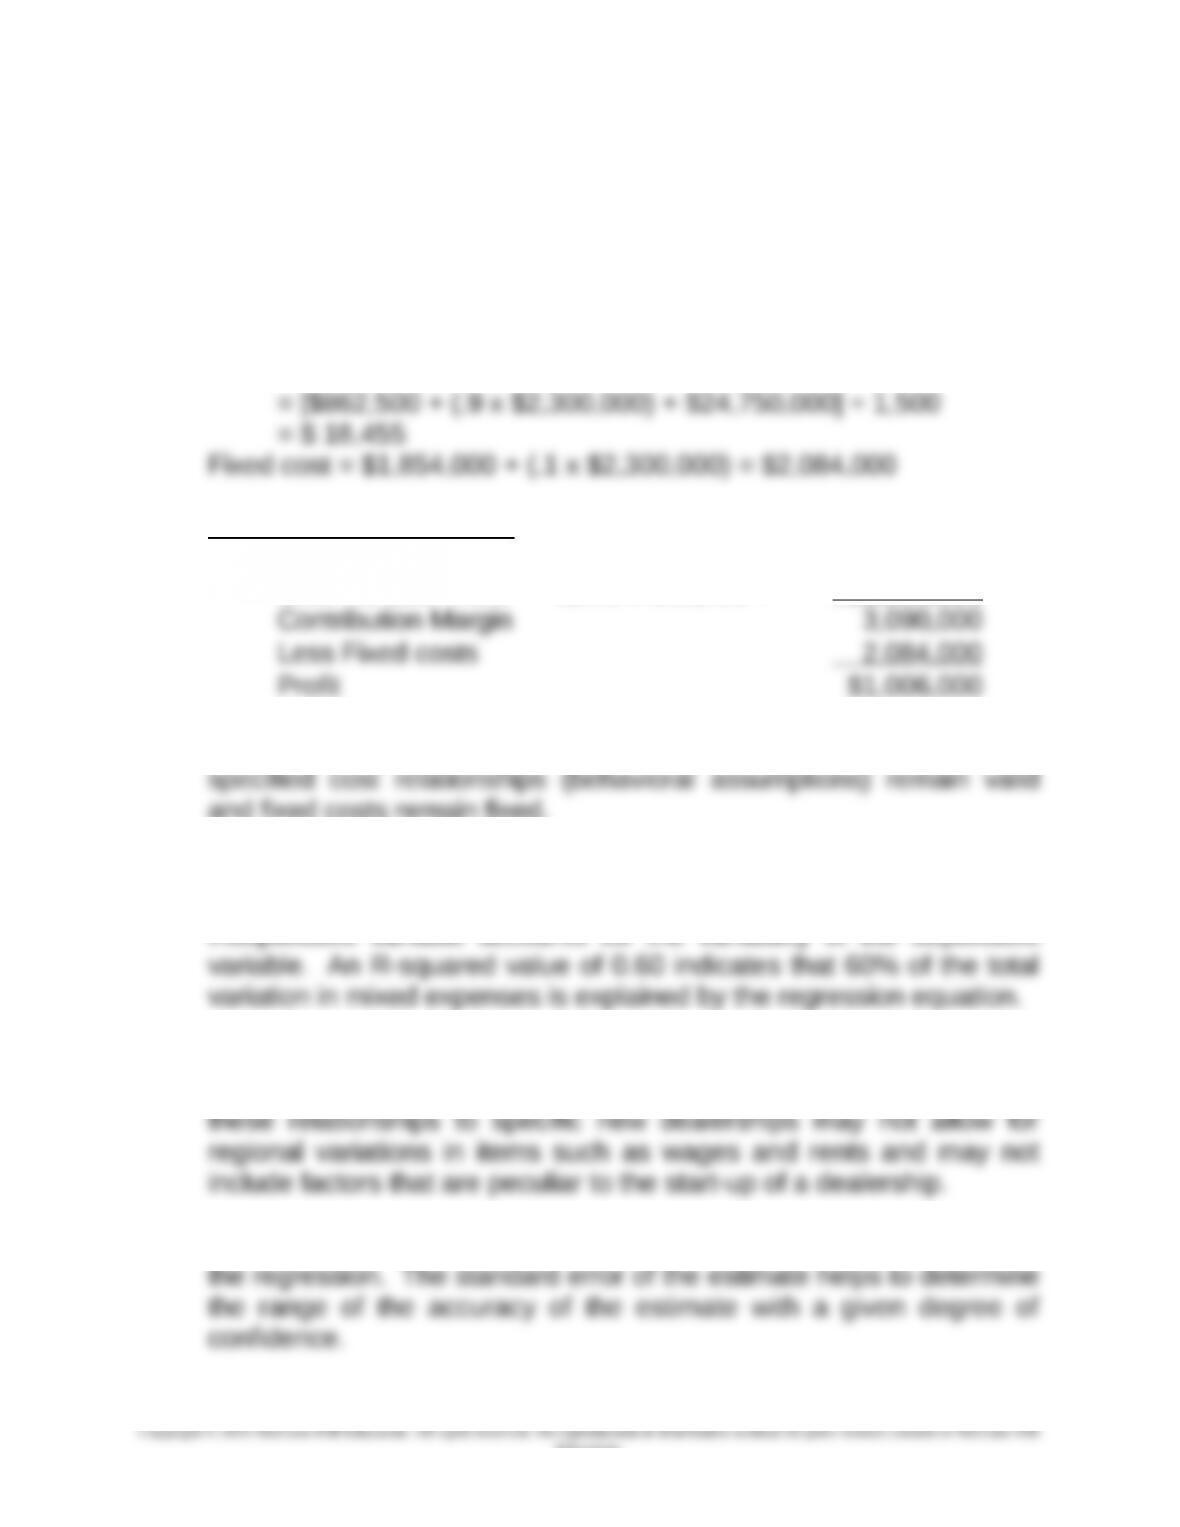
a. The relevant range is the band or range of activity within which
and fixed costs remain fixed.
b. The R-squared value is a measure of the goodness of fit between
the independent and dependent variable, the extent to which the
independent variable accounts for the variability in the dependent
c. The composite-based relationships may not be a good fit for Jack’s
dealership and could result in incorrect predictions. Application of
d. The standard error of the estimate is the measure of precision of
8-44
Education.
8-48 (continued -1)
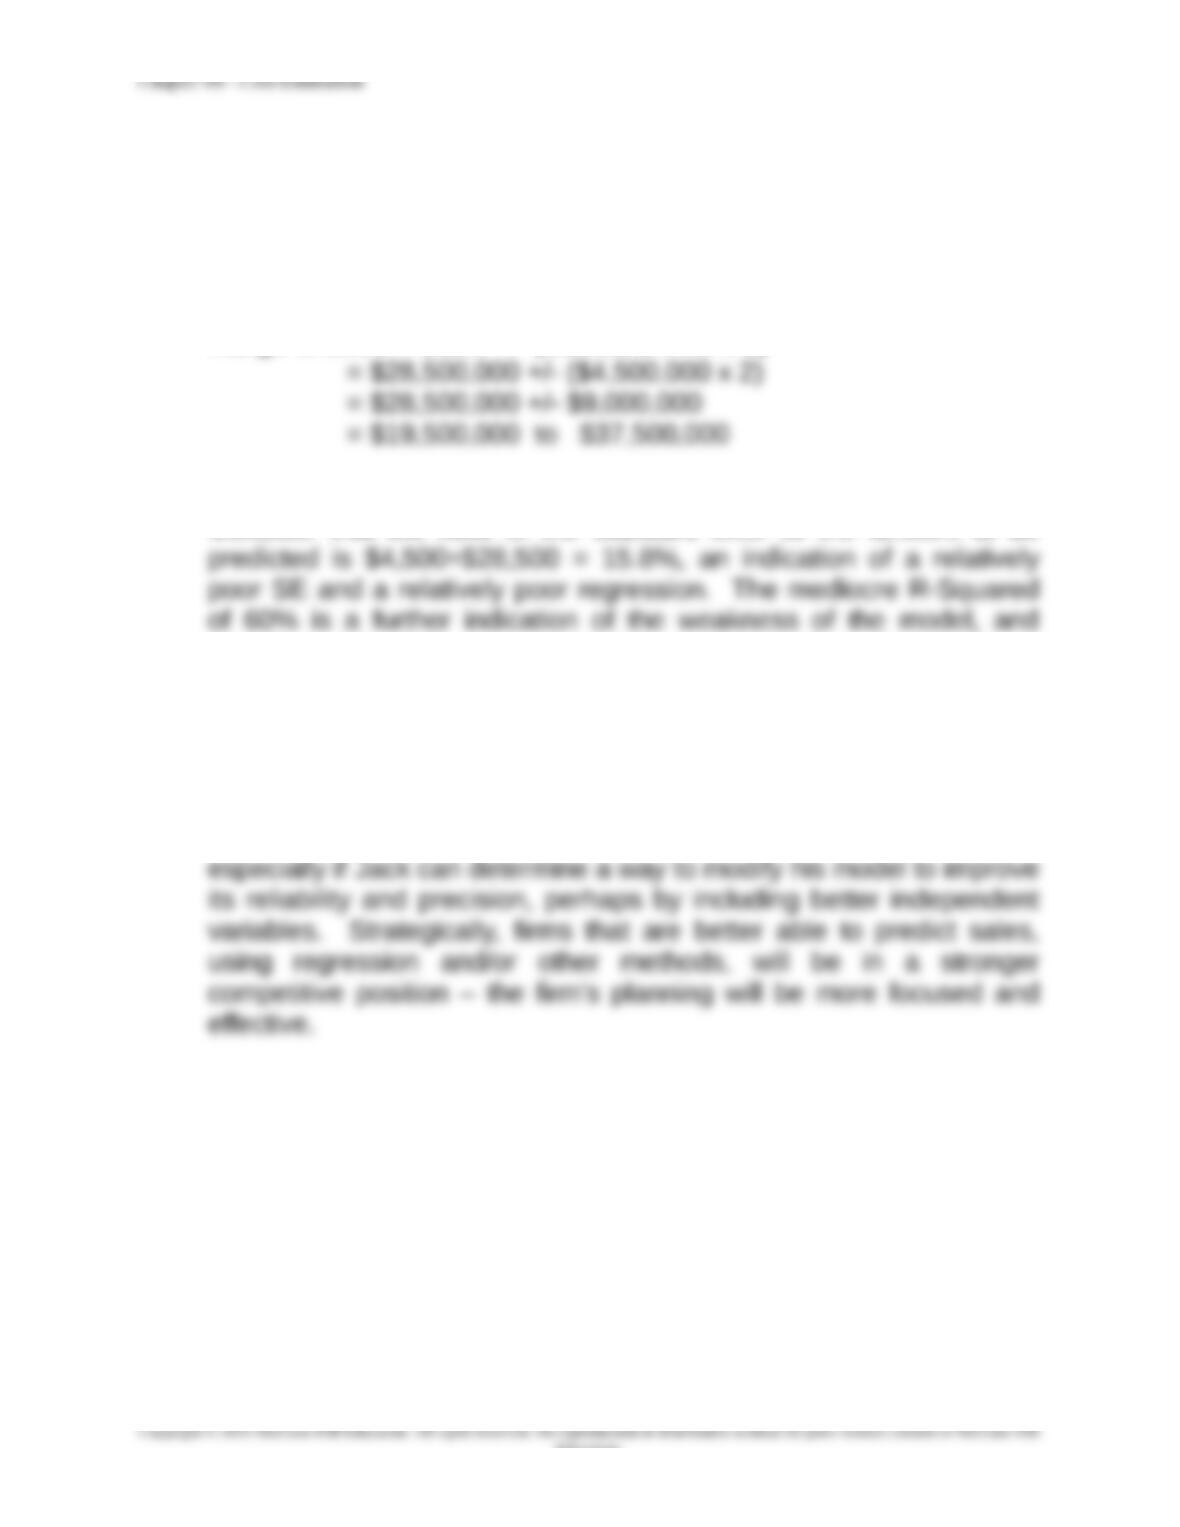
3. Using the regression equation that Jack Snyder developed, the
approximate range of sales that could occur during the year is
calculated below.
Range of sales = Sales +/- (Standard error x 2)
Note that this is a relatively wide range for the confidence interval.
Consider that the ratio of the standard error to the amount to be
therefore of the lack of precision of the predictions from the model.
4. A key issue for USMI is the risk of expanding its dealership
network. Regression analysis allows financial managers to make
predictions about the effect of the proposed expansion on sales and
profits. While Jack Snyder’s model is not particularly reliable or
precise (part 3 above), the approach is certainly worthwhile,
8-45
Education.
Chapter 08 – Cost Estimation
8-49 Cost Estimation; High-Low Method, Regression Analysis (30min)
1. High-Low Method
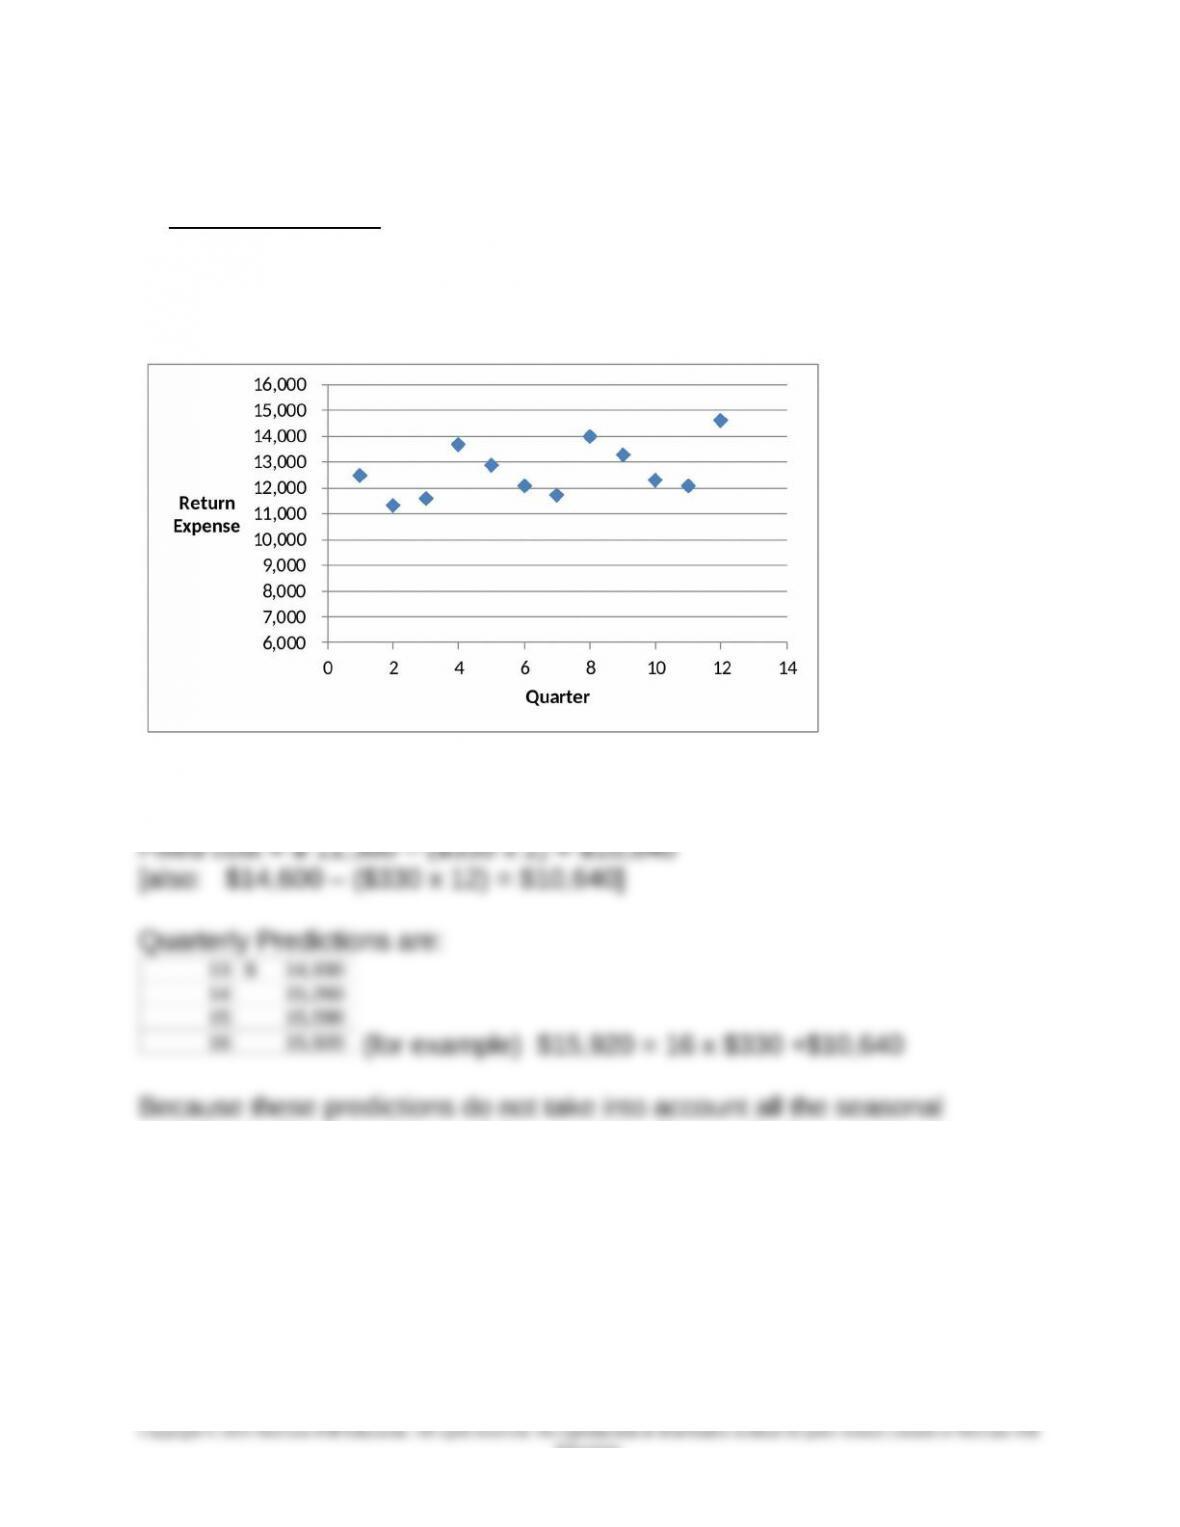
An examination of the exhibit below indicates that representative high
and low points are the last and second data points, respectively, so
these points are used to develop the high-low estimate.
Variable cost = ($14,600 – $11,300) ÷ (12 – 2) = $330.00
variation in the data, it is useful to consider the results for a regression
analysis, as shown below.
8-46
Education.
Chapter 08 – Cost Estimation
8-49 (continued -1)
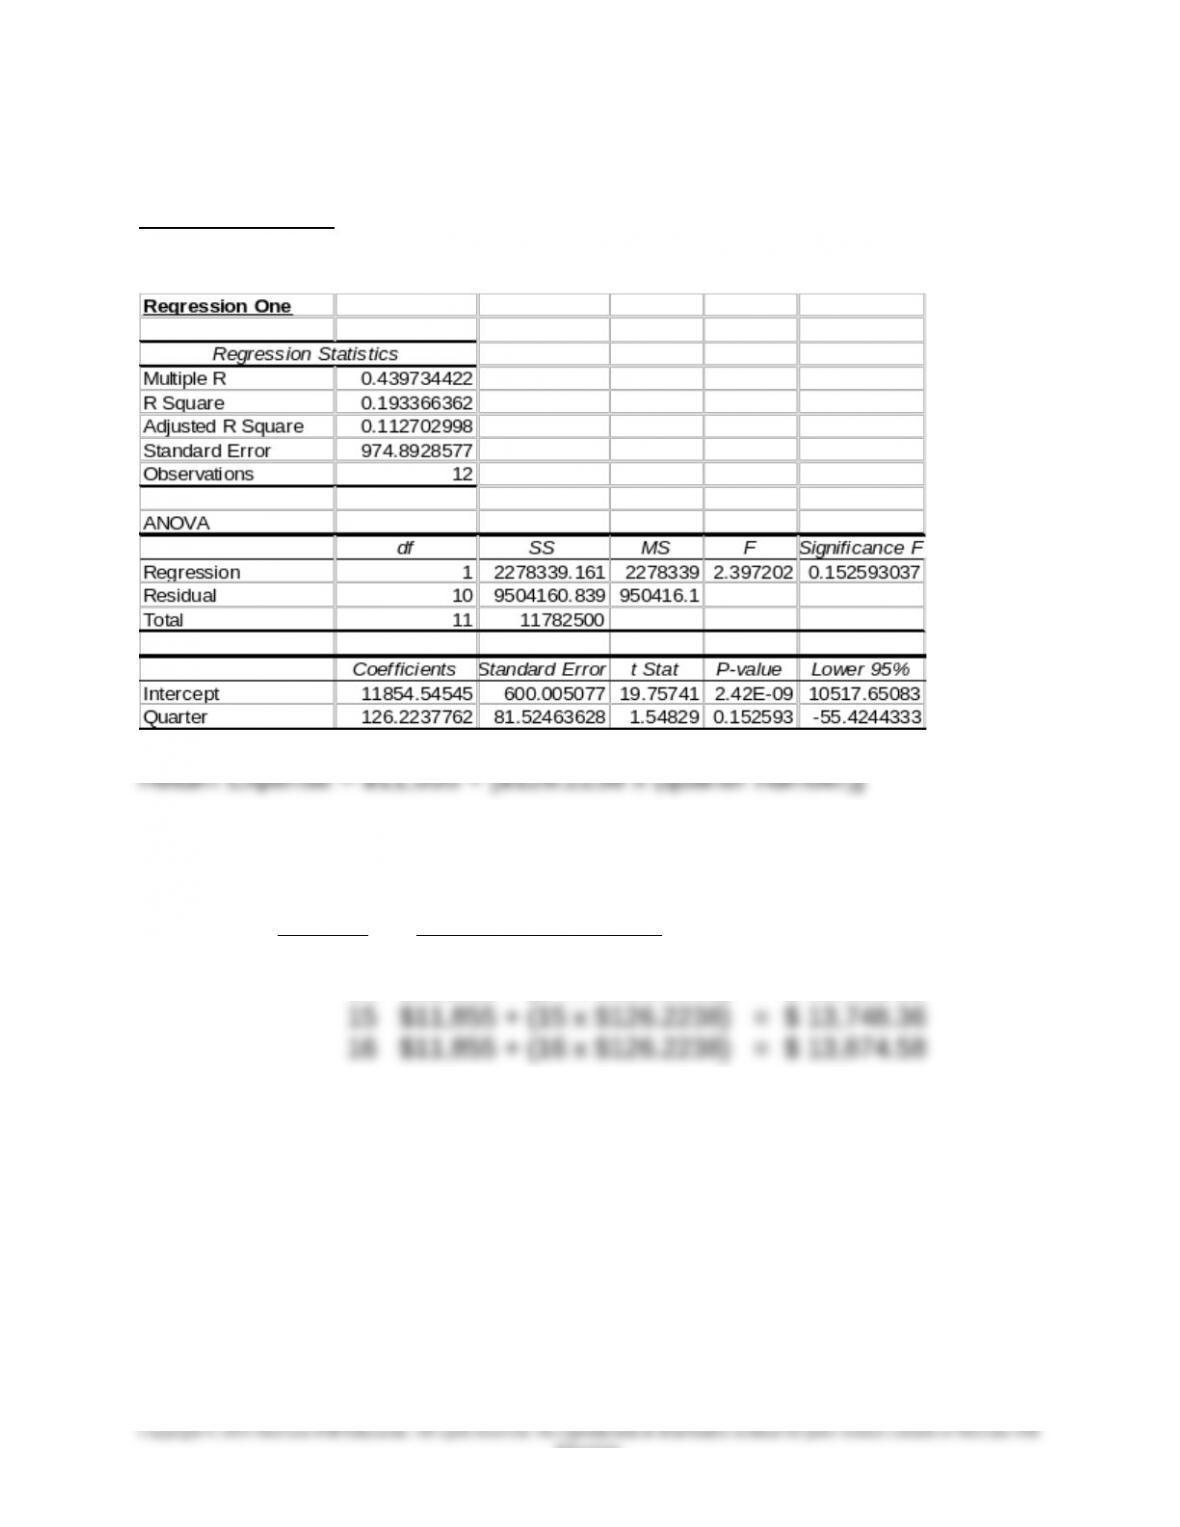
Regression One
The regression equation using a trend variable (1,2,3…) for each of the 12
quarters is as follows:
Predicted Expense for the next four quarters using regression analysis:
Quarter Regression Prediction
13 $11,855 + (13 x $126.2238) = $ 13,495.98
14 $11,855 + (14 x $126.2238) = $ 13,622.13
Note how significantly the predictions of the regression model differ from
that of the High-Low method.
8-47
Education.
Chapter 08 – Cost Estimation
8-49 (continued -2)
Noting that the above regression one has a relatively low R-squared of .19
and a relatively low t-value (1.55) for the independent variable (note that
the F value is not significant), we consider a revision of the regression
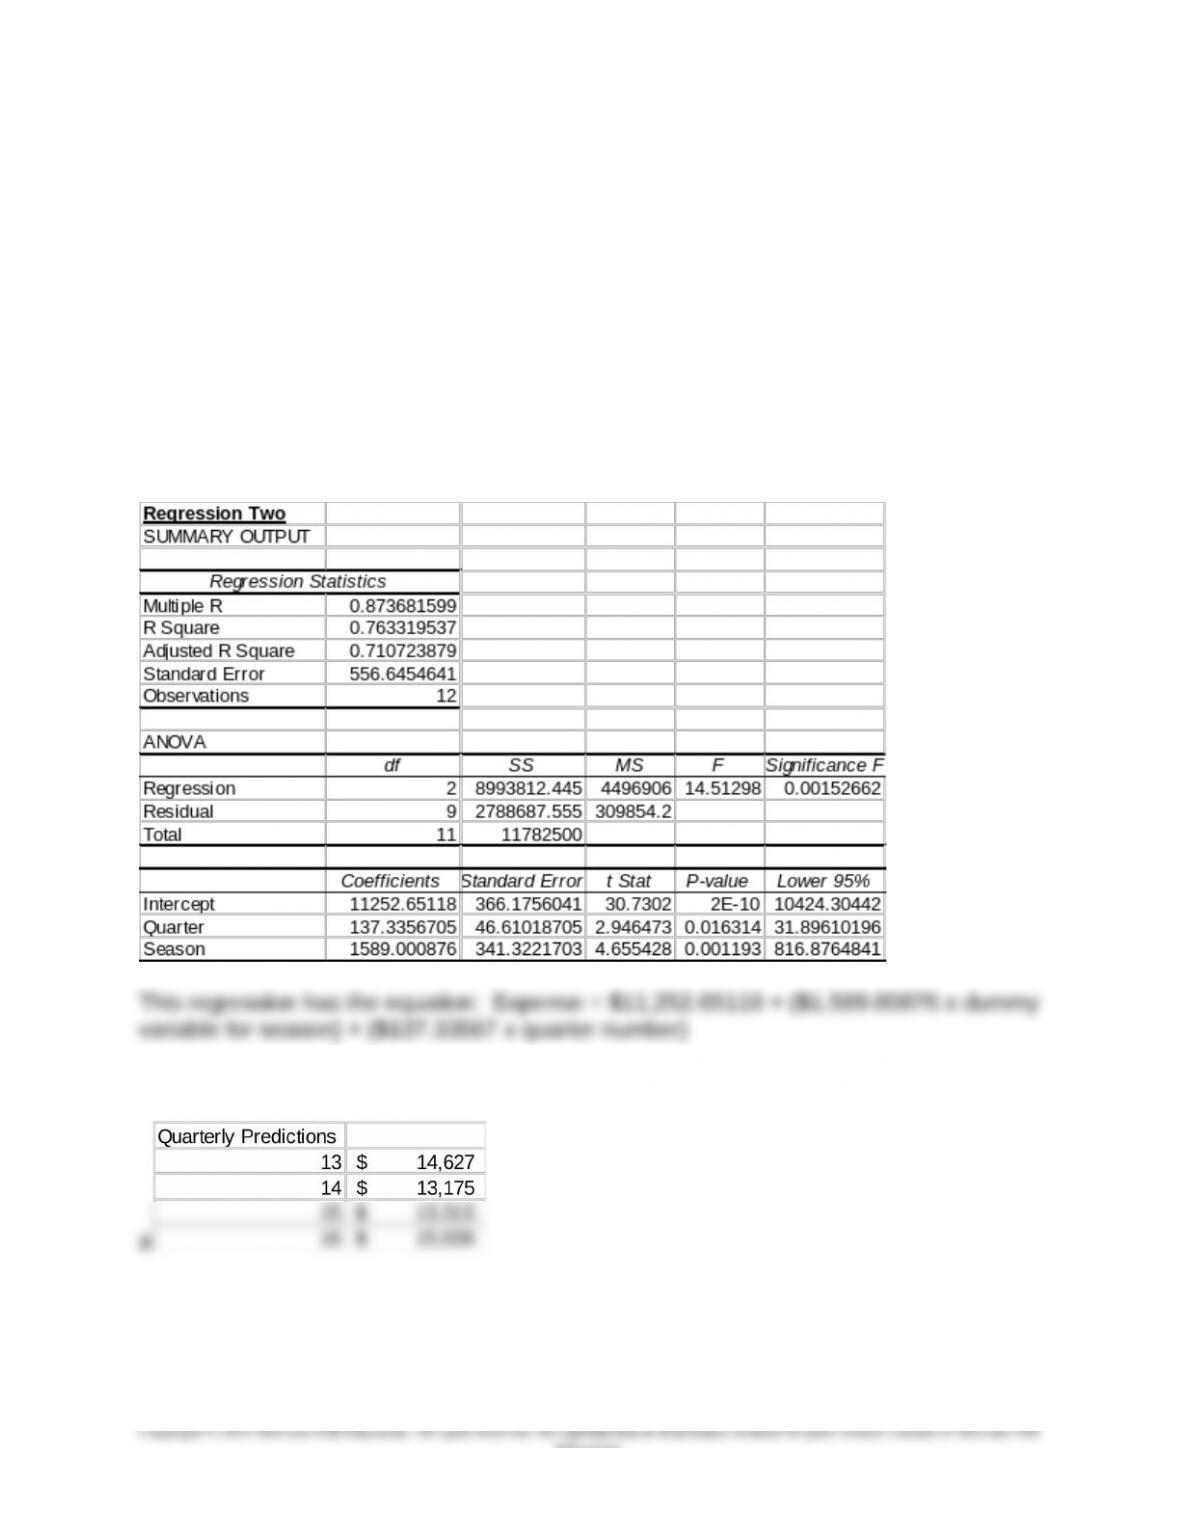
model. Since there is noticeable seasonality in the data (higher for periods
1,4,8 and 12, the last quarters of the year; see the above graph) it is
possible to improve on the regression model by adding a dummy variable
with 1s in the periods 4,8, and 12, and 0s in the remaining periods. The
regression analysis is below, which shows a much higher R squared,
improved SE, and a significant t-value for the dummy variable.
The regression predictions for the revised regression are as follows:
Because the second regression has better statistical measures, the
management accountant should rely on these predictions.
8-48
Education.
Chapter 08 – Cost Estimation
8-49 (continued -3)
2. If Lexon is involved in global production of its products, then expenses
incurred from returns must be analyzed by production facility, as these
8-49
Chapter 08 – Cost Estimation
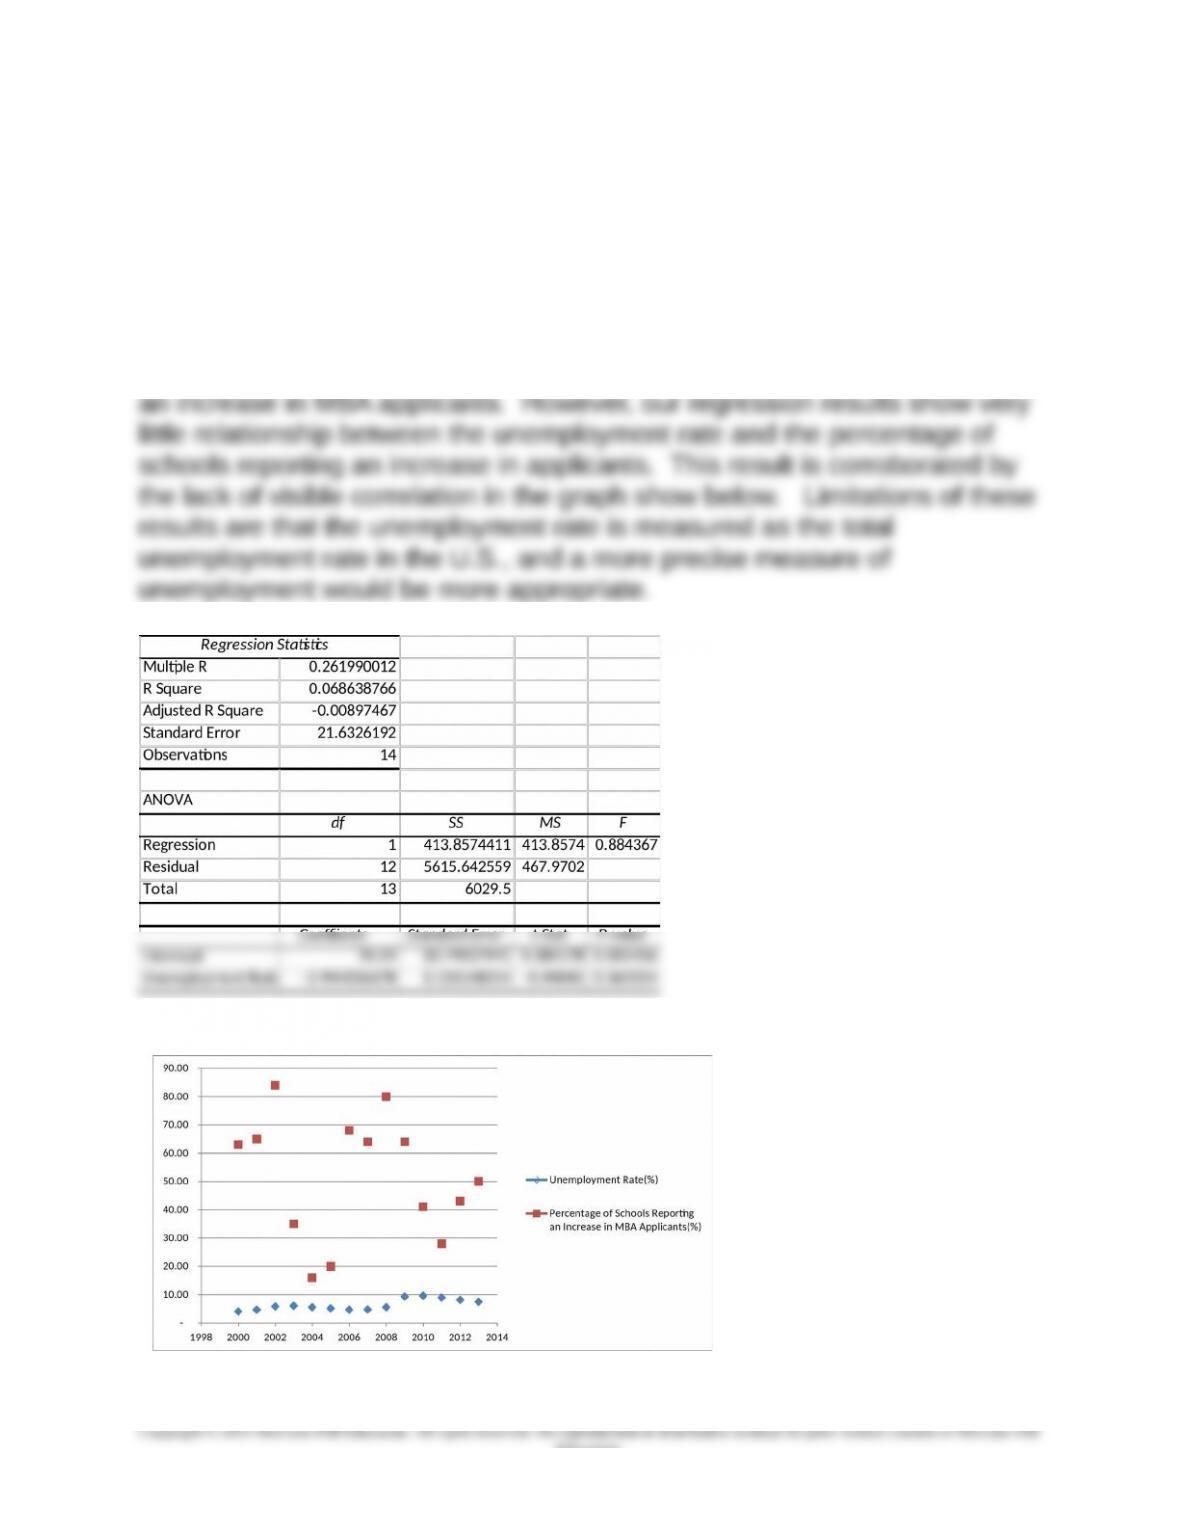
8-50 Regression; Applicants for M.B.A. Programs (50 min)
It has been argued that when unemployment rates increase there is also
an increase in applicants to MBA programs (Anjali Athavaley, “Escape
Route: Seeking Refuge in an M.B.A. Program,” The Wall Street Journal,
October 14, 2008, p. D1). Thus, we expect a positive relationship which
would confirm that an increase in the unemployment rate is associated with
8-50
Education.