Chapter 08 – Cost Estimation
8-42 (continued -1)
Cost equation using 10 openings as the cost driver (home 9):
Variable costs:
$4,700 – $3,242= $162
19 – 10
Fixed costs:
$4,700 = Fixed Cost + ($162 x 19)
Fixed Cost = $1,622
Equation for Home 9 (10 openings):
Total Cost = $1,622 + ($162 x no. of openings)
Predicted total cost for a 3,300 square foot house with 14 openings
using equation for square feet:
$560 + ($0.90 x 3,300) = $3,530
There is no simple method to determine which prediction is best
when using the High-Low method. In contrast, regression provides
quantitative measures (R-squared, standard error, t-values,…) to help
assess which regression equation is best. The regression for this
data has very good results with a 92% R-squared and both the
number of openings and square feet having a significant (at p=-05)
relationship with cost.
Predicted cost for a 2,400 square foot house with 8 openings, using
Equation One:
8-31
Education.
Chapter 08 – Cost Estimation
8-42 (continued -2)
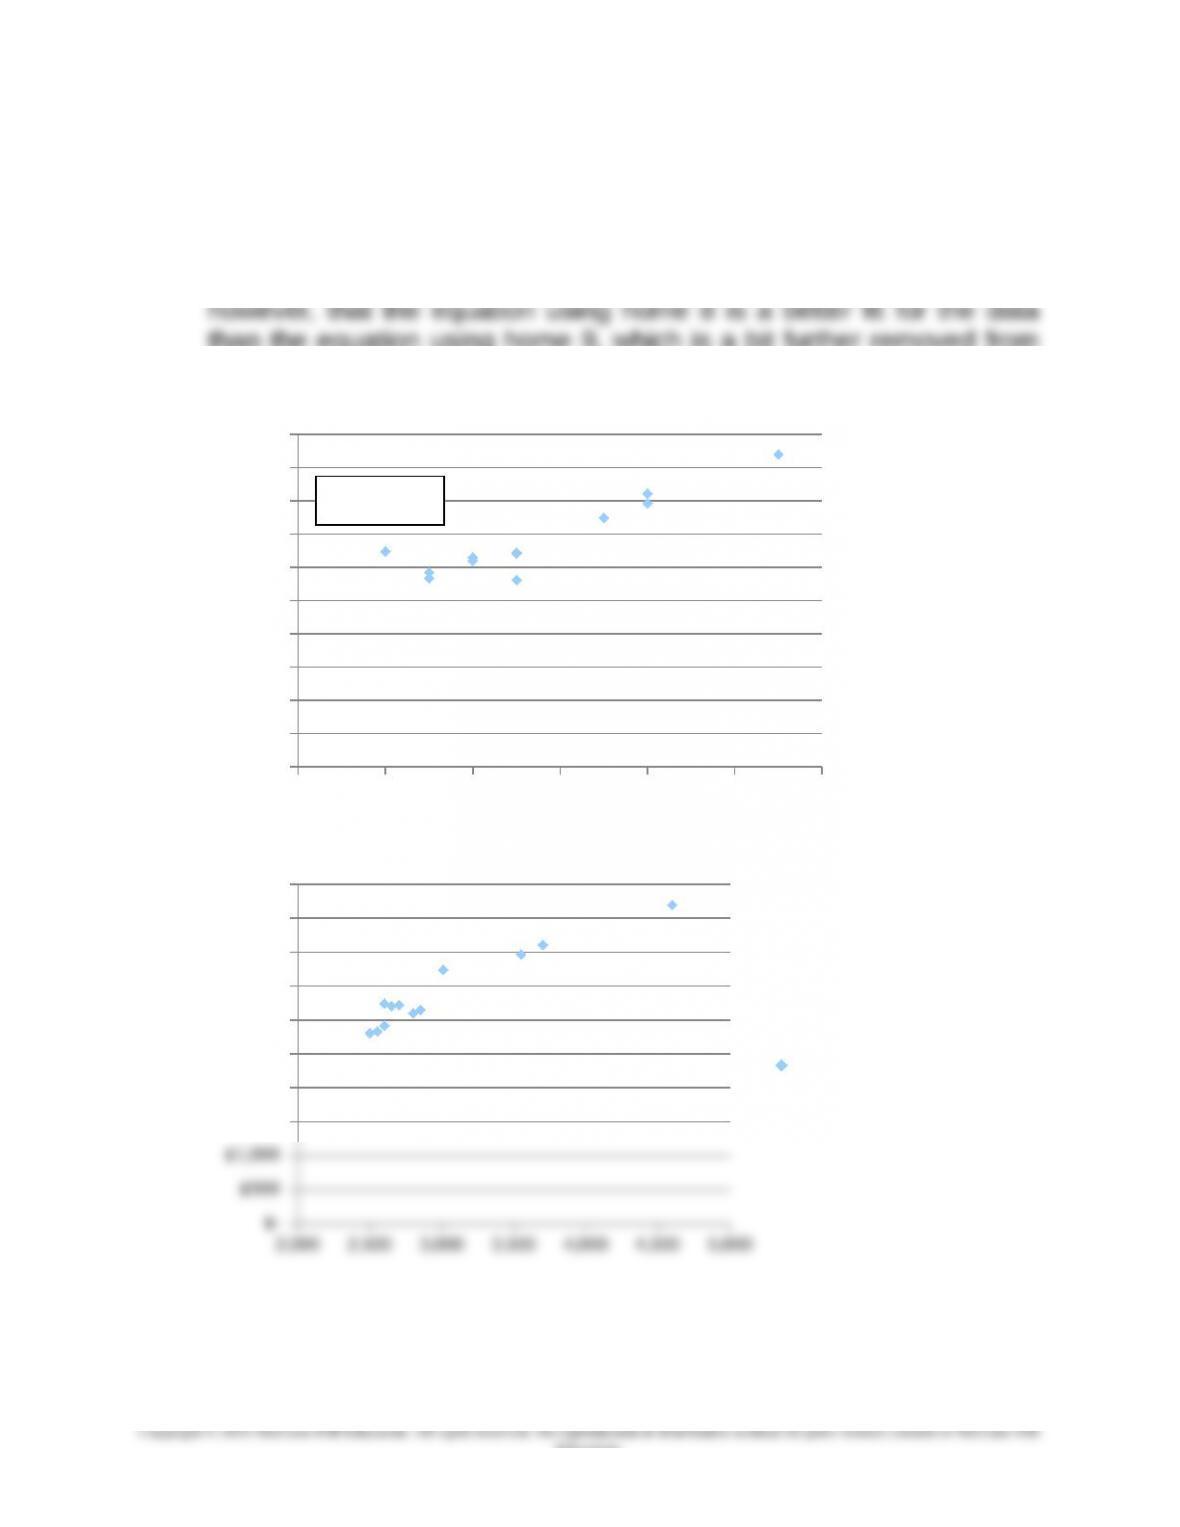
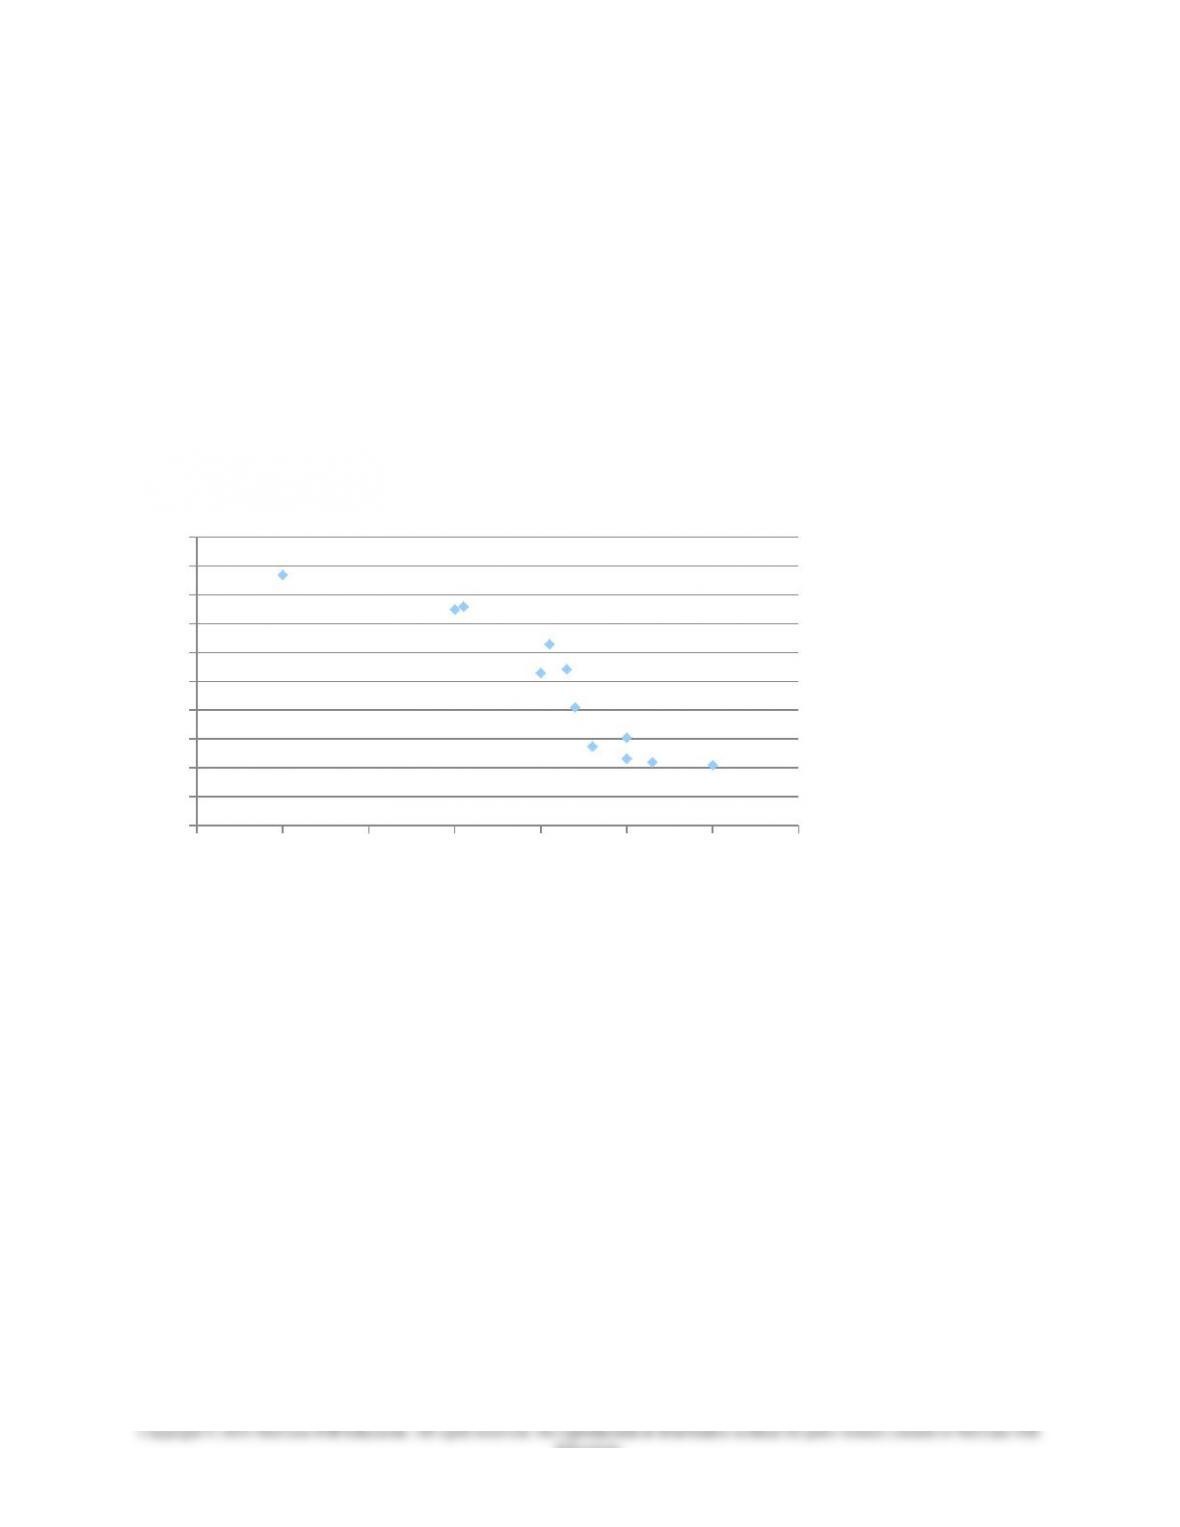
2. See accompanying graphs, which show that the relationship
between costs and square feet is relatively linear without outliers, as
is the relationship between costs and number of openings. Note that,
than the equation using home 9, which is a bit further removed from
the data. From this perspective, both variables are good cost drivers.
8 10 12 14 16 18 20
$-
$500
$1,000
$1,500
$2,000
$2,500
$3,000
$3,500
$4,000
$4,500
$5,000
2,000 2,500 3,000 3,500 4,000 4,500 5,000
$-
$500
$1,000
$1,500
$2,000
$2,500
$3,000
$3,500
$4,000
$4,500
$5,000
Cost
8-32
Education.
Home 9
Chapter 08 – Cost Estimation
8-42 (continued – 3)
3.
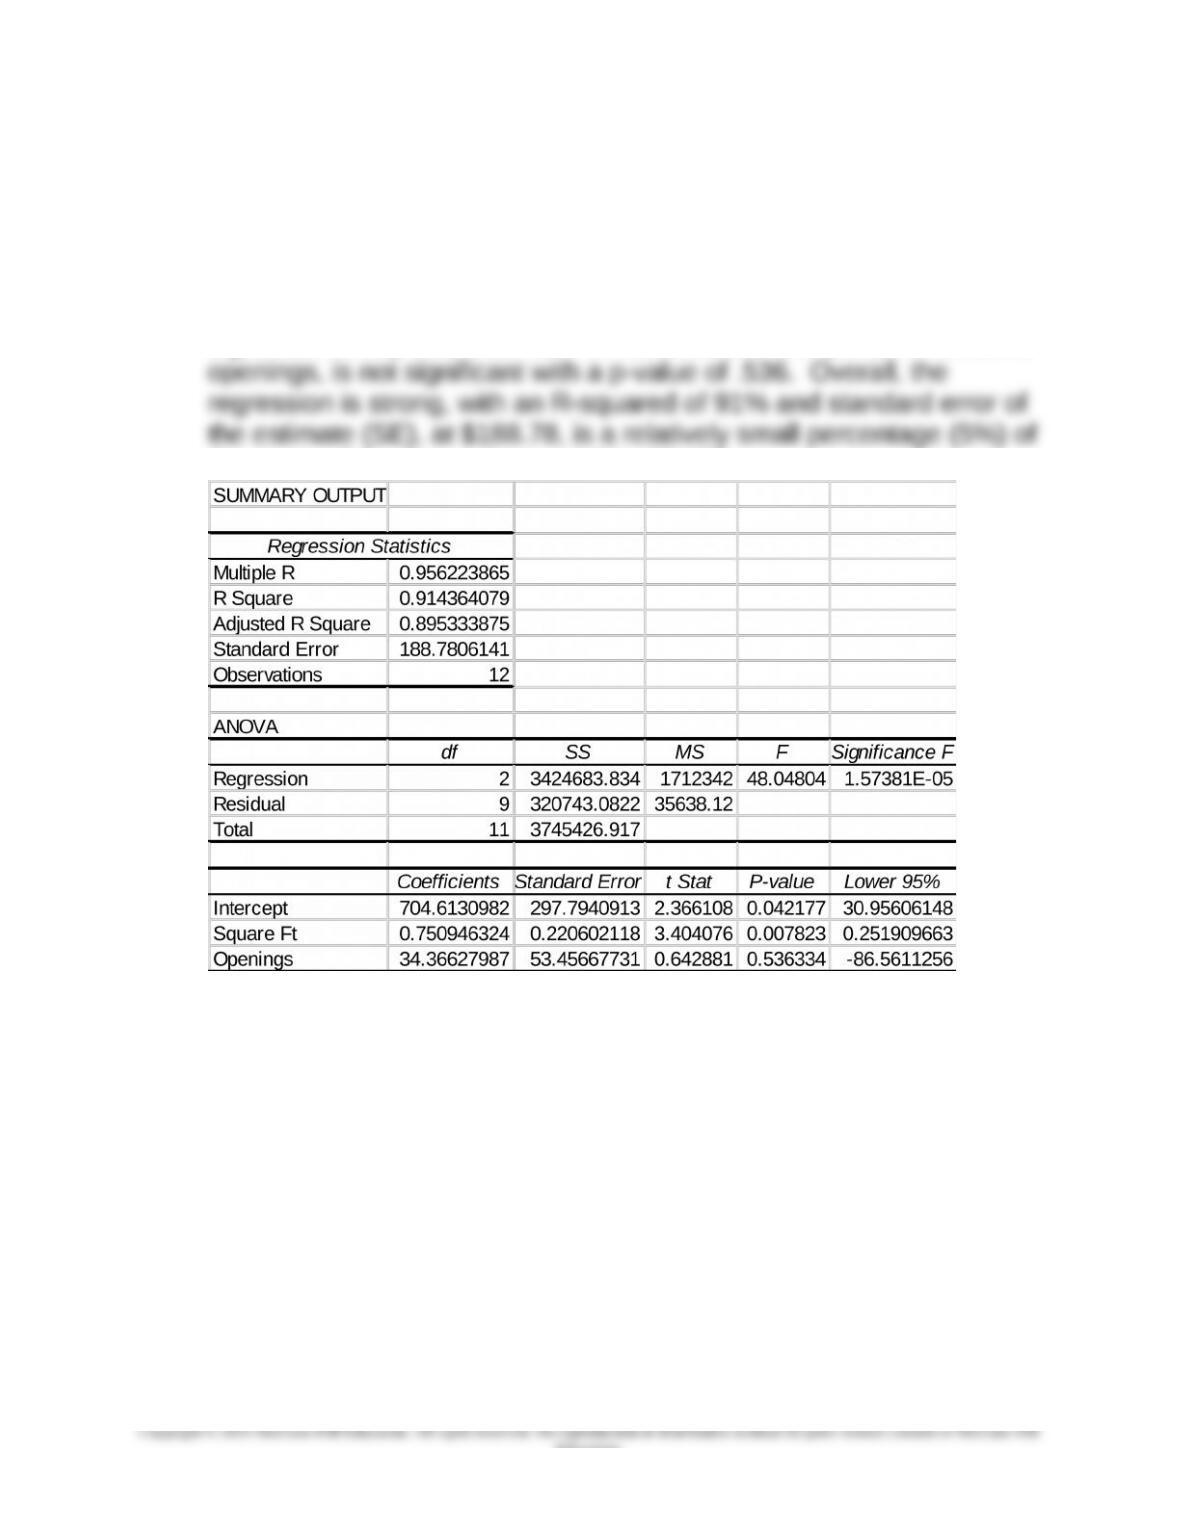
The regression analysis results are shown below. Note that t-value
and related p-value for the independent variable, square feet, are
significant with p less than .05. In contrast, the independent variable,
the mean of the dependent variable, $3,425
8-33
Education.
Chapter 08 – Cost Estimation
8-42 (continued – 4)
4.
The Davis company is likely to have a number of sustainability issues
in its business. As a company that renovates older homes, it must
frequently deal with hazardous materials such as asbestos used in
siding and other construction materials decades ago. Current
construction codes require renovations of older homes to treat the
hazardous materials with special, sometimes expensive procedures.
promotes the safety and comfort of the homeowners.
The role of cost estimation is important when a construction company
such as the Davis Company must accurately budget costs for
renovations in making bids and in dealing with the occasional
unexpected problems. Careful cost estimates can help Davis to
8-34
Education.
Chapter 08 – Cost Estimation
8-43 Cost Estimation; Machine Replacement; Ethics (25 min)
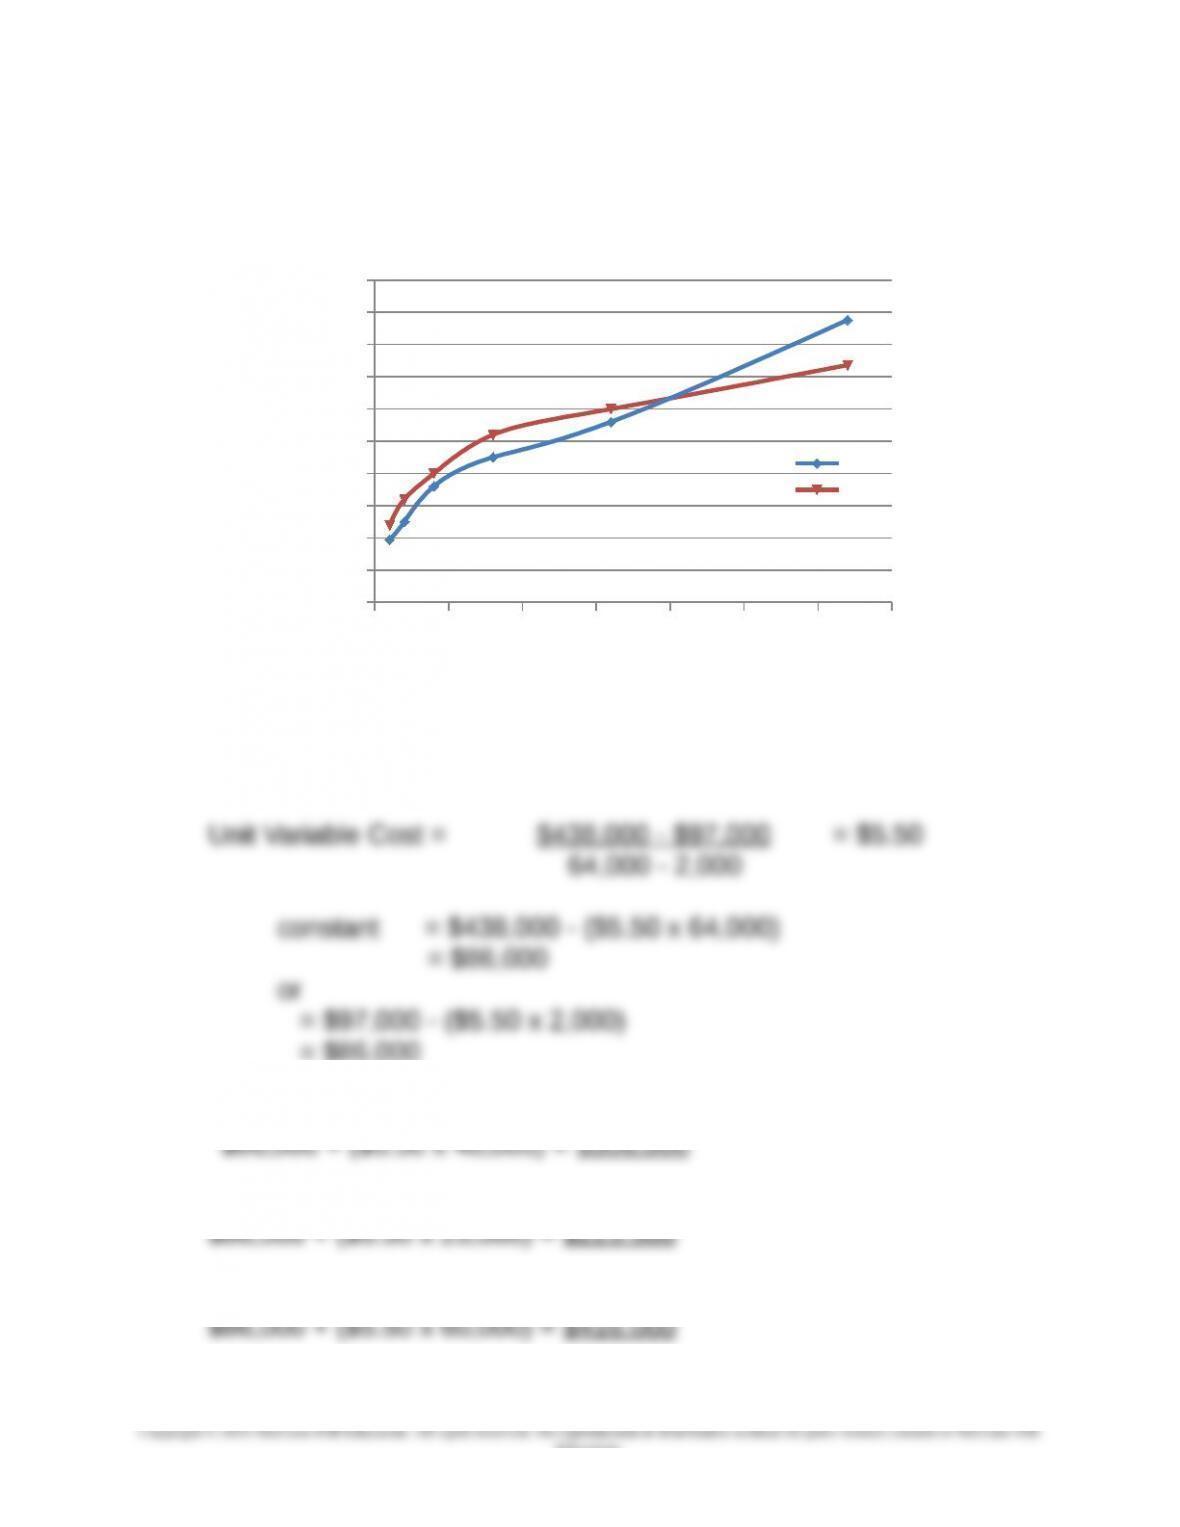
1. A graph of the data shows no significant outliers nor nonlinear
relationships. See below
– 10,000 20,000 30,000 40,000 50,000 60,000 70,000
–
50,000
100,000
150,000
200,000
250,000
300,000
350,000
400,000
450,000
500,000
Machine A
Machine B
Output
Cost
Using the High-Low method:
Machine A:
= $86,000
The estimate for total costs at 40,000 square yards is:
At 25,000 yards:
At 60,000 yards:
8-35
Education.
Chapter 08 – Cost Estimation
8-43 (continued -1)
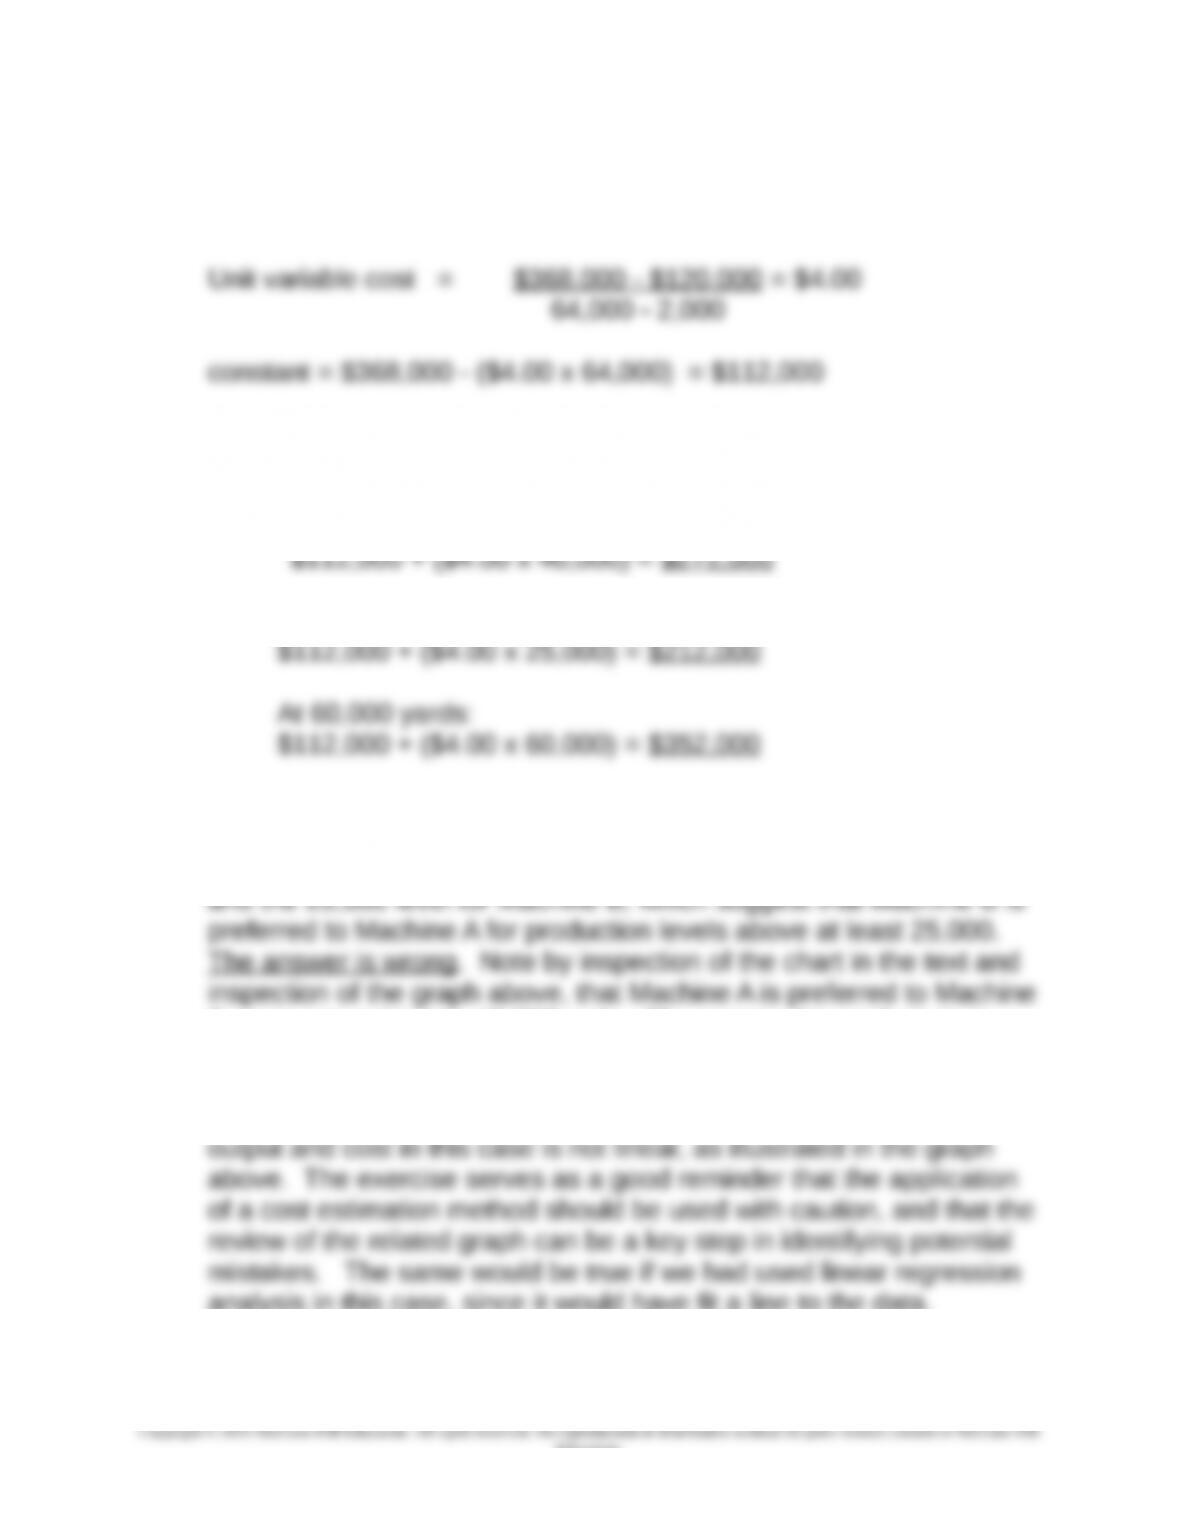
Machine B:
or
= $120,000 – ($4.00 x 2,000) = $112,000
The estimate for total costs at 40,000 square yards is:
At 25,000 yards:
The calculations show that the costs are lower at both the 40,000
B up to approximately 40,000 units. The error in the analysis is in
using the High-Low method for cost estimation in this particular case.
The High-Low method derives a linear relationship from the least to
the largest level of output, while in fact the relationship between
analysis in this case, since it would have fit a line to the data.
8-43 (continued -2)
8-36
Education.
Chapter 08 – Cost Estimation
2. The ethical issue presented in this case should be addressed using
the approach described in chapter 1. Here it seems important to
consider the nature and extent of the effect of the defect on
customers and also Hardison. Since the glass is used in office
buildings, and defects are likely to affect the safety of those using the
3. In addition to the costs of the machine, Hardison should be aware
of any import duties or restrictions for the purchase of the machines
from Germany or Canada. How will these restrictions and duties, if
any, affect the cost and availability of the machine? What are the
8-37
Education.
Chapter 08 – Cost Estimation
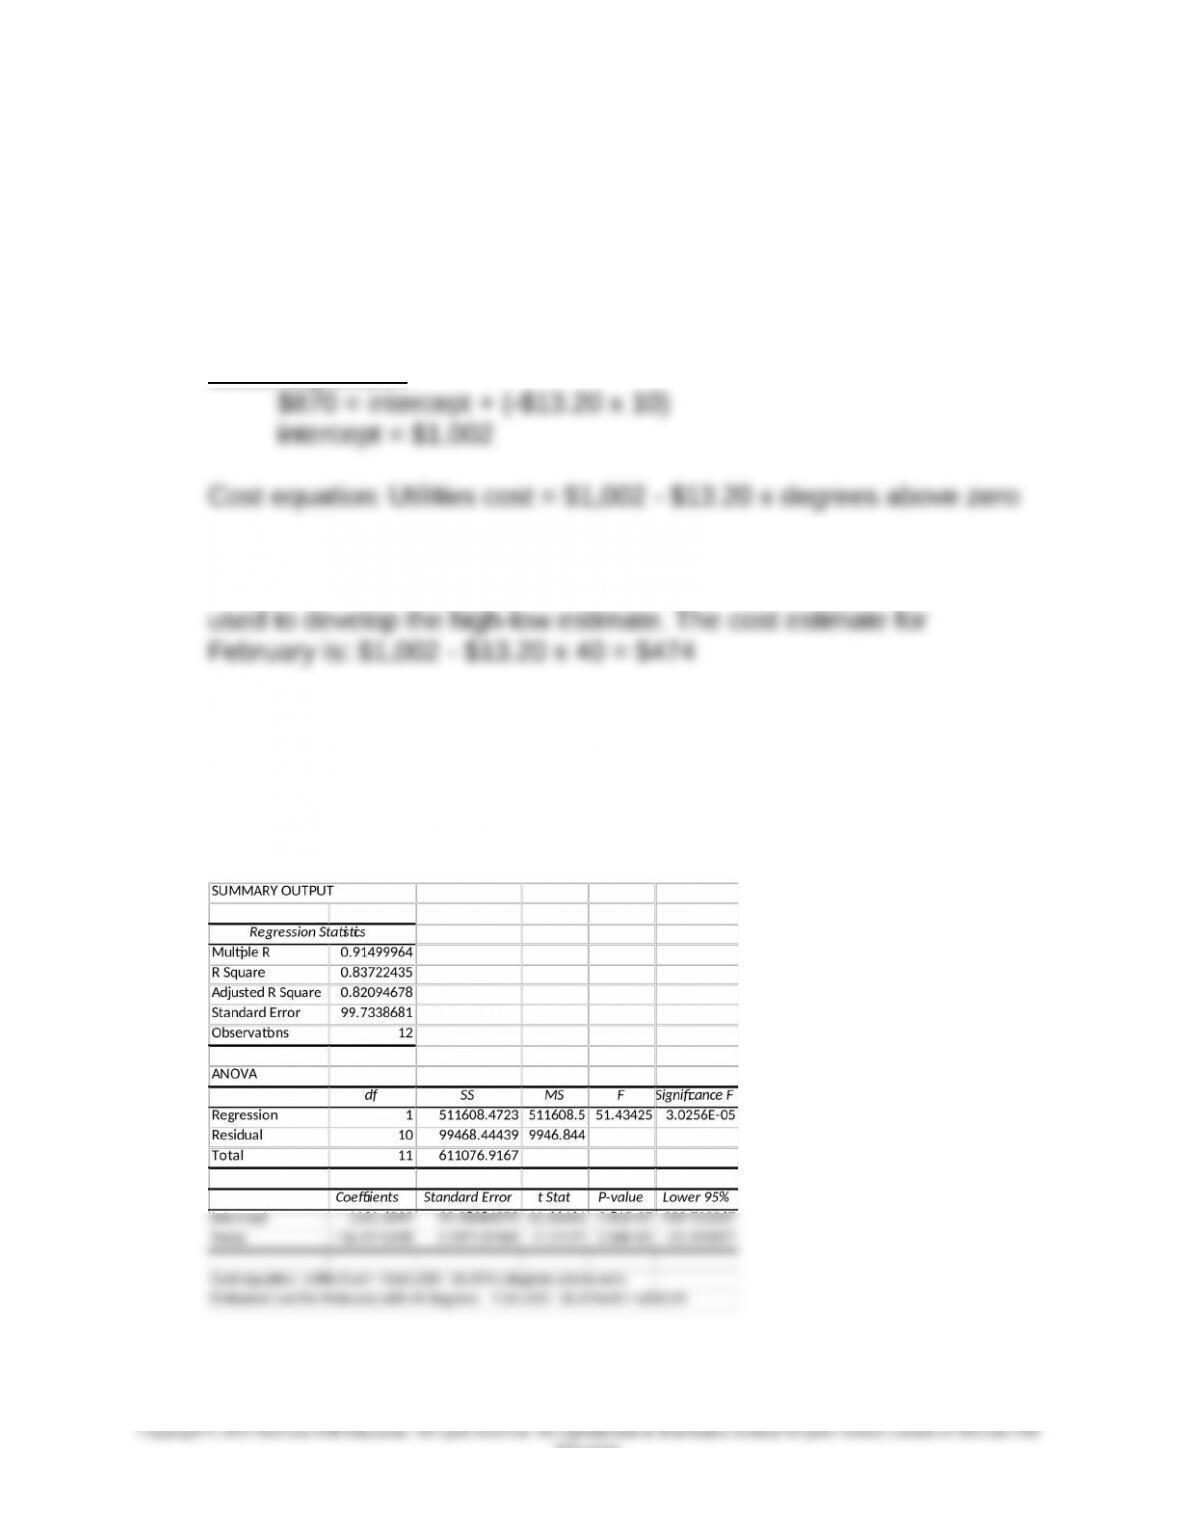
8-44 Cost Estimation; High-Low Method (25 min)
Estimated cost of electricity equals $210 (from information about
August)
($870 – $210) ÷ (10 – 60) = – $13.20 /degree
At 20 degrees F:
A cost estimate for January is not available since the expected
temperature of 5 degrees is outside the relevant range of the data
Note to instructor: the problem can also be solved using regression
analysis, as shown below. Note that the R-squared is good, but the
SE is relatively large, at almost 100, or 20% of the average for the
dependent variable. Also, the predicted cost, $502.65, differs from
the High-Low method ($474, per above), but not significantly.
8-38
Education.
Chapter 08 – Cost Estimation
8-44 (continued -1)
A key point to understand whether the high-low or the regression model is
used is that the underlying relationship between cost and temperature is
not linear. The high-low and regression methods attempt to fit a line to this
nonlinear relationship, and inaccuracies are inevitable (as suggested by the
high SE in the regression).
The cost/temperature relationship is shown in the chart below:
0 10 20 30 40 50 60 70
0
100
200
300
400
500
600
700
800
900
1000
Cost
8-39
Education.
Chapter 08 – Cost Estimation
8-45 Regression Analysis; Evaluating Regression Equations (20 min)
1. The Pilot Shop should adopt regression 2 to forecast total shipping
department costs for the following reasons:
a. R-squared, the coefficient of determination (the proportion of the
variance explained by the independent variable), is higher for
regression 2.
b. The standard error of the estimate, which is a measure of the
2. Since the number of orders to be shipped next week is given, the
appropriate estimation model is regression 2, and the total estimated
SC = $2,994.90
3. An important limitation of the regression we have chosen is that we
have not been able to assess the potential for nonlinearity in the
relationships among the variables. The presence of nonlinear
relationships can be assessed by examining the Durbin-Watson
statistic and/or by examining the graphs of the data. One of
Shephard’s first tasks should be to examine for potential nonlinearity
in the data.
Another limitation Shephard should consider is the potential for
8-40
Education.