Chapter 5 – Activity-Based Costing and Customer Profitability Analysis
Chapter 5
Activity-Based Costing and Customer Profitability Analysis
Teaching Notes for Cases
5-1 Blue Ridge Manufacturing (Activity-Based Costing for Marketing Channels)
Case Description:
Blue Ridge Manufacturing produces and sells towels for the U.S. “sport towel” market. A “sport towel” is
a towel that has the promotion of an event or a log printed on it. Most often they are used in connection
with major sporting events such as the Super Bowl.
Case Writers: Paul E. Juras and Paul A. Dierks, Wake Forest University; written for the IMA 1994 Student
Case Competition
Teaching Objectives:
The main teaching objective of the case is to illustrate, with an extensive numerical exercise, the use of
value chain analysis for profitability analysis. The analysis follows an ABC model, in which selling and
administrative costs are allocated to customer groups for the purpose of analyzing customer profitability.
Main Points:
Activity-Based Costing
Value Chain Analysis
Customer profitability analysis
Discussion Questions:
1. What is Blue Ridge’s competitive strategy?
The current strategy appears to be a combination of focus (on the southeast states) and cost
leadership. The manufacturing is in a modern plant with upgraded facilities, including the use of ABC
costing for manufacturing costs and the commitment to introducing advanced manufacturing
to be moving to a differentiation strategy. Further evidence of this is the firm is “going national,” it will
focus more on quality, and is interested in identifying the least profitable customers. All this suggests
efforts to differentiate the firm from its competitors.
The case does not provide sufficient information for a thorough strategic analysis. However, the
student’s should be expected to identify strategic issues, as noted above, and also:
a) Is the new ink patented? How soon are competitors expected to meet this new innovation?
b) Are Blue Ridge’s licenses with the sports teams of unique value, or do competitors have the
same access as Blue Ridge?
c) How strong are Blue Ridge’s ties to its customers, especially the large customers? Are these
ties sufficiently strong to protect against competition for the next few years?
d) Has Blue Ridge integrated the marketing and manufacturing strategies, so that they are
consistent? Given the changes in both manufacturing (new ink) and marketing (going national, seeking
more profitable customers), the integration of these functions is important.
2. What type of cost system does Blue Ridge use, and is it consistent with their strategy?
The ABC costing system in use is consistent with the cost leadership strategy. It will also assist
5-1
3. What is Blue Ridge likely to gain from a value chain analysis? What are some of the opportunities for
cost reduction and for value added for the customers?
The value chain analysis can help Blue Ridge better understand its competitive advantage and to
identify opportunities for improving its competitive position.
Cost reduction:
– Can Blue Ridge obtain better terms or prices from its suppliers? Materials cost represents a large
share of total manufacturing cost.
– Use profitability analysis (as illustrated in the computer exercise below) to determine the “full”
costs of each product line and customer group as a basis for identifying and focusing on the most profitable
product lines and customers.
– Technical support requirements
(Does Blue Ridge do design or other service for any of the customers, and if so are they properly charged to
the customer?)
Value Added for Customers
– Develop service links with the larger customers, as in the case of Proctor and Gamble and Wal-Mart;
where the retailer and manufacturer share data so that the manufacturer knows when, where and what to
Computer Assignment:
Develop a spreadsheet analysis, which can be used to assess the profitability of the three customer groups
of Blue Ridge — large, medium and small customer account size. Use the information in Tables 1-4 to trace
and allocate the costs necessary for the analysis.
The solution is shown on the attached spreadsheet. The solution process involves three stages:
Stage 1: Allocate SG & A Costs to SG & A Activities.
1. Collect all SG & A costs incurred in each function (Shipping, Sales, Marketing) as showed in
Table 4A of the case.
2. For each function, collect usage % for each activity (Entering P.O., Commissions, Shipping,
Invoicing, Making Sales Calls, Checking Credit, Samples & Catalog Information, Special
Handling, Distribution Management, Marketing by Customer Type, Advertising & Promotion,
Marketing, Administrative Office Support, and Licenses & Fees) as shown in 4A.
3. Then, allocate function costs to activities by usage %.
Stage 2: Allocate activity costs to Customer Type (Large, Medium, Small).
1. Identify cost drivers (as shown in Table 4) and their consumption statistics for each customer
type (as shown in Table 1).
2. Calculate cost driver consumption % for each customer type.
3. Allocate activity costs to customer type.
5-2
Chapter 5 – Activity-Based Costing and Customer Profitability Analysis
Stage 3: Customer Profitability Analysis.
1. Calculate revenues for each customer group (sales quantities from Table 1 and unit prices
from Table 2).
2. Calculate manufacturing cost (Regular, Mid-size, Hand, Special), customizing cost (Inking,
Embroidery, Dyeing), SG & A cost and total costs for each customer group (using data from
Tables 1 & 2).
3. Calculate customer profits ($102,661, $49,742, -$4,828) and profit per customer ($12,833,
$323, -$6) for each customer type.
Note that the analysis makes it clear the group of large customers provide most of the profits for
Blue Ridge. Show how the cost of purchase orders, shipping, the medium and small customer groups
predominantly cause credit checks, advertising, and marketing. The analysis shows clearly that these two
groups, on a per customer basis, are marginally profitable. This analysis indicates that Blue Ridge should
5-3
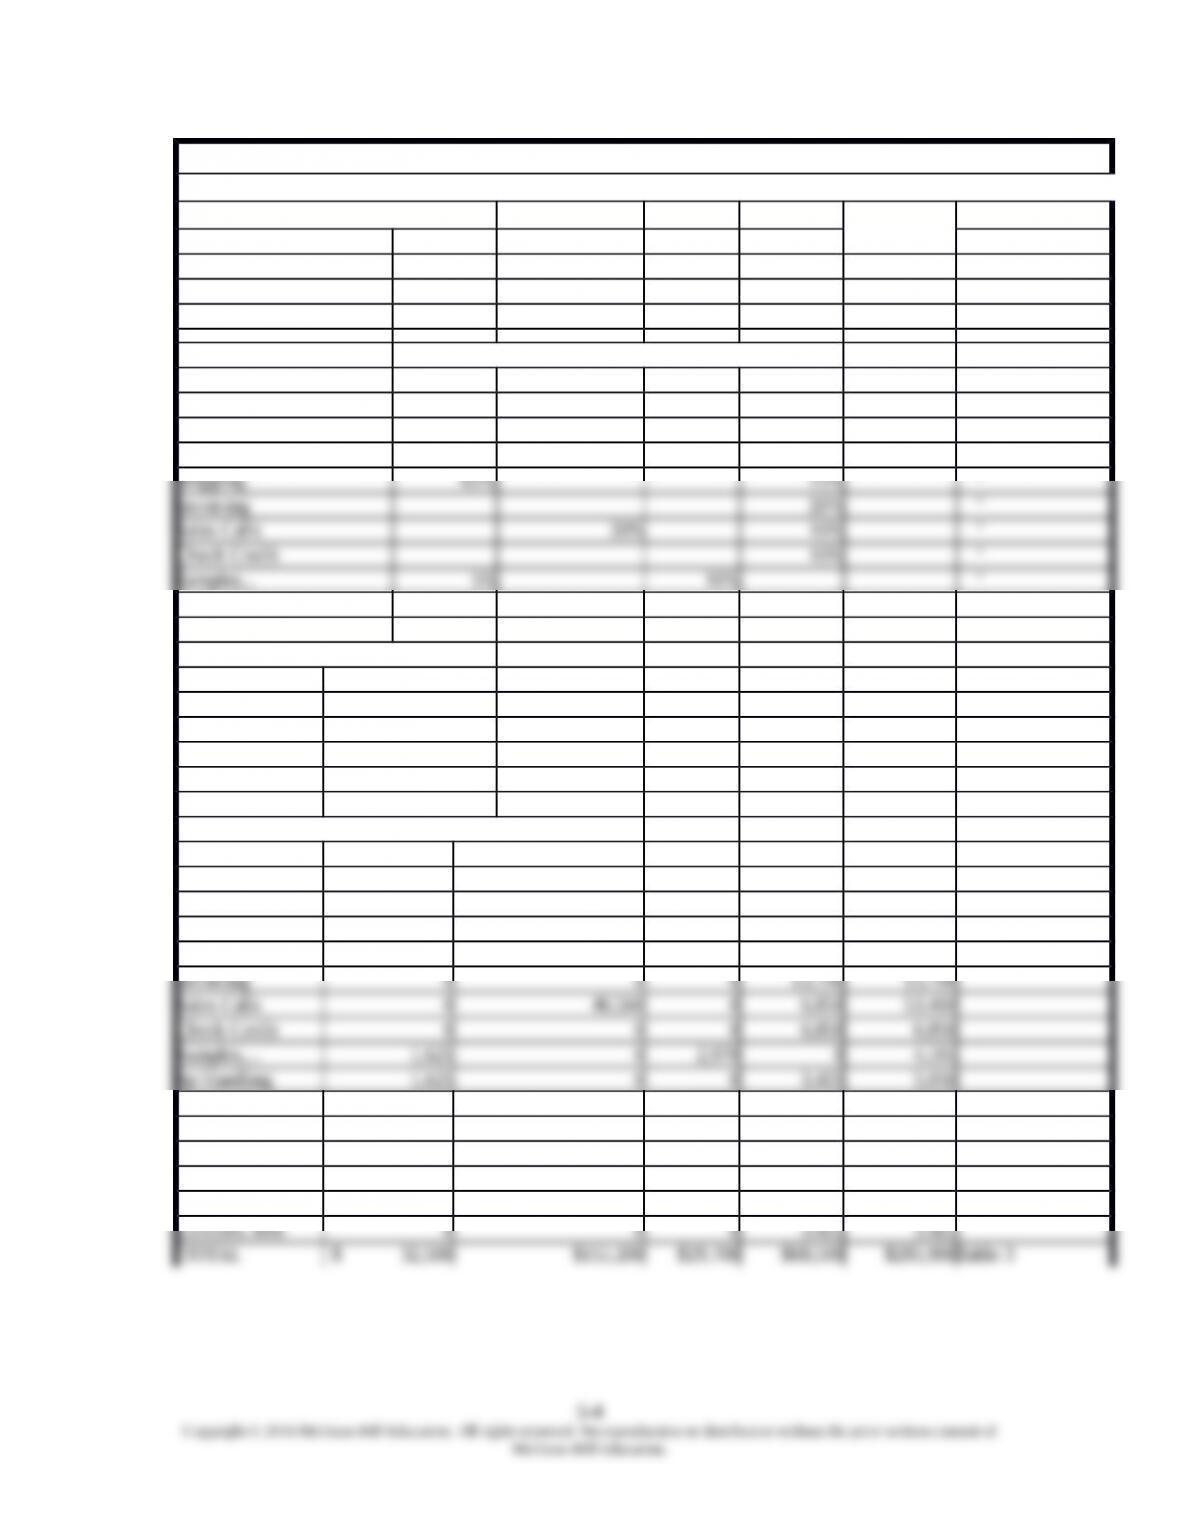
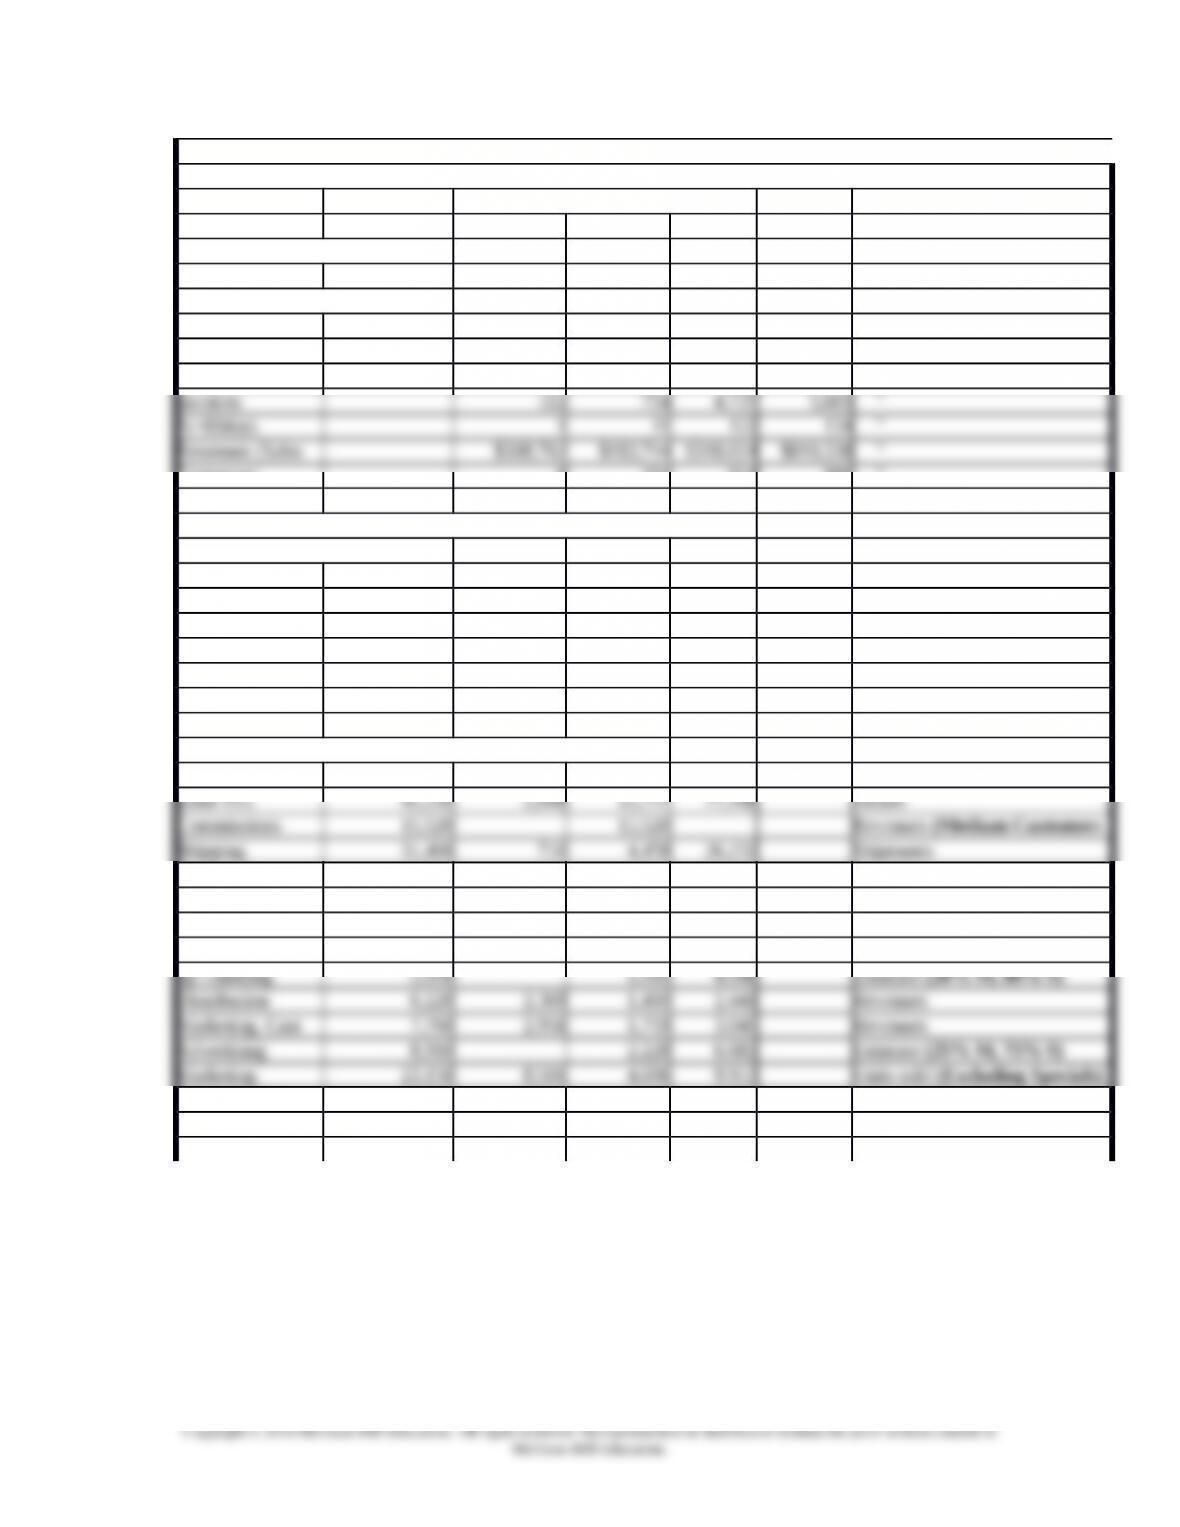
Chapter 5 – Activity-Based Costing and Customer Profitability Analysis
Blue Ridge Manufacturing
First Stage Allocation: Allocate SG&A Costs to SG&A Activities
First: SG&A Costs Total
Assigned
Shipping Sales Marketing Other Source
Administration 17,000 37,400 20,400 56,100 130,900Table 3
Selling 15,500 117,800 9,300 12,400 155,000Table 3
$32,500 $155,200 $29,700 $68,500 $285,900
Percentage of…
Second: SG&A Shipping Sales Marketing Other
ACTIVITIES
Enter P.O. 55% 10% Table 3
Commissions 10% “
Sp Handling 5% 5% “
Distribution 10% 10% “
Marketing, Customer 5% “
Advertising 30% “
Marketing 15% 50% 5% “
Administrative 20% “
Licenses, fees 0% 5% “
TOTAL 100% 100% 100% 100% “
Third: Allocate Costs to Activities
Shipping Sales Marketing Other Total
Assigned
ACTIVITIES
Enter P.O. 0 85,360 0 6,850 92,210
Commissions 0 15,520 0 0 15,520
Shipping 21,125 0 0 10,275 31,400
Distribution 3,250 0 2,970 0 6,220
Marketing, Cust 0 7,760 0 0 7,760
Advertising 0 0 8,910 0 8,910
Marketing 4,875 0 14,850 3,425 23,150
Administrative 0 0 0 13,700 13,700
Chapter 5 – Activity-Based Costing and Customer Profitability Analysis
Second Stage Allocation: Allocates SA&A Activities to Customer Type (Large, Medium, Small)
First: Identify Cost Driver and Its Consumption Level or Amount
Customer Type…
COST DRIVER Large Medium Small Total
Units sold- w/o specials 99,770 55,118 116,812 271,700
Units sold-Total 100,250 58,544 117,406 276,200 Table 1
Units embroidered 5,959 6,490 29,394 41,843 “
Units dyed 20,536 9,935 12,328 42,799 “
Orders 133 845 5,130 6,108 “
Shipments 147 923 5,431 6,501 “
Value)
Customers 8 154 824 986 “
Second: Calculate Cost Driver Percentage for Each Customer Type
Units sold (excl. Special) 0.367 0.203 0.430 1.000From above
Orders 0.022 0.138 0.840 1.000From above
Shipments 0.023 0.142 0.835 1.000From above
Invoices 0.020 0.135 0.845 1.000From above
%>60days 0.007 0.082 0.910 1.000From above
Revenues 0.381 0.227 0.392 1.000From above
Customers 0.008 0.156 0.836 1.000From above
Third: Allocate Activity Costs to Customer Type Cost Driver/ Allocation Base
ACTIVITIES Total Cost Large Medium Small (Table 4)
(Medium Customers
only)
Invoicing 13,700 274 1,844 11,583 Invoices
Sales Calls 53,410 53,410 Revenues (Large
Customers only)
Check Credit 6,850 51 562 6,237 %>60days
Samples… 4,595 1,750 1,042 1,803 Revenues
Administrative 13,700 5,031 2,779 5,890 Units sold (Excluding Specials)
Licenses, fees 3,425 3,425 Revenues
(Medium Customers
only)
TOTAL 285,900 77,060 53,490 155,350 AA
5-5
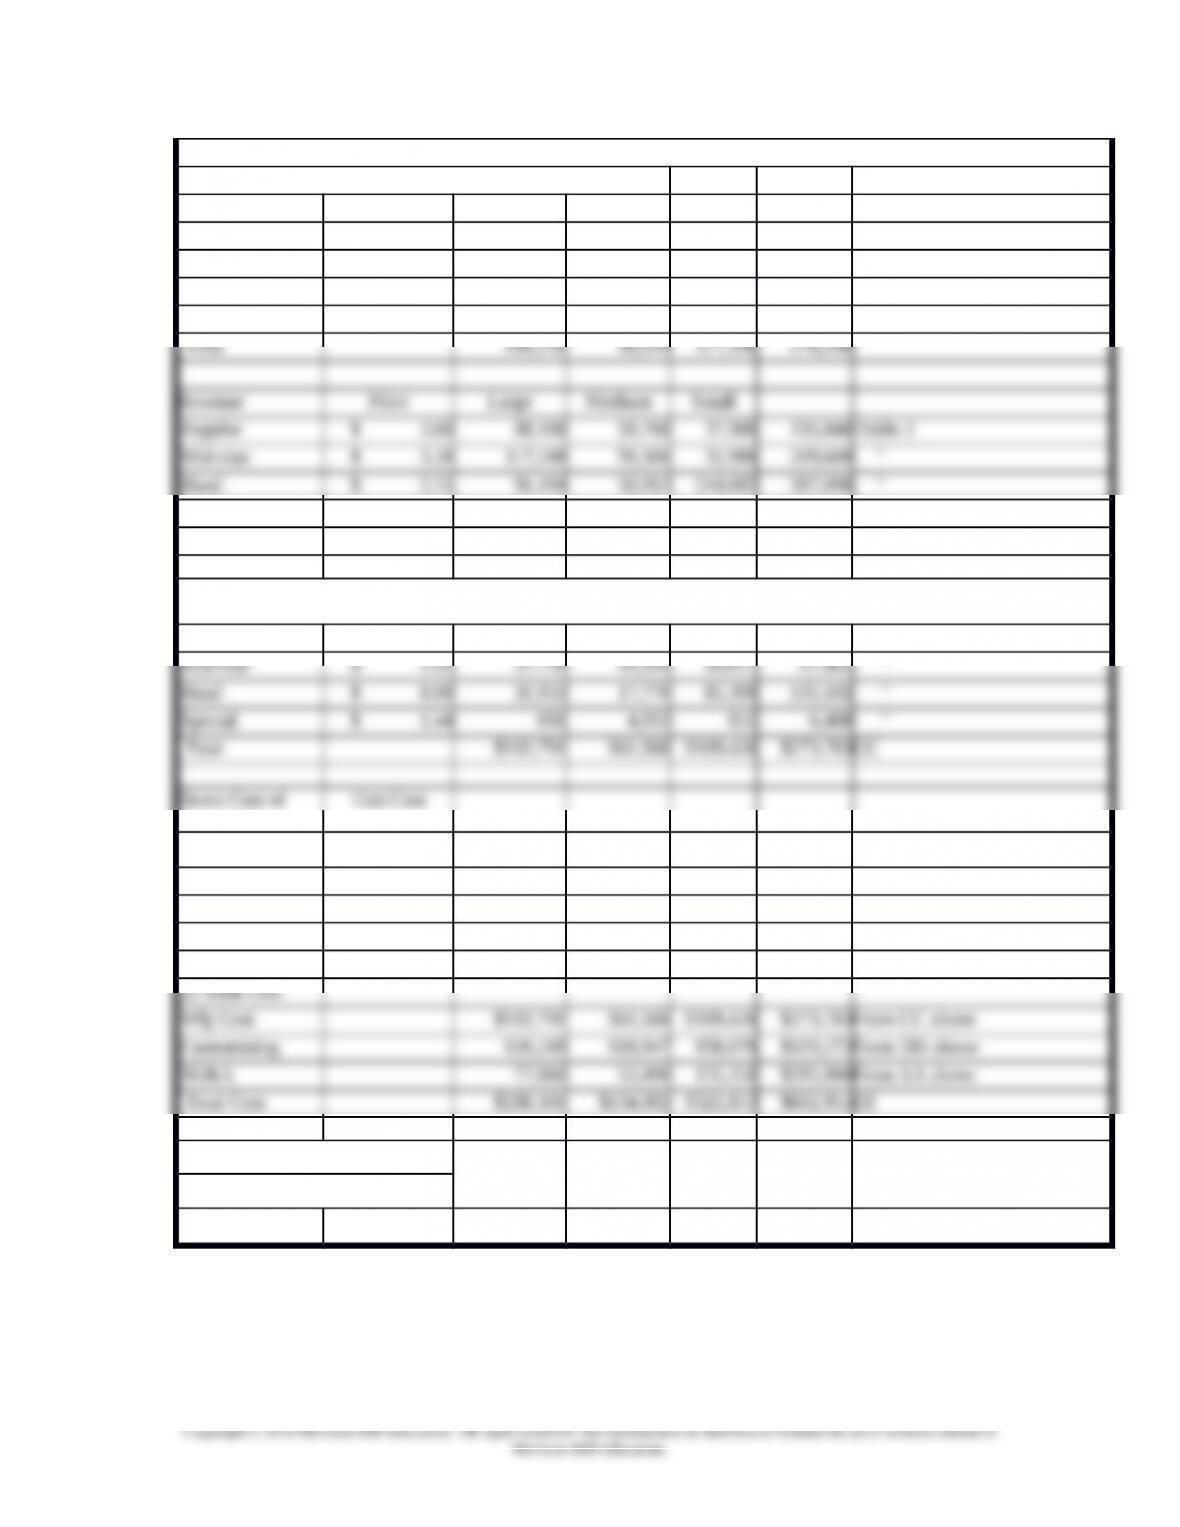
Chapter 5 – Activity-Based Costing and Customer Profitability Analysis
Third Stage: Customer Profitability Analysis
First: Get Revenues by Customer Group
Unit Sales Large Medium Small
Regular 27,250 16,600 10,550 54,400 Table 1
Mid-size 36,640 18,552 10,308 65,500 “
Hand 35,880 19,966 95,954 151,800 “
Special 480 3,426 594 4,500 “
Special $ 4.00 1,920 13,704 2,376 18,000 “
Total Revenue $308,762 $183,744 $318,024 $810,530BB
Second: Calculate Manufacturing Cost —
(1) Unit Cost
Regular $ 1.19 32,428 19,754 12,554 64,736Table 2 x Table 1
Customizing
Inking (Units x 2) $ 0.0817 16,381 9,566 19,184 45,131Table 2 x Table 1
Embroidery $ 1.2770 7,610 8,288 37,536 53,434
Dyeing $ 0.1100 2,259 1,093 1,356 4,708
$26,249 $18,947 $58,076 $103,272DD
Third: Calculate Customer Profit —
$102,661 $49,742 $(4,828) $147,575BB-EE
(1) Total
(2) Per Customer $12,833 $323 $(6) $150
5-6

Chapter 5 – Activity-Based Costing and Customer Profitability Analysis
5-2 Columbo Soft-Serve Frozen Yogurt
Purpose of the case:
This case illustrates the application of Activity-based costing to marketing costs in a food
manufacturer. While the purpose of analyzing product costs is to identify costs per unit of
product, the purpose of analyzing marketing costs is to identify costs per customer or customer
group. This case illustrates how cost drivers are identified and used to compare two separate
customer groups based on the channels of distribution. These cost drivers could also be used to
analyze marketing costs for individual customers. This information is very useful for
understanding profitability in the two channels and for decisions about how to service the two
channels.
Suggested Strategy for Use:
About 60 to 90 minutes are needed to discuss the case thoroughly. This fits well in a 90 minute
class with some lecture about Activity-based costing. I suggest starting with a short background
about marketing in the food business followed by a discussion of the critical issues in the case.
Then, discuss the activity-based costing analysis of the marketing costs. During this phase,
discuss the development of cost drivers, how the firm might have identified them, whether other
cost drivers might be applicable, how to measure the cost drivers and how to collect data about
the cost drivers. Finally, discuss the suggestions for changes in strategy.
Background for the Case Analysis
Food Industry Structure:
There are two distinct channels of distribution in the food business. Grocery and Foodservice.
Grocery is defined as food purchased for later assembly, preparation and consumption in the local
Grocery store. Foodservice is defined as meals prepared for the consumer away from home.
While most are familiar with the local grocery store, foodservice includes any location a
consumer may venture to purchase or eat a meal such as the corner deli, Red Lobster,
McDonald‘s or the college cafeteria. Foodservice comprises more than 52 percent of consumer‘s
food dollars and is growing at a real rate of 1.5% faster than Grocery
.
Grocery and Foodservice evolved independently due to three primary factors: Packaging
requirements, Shipping/Logistics requirements and Marketing requirements.
Packaging. The end use packaging format was the primary determinant of this
separation. Grocery stores sell relatively small package sizes whereas Foodservice uses
either single-serve packages or large, bulk packages. The large manufacturers in
foodservice are generally grocery product suppliers as well due to large capital
requirements to build manufacturing plants and relatively small capital requirements for
unique packaging. Thus, Foodservice is an excellent tool to maximize plant utilization. In
addition, consumer brands built in the Grocery channel have strong appeal in the
Foodservice channel.
5-7

Chapter 5 – Activity-Based Costing and Customer Profitability Analysis
Shipping/Logistics. There are six hundred thousand foodservice operators in the United
States and only thirty thousand grocery stores. Given similar channel sizes, the average
foodservice outlet purchases 1/20th the volume of the average grocery store.
Furthermore, foodservice operators generally have little storage room, so they tend to
order more often than grocers do. As a result, Grocery operators deal directly with
manufacturers whereas Foodservice operators deal with foodservice distributors who deal
with the manufacturers. The Foodservice distributors (such as Sysco, Alliant, US
Foodservice) carry the entire line of products their foodservice customers require
including cooking equipment, dry food, fresh food, meats, etc.
In addition, the manufacturer distribution centers differ for each subchannel because
Grocery orders are predominately full cube/full truck orders whereas Foodservice orders
are mostly part cube and less than truckload (LTL) orders. Thus, grocery distribution
centers are highly standardized with significant automation whereas foodservice
distribution centers are highly customized and manually intense operations.
Marketing. Grocery stores are very active in merchandising consumer products and
usually work in conjunction with the manufacturers to coordinate their advertising
activities. When manufacturers fund these promotions (and they generally do), they can
have tremendous influence over consumer purchase behaviors independent of the grocery
retailer. There is no similar mechanism in the foodservice industry. Instead, the few large
foodservice operators (McDonald‘s, Red Lobster, Marriott, ARAMARK, etc) enjoy
market power over the distributor who in turn wields power over the manufacturer. The
distributors control the street business (small, independent operators) through their sales
force (Distributor Sales Rep œ DSR) but remain beholden to the large foodservice
operators.
Since the large foodservice operators are few and powerful, manufacturers have found
it profitable to develop strong business ties to these operators and use those
relationships to pull product into distributor inventories. Once they have the product,
the distributor will encourage their DSR‘s to sell the product on the street in an effort
to maximize inventory turns. Less than half the 600M foodservice operators are
represented by chains, rather they are independently operated. So the decision making
in this market is quite uneven: a relatively few powerful players dominate. Yet a large
number of individual independent buyers purchase large quantities in aggregate. This
creates a window of competitive opportunity for a strong foodservice manufacturer.
General Mills has a large direct sales force of its own who call on the
restaurants and other foodservice operators. The salespeople create
demand with the operators who request the product from the distributors.
General Mills planned to use this sales force to market Colombo yogurt.
This case concentrates only on Foodservice. Within Foodservice, there are two distinct sub-
channels– Shops and Impulse locations. These sub-channels differ in marketing and shipping
requirements. Shops specialize in frozen yogurt whereas Impulse locations specialize in other
products–yogurt is an add-on.
5-8

Chapter 5 – Activity-Based Costing and Customer Profitability Analysis
1. General Mills and Colombo Competitive Environment:
General Mills focuses on high quality and high sales service. They had a large sales force
already selling to Impulse segment; Colombo offered the advantage of one more product. The
appeal was added profit for little added effort. General Mills had little experience or expertise in
selling to Shops
The market for frozen yogurt changed dramatically in the 1990‘s. In the early 1990‘s, the
market for frozen yogurt was increasing and many shops converted into franchise operations
such as TCBY, ICBY, Freshens, and Yogen-Fruz. These shops purchased their product from
their franchise operator. Meanwhile, Impulse locations started to open up. By late 1990‘s more
than 2/3 of soft-serve sales were at Impulse locations.
Sales of frozen yogurt started to drop and the company wasn‘t exactly sure why. Customers were
dissatisfied and profits were declining. General Mills used the same approach for both Impulse
and Shops. The company sensed that the two channels were different but lacked detailed
information about each channel.
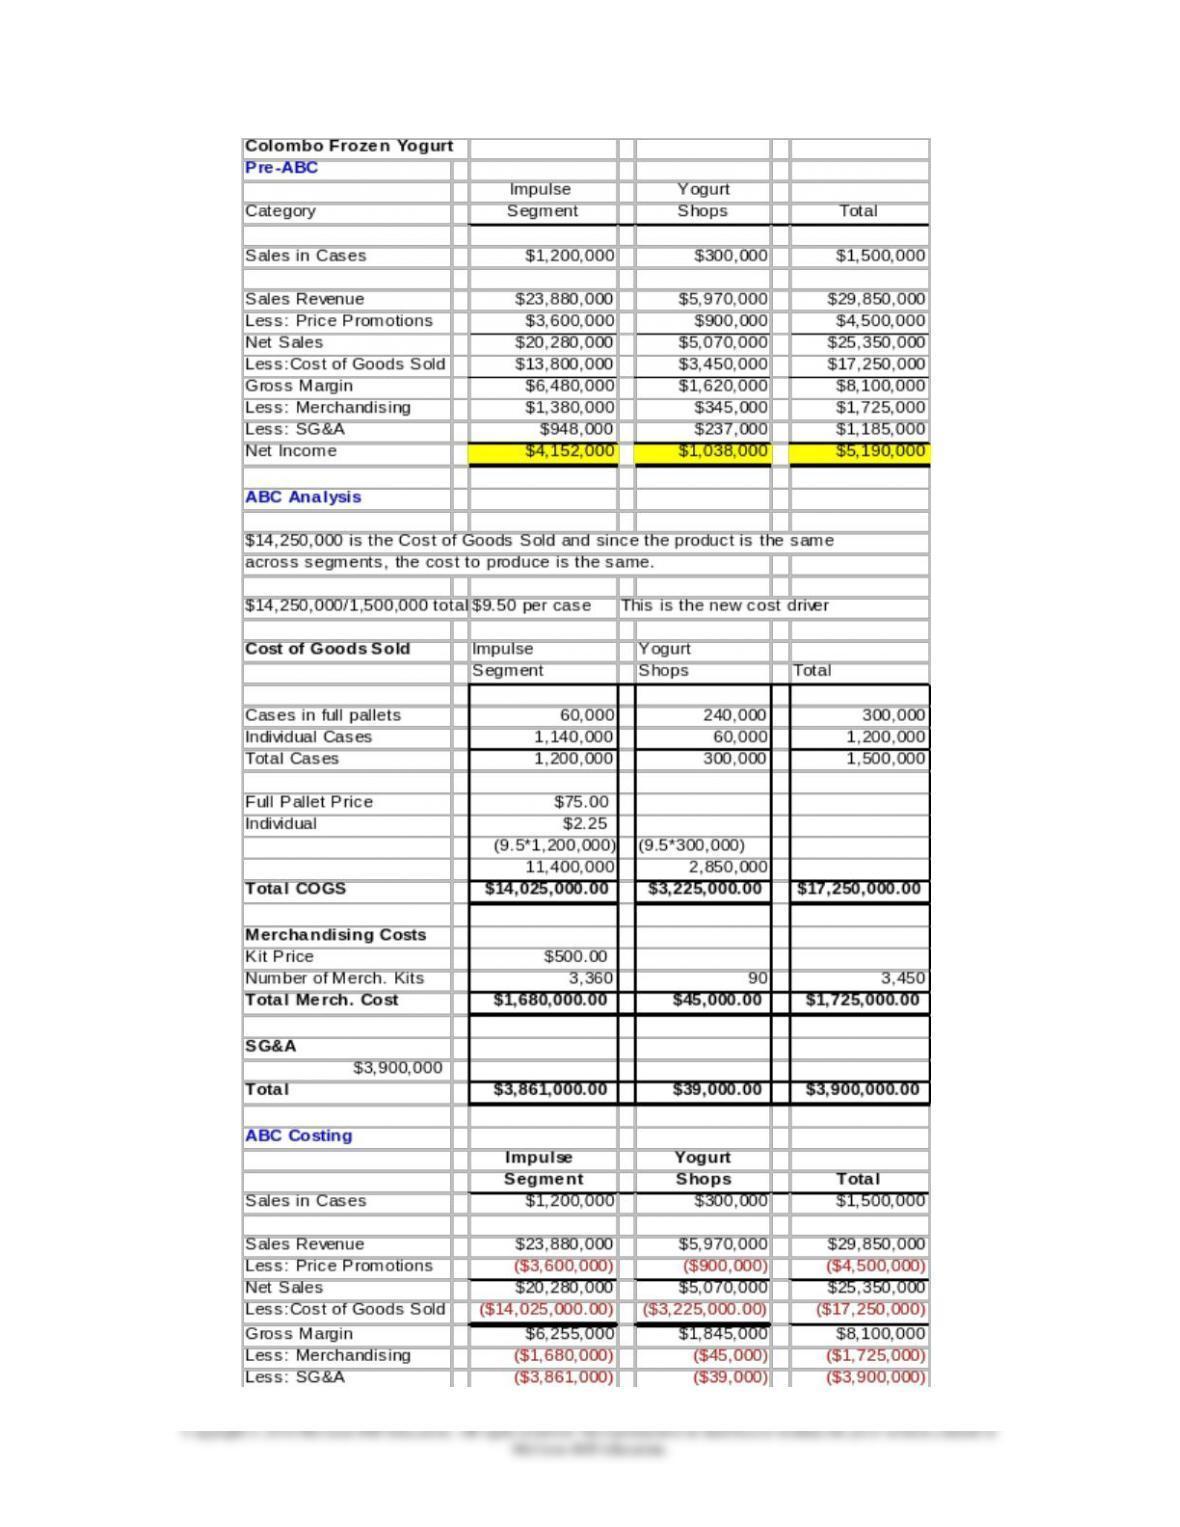
2. Activity-based costing analysis:
Cost of goods sold: – $14,250,000 (same for all cases) = $14,250,000/1,500,000 cases = $9.50 per
case
Impulse: 1,200,000 @ $9.50 = $11,400,000
Shops: 300,000 @ $9.50 = $2,850,000
Shipping: $3,000,000 varies with individual cases ($2.25/case) or with pallets ($75/pallet):
Impulse:
oPallets = 60,000/75 = 800 @ $75 = $60,000
oIndividual cases = 1,140,000 @ $2.25 = $2,565,000
oTotal = $2,625,000
Shops:
oPallets = 240,000/75 = 3200 @ $75 = $240,000
oIndividual cases = 60,000 @ $2.25 = $135,000
oTotal = $375,000
Merchandising: $500 per kit
New Net Income Analysis:
5-9
Chapter 5 – Activity-Based Costing and Customer Profitability Analysis
5-10