Chapter 20 – Management Compensation, Business Analysis, and Business Valuation
20-50 (continued -1)
distress at the time of the study, the presence of this distress may have
influenced the overall results.
4. The answers here could vary widely. One observation is that the
information is applicable only to the airline industry, and the results might
not be generalizable to other industries. Clearly the results indicate that
Source: Antonio Davila and Mohan Venkatachalam, “The Relevance of
Non-financial Performance Measures for CEO Compensation: Evidence
from the Airline Industry,” Review of Accounting Studies, 9, 2004, pp. 443-
464.
20-41
Education.
Chapter 20 – Management Compensation, Business Analysis, and Business Valuation
20-51 Business Analysis (45 min)
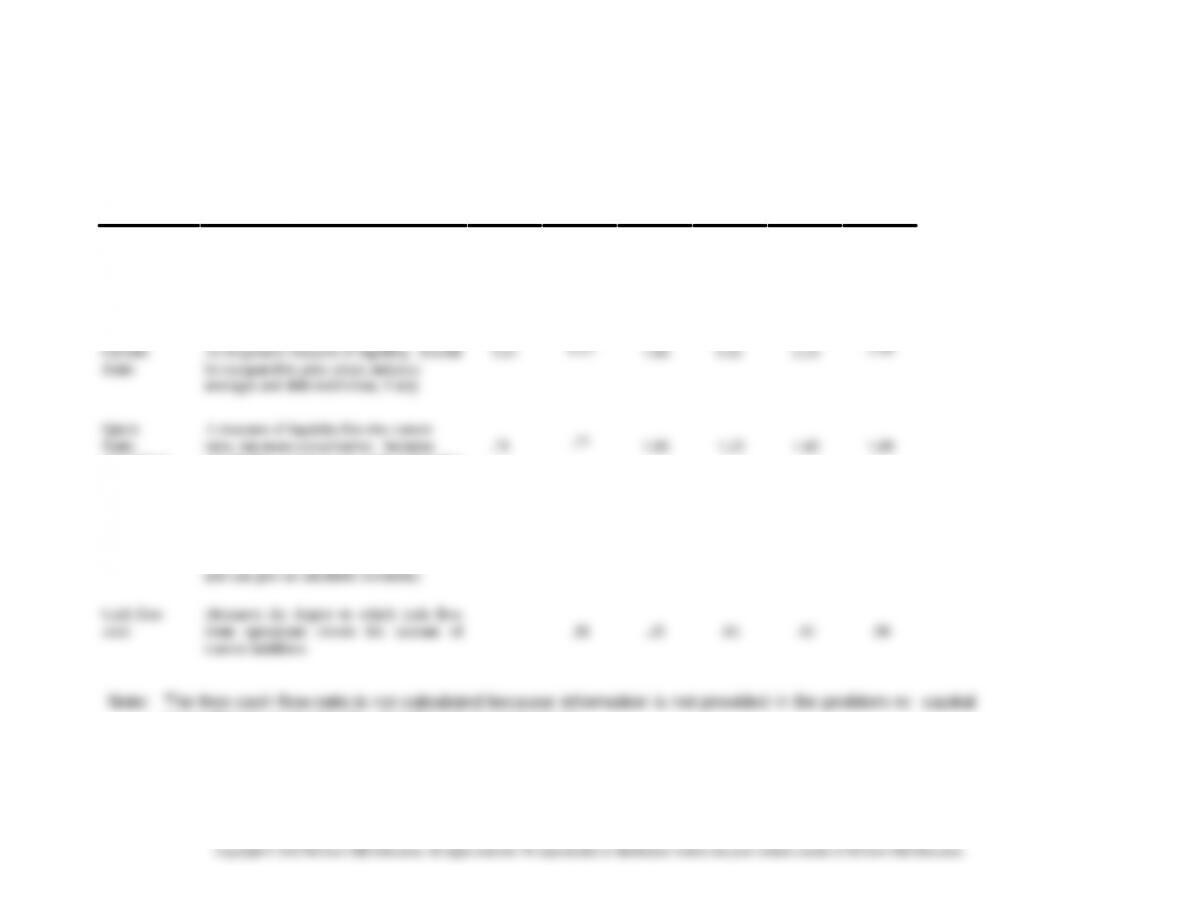
The following shows the ratios and an interpretation for each ratio.
a. Liquidity
Ratios Relevance 2011 2012 2013 2014 2015 2016
A/R
Turnover
The average number of times per yr. net
receivables turn into cash. Indicates
effectiveness of credit policy and
collections. Should be compared to prior
years and to industry averages.
7.48 7.44 8.09 6.92 7.89
(Acid Test)
only highly current assets-cash, marketable
securities, and receivables.
Inventory
Turnover
Indicates the average number of times that
inventory is replaced during the year.
Measures inventory management policies
9.62 7.73 8.42 7.15 6.81
expenditures or dividends. (continued on next page)
20-42
Chapter 20 – Management Compensation, Business Analysis, and Business Valuation
20-51 (continued -1)
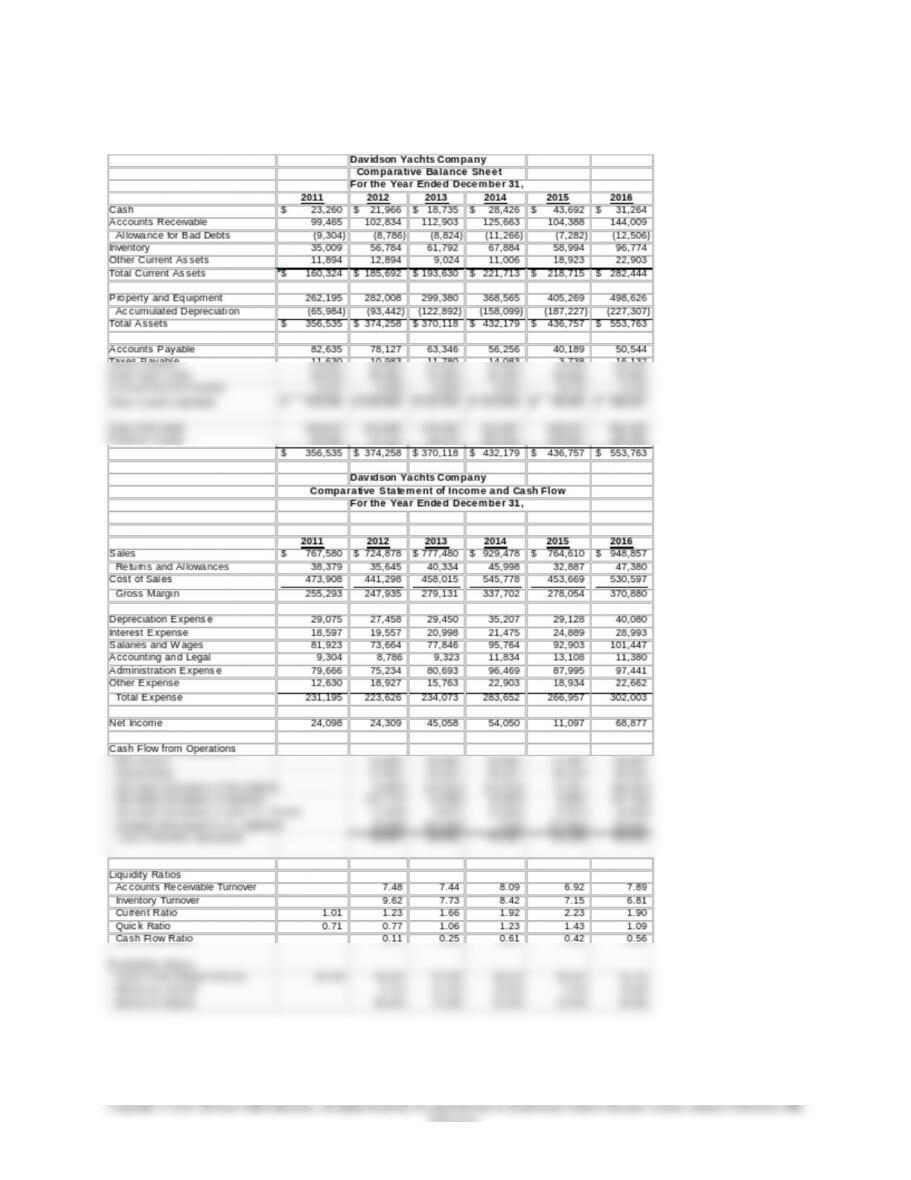
Liquidity looks OK overall, except for the recent buildup in inventory. The current ratio has declined in
2016, but is still safely above the bank’s restriction. On the plus side, cash flow from operations
continues to improve, except for a decline in the prior year. Liquidity looks good, but it would also be
useful to compare these results to an industry average to validate the findings.
b. Profitability
Ratios Relevance 20118 2012 2013 2014 2015 2016
Return on
Total Assets
A measure of management’s efficiency
and effectiveness in using available
assets.
6.7% 12.1% 13.5% 2.6% 13.9%
Return on
A measure of management’s effectiveness
35.0% 36.0% 37.9% 38.2% 38.0% 41.1%
Profitability is excellent in 2016, rebounding from a poor year in 2015. Will the improvement
continue? Some concern for variability in sales and profit over the last few years.
20-43
Chapter 20 – Management Compensation, Business Analysis, and Business Valuation
20-51 (continued -2)
The spreadsheet for the solution is shown below.
20-44
Education.
Chapter 20 – Management Compensation, Business Analysis, and Business Valuation
20-52 Business Valuation (20 min)
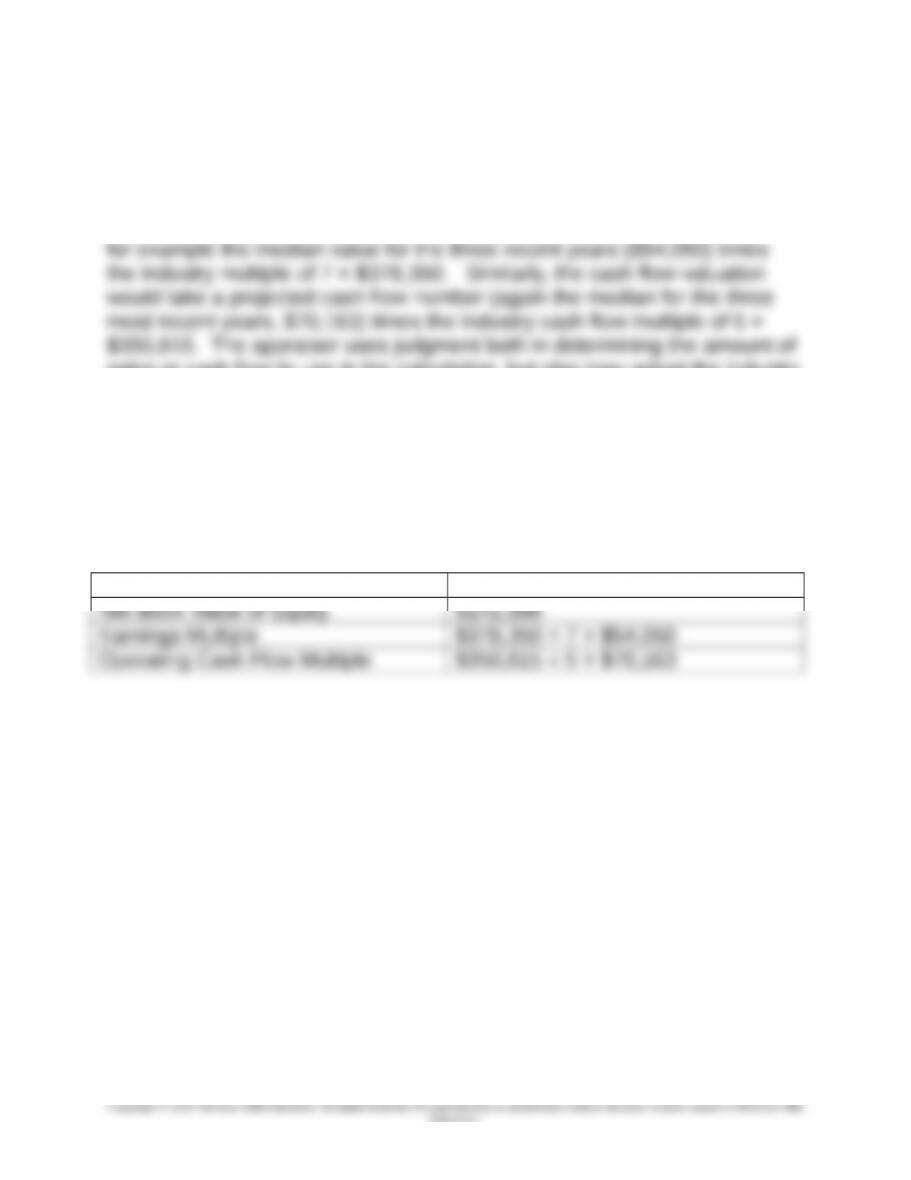
Using most recent figures, the net book value for Davidson Sailboats’
equity is $142,588, taken from the balance sheet.
The earnings multiple method would take a projected value for earnings, as
sales or cash flow to use in the calculation, but also may adjust the industry
multiple up (or down) if the firm is expected to perform better (or worse)
than the industry as a whole. The choice of the overall valuation requires
additional judgment; a median figure for the multiples valuations would be
approximately $351,000.
Summary of Valuations:
Valuation Method Valuation
20-45
Education.
Chapter 20 – Management Compensation, Business Analysis, and Business Valuation
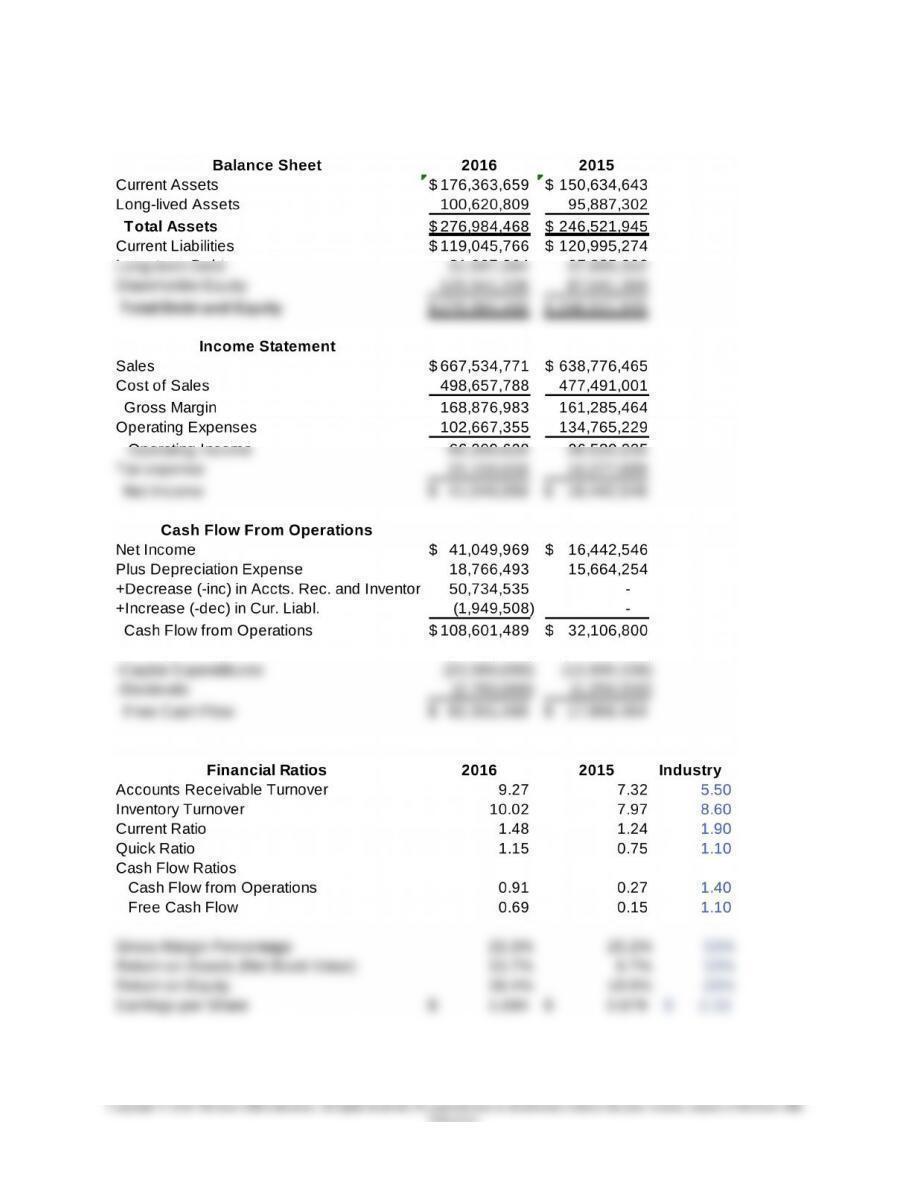
20-53 Business Analysis (50 min)
Calculations for financial ratios:
20-46
Education.