Chapter 20 – Management Compensation, Business Analysis, and Business Valuation
Thus, in the first three years following the implementation of CIPP, the plan seems to have successfully created a “win-win” situation for the
manufacturing employees and John Deere as a whole. Employees received larger compensation in the form of one time bonuses for
increasing their production efficiency, and John Deere lowered its product costs. Following this initial three year period, however, CIPP’s
effectiveness decreased. Once team benchmarks reached a certain level, the costs to the employees of imposing a higher benchmark
Consequently, the fear of job loss or plant closures could have induced employees to agree to wage concessions and/or standard
increases that were not necessarily in their best interest. Moreover, companies have used the threat of job loss and/or plant closures
to induce employees to agree to compensation contracts with terms more favorable to the organization (see Arnold (1998) for a vivid
example of this strategy at Caterpillar).
We do not know whether the fear of job loss played a contributing factor in employees’ acceptance and adherence to CIPP. However,
sustaining competitive advantages) would be lost.
Directing Role
By rewarding group performance, CIPP provides employees incentives to focus on cooperative efforts and activities that increase the overall
production efficiency of their product-focused teams (illustrated in question 4.c). Based on the observations of company management, many
of the process improvements in the years following CIPP’s implementation were the result of increased cooperation within manufacturing

Chapter 20 – Management Compensation, Business Analysis, and Business Valuation
increased employee tensions within some teams. For example, several instances of “parking-lot diplomacy” have been documented among
employees.
Attracting Role
Because individual compensation is highly dependent on the actions of others, John Deere may no longer attract the highest skilled workers
John Deere’s Desired Improvements in Upcoming CIPP Negotiations
In upcoming contract negotiations, John Deere would like to improve CIPP along two dimensions. First, management would like to adjust
the benchmark whenever average bi-annual performance exceeds 115 percent rather than 120 percent. In general, this change would
decrease the benefits to employees of producing just shy of the benchmark adjustment level. Further, John Deere wants to adjust the team’s
benchmark by the exact percentage that average bi-annual performance exceeds the 115 percent threshold (as opposed to a maximum
adjustment of 6.49 percent).
This second objective reveals John Deere’s strategy for overcoming one of the inherent difficulties of CIPP – measuring the costs imposed
on the manufacturing employees of generating production efficiencies. As described in the case, implementing process improvements
potentially imposes many costs on employees (for example, reduced future compensation, greater effort, and increased probability of future
job loss). However, it is extremely difficult (if not impossible) for John Deere to accurately estimate these costs.
Since John Deere cannot perfectly measure employees’ reservation wage for these innovations, the company elected to initiate CIPP with a

Chapter 20 – Management Compensation, Business Analysis, and Business Valuation
One potential problem with this strategy, however, is that employees could “hold-up” their process improvements in the hopes of receiving
even higher bonuses in the future. Specifically, if employees anticipate John Deere offering even higher bonuses in the future, then it may be
in their best interest save-up their innovations until the next round of contract renegotiations.
REFERENCES
Aeppel, T. 2002. Tricks of the trade: On factory floors, top workers hide secrets to success. The Wall Street Journal (July 1): A1.
Arnold, P. 1998. The limits of Postmodernism in accounting history: The Decatur experience. Accounting, Organizations, and Society 23
(7), 665-684.
Salter, M., and M. Dayley. 2000. Deere & Company: sustaining value. Harvard Business School Case 9-899-001.
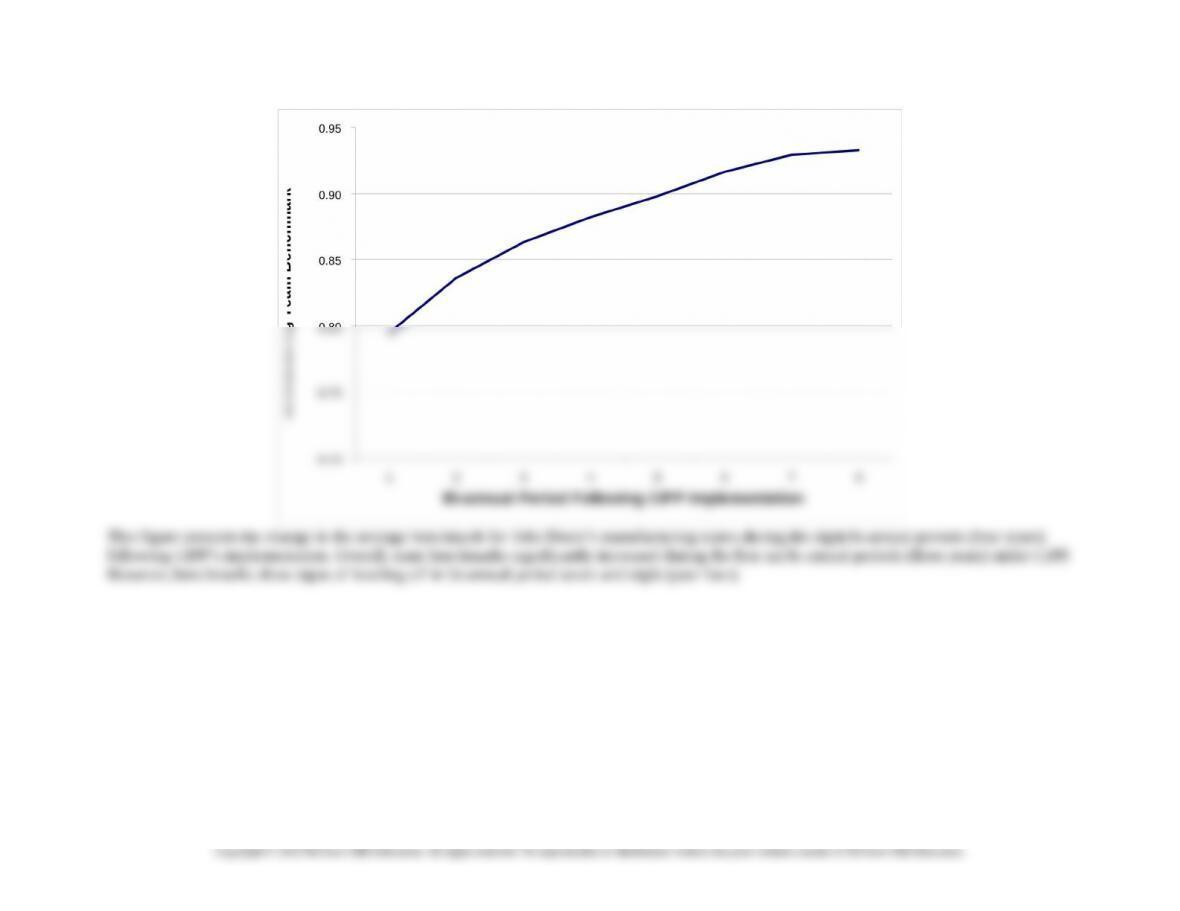
FIGURE 1
Average (Actual) Benchmarks for Manufacturing Teams at John Deere for the
Eight Bi-annual Periods (Four Years) Following CIPP’s Implementation
20-33
Chapter 20 – Management Compensation, Business Analysis, and Business Valuation
20-34

0
20
40
60
80
100
120
140
160
Chapter 20 – Management Compensation, Business Analysis, and Business Valuation
FIGURE 2
Distribution of Bi-Annual (Actual) Manufacturing Team Performance
at John Deere under CIPP
Deere’s CIPP. John Deere increases the benchmark used to evaluate and compensate teams whenever the average bi-annual adjustment factor
exceeds 120 percent. Thus, it appears that a disproportionate number of teams, in response to this mechanistic ratchet, perform up to, without
exceeding, the 120 percent level.
20-35
Copyright © 2016 McGraw-Hill Education. All rights reserved. No reproduction or distribution without the prior written consent of McGraw-Hill Education.
Frequency (n)

Chapter 20 – Management Compensation, Business Analysis, and Business Valuation
20-5 Henson Stores
Note: The Henson Stores Case is similar to Problem 18-49 in the text.
Overview: The case is intended for the cost or advanced management accounting course. It can also be used with the MBA management
accounting course. The case assumes knowledge of Excel, including the ability to apply correlation and regression analysis (found in Data
Analysis under the Data menu in Excel).
Learning Objectives:
The main learning objectives of the case are to assess the validity of the balanced scorecard (BSC) and to use the validated BSC to determine (and
interpret) bonus compensation for the store managers of a multi-store retail company. The learning objectives:
1. Using regression and correlation analysis, determine which of the measures in a BSC have a statistically significant (and therefore
reliable) relationship with the key performance measure in the case, store-level earnings.
2. Determine the amount of bonus to be allocated to each store manager based on the reliable BSC measures, and interpret the results of
the bonus calculations.
Answers to Requirements:
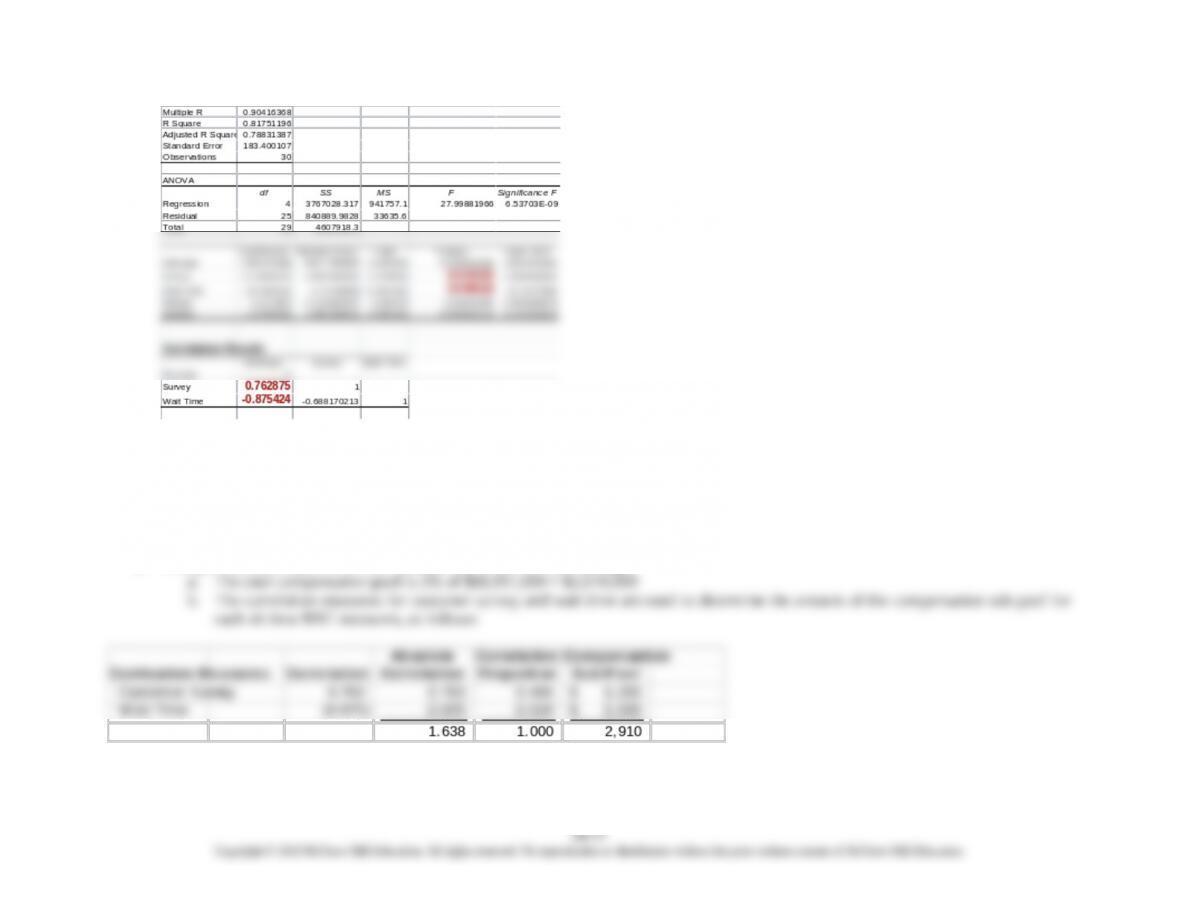
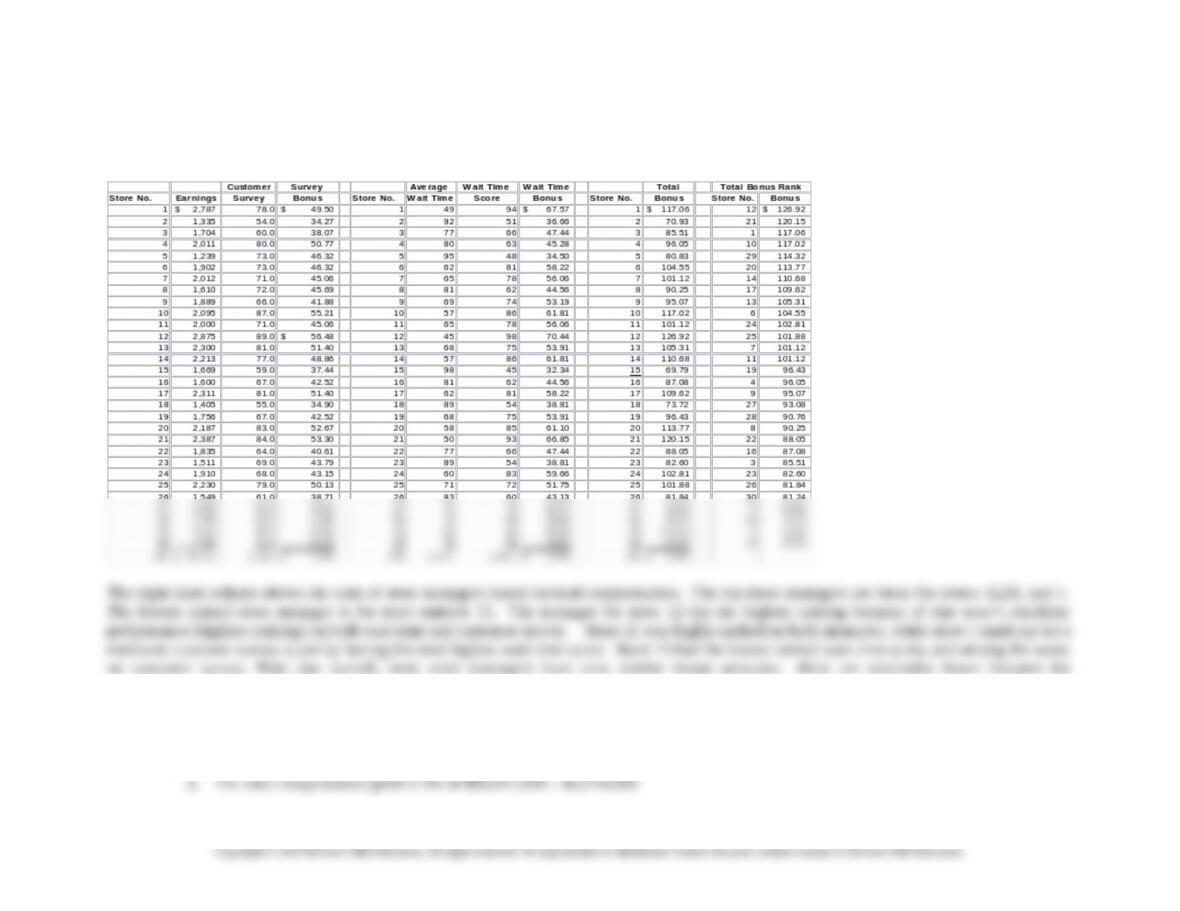
1. The regression and correlation results for the data are shown below.
TN-1 Regression and Correlation Results for BSC data for the 30 Stores
20-36
Chapter 20 – Management Compensation, Business Analysis, and Business Valuation
We now exclude the non-significant measures from further analysis and determine the correlation between earnings and each of the significant
variables – customer survey and wait time. The results are shown in TN-1 above: customer survey (r = .762875) and wait time (r = -.875424).
The correlation is negative for the wait time measure since lower wait time leads to greater customer satisfaction and to greater earnings. Both of
these correlations are significant at the .05 level, as determined from the regression model.
2. Using the results in part 1, we can calculate the bonus for each manager.
The sub-pool amounts are then allocated to each of the managers based upon the manager’s score, as follows:
Chapter 20 – Management Compensation, Business Analysis, and Business Valuation
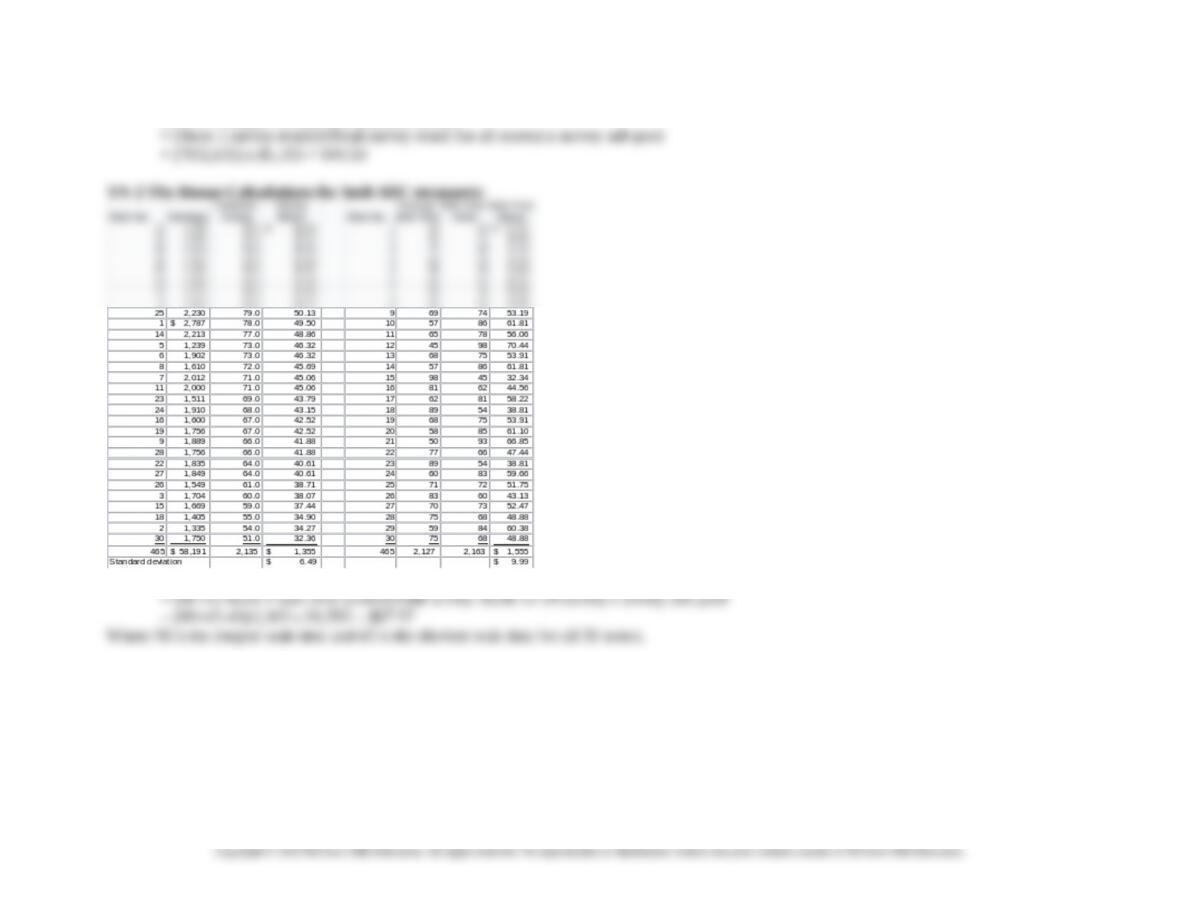
Store 1 Manager’s bonus for customer survey
Store 1 Manager’s bonus for wait time
The reasoning behind this allocation method is that it provides a range of bonus rewards which is consistent with the customer survey results.
Note that the standard deviation of bonus rewards is 6.49 for the customer survey bonus and 9.99 for the wait time bonuses, not a very large
difference. Other approaches I examined in coming up with these allocations produced results such that the amounts of the bonuses ranged from
very large to very small or zero. My goal in choosing the allocation method was to have a method in which the allocations would (a) not result in
negative bonuses, and (b) would produce approximately the same variation (standard deviation) for each of the BSC measures. For example, in
one effort to develop an allocation I used the largest wait time (98) less the actual wait time for each store as a basic for the allocation. The result
20-38
Chapter 20 – Management Compensation, Business Analysis, and Business Valuation
of this approach was to have wide variations among stores in the bonus amount (including zero bonus for the lowest scoring store), so for the
reasons noted above, I rejected this approach.
There are a variety of methods that could be used to determine either the allocation of customer survey or the wait time bonus pool to the
managers. For example, one could allocate the entire bonus pool to, say, the top 10 store managers. Another option would be to allocate the
20-39
Chapter 20 – Management Compensation, Business Analysis, and Business Valuation
c. The sub-pool bonuses are added to determine the total bonus for each manager, shown in TN-3.
TN-3 Total Bonus for Each Manager using BSC Measures
approximately the last quartile of managers .
3. The solution is similar to that for part 2 above.
20-40