Chapter 20 – Management Compensation, Business Analysis, and Business Valuation
Profitability
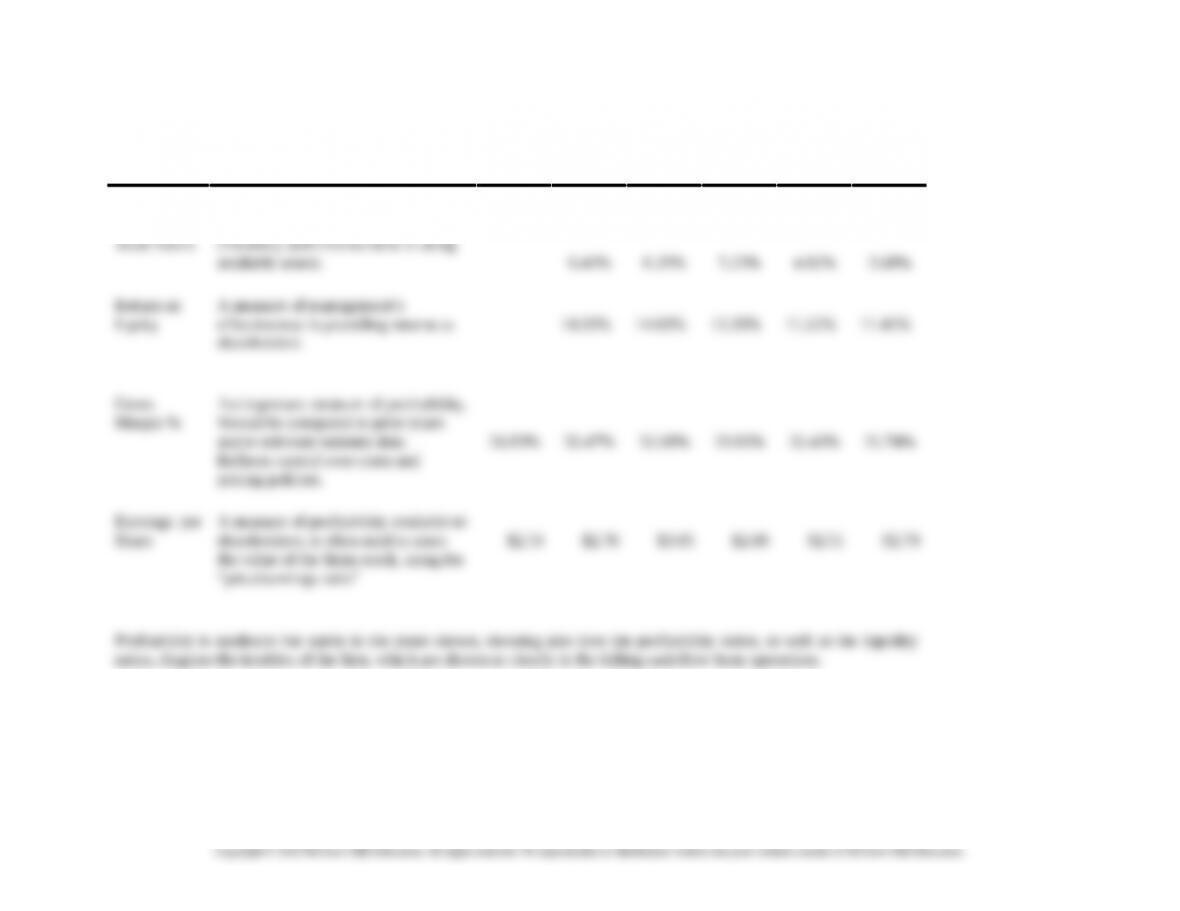
Ratios Relevance 2008 2009 2010 2011 2012 2013
Return on
A measure of management’s
20-11

Chapter 20 – Management Compensation, Business Analysis, and Business Valuation
20-3. Economic Value Added; Review of Chapter 18; Strategy
(Adapted from teaching note prepared by the case writer, Paul Dierks, Wake Forest University)
1. Economic Value Added, or EVA, is a measure of financial performance that combines the familiar
concept of residual income with principles of modern corporate finance NIspecifically, that all capital
has a cost and that earning more than the cost of capital creates value for shareholders. EVA is after-tax
net operating profit (NOPAT) minus cost of capital. If a company’s return on capital exceeds its cost of
capital, it is creating true value for shareholders. Companies consistently generating high EVAs are top
primary emphasis on placating the interests of a firm’s lenders in order to provide a conservative
assessment of the firm’s liquidation value. Thus, the quality of reported earnings are diminished by
various financial accounting rules, like incorporating charge-offs of such value-building capital outlays as
R&D and bookkeeping entries that have little to do with recurring cash flow. This group also feels that
many investors may be fooled by accounting “shenanigans,” but investors who matter are not misled.
the amount of accounting equity capital. However, ROE suffers from distortions of accounting earnings
by, among other things, expensing R&D, selecting LIFO or FIFO for inventory costing, recording
acquisitions as a purchase or a pooling, and burying recurring cash flows generated from operations in
reserves because of accrual accounting methods.
Also, ROE reacts to changes in the debt-to-equity mix a company employs and in the rate of
project by mixing operating and financing decisions. Instead, all projects should be thought of as being
financed with a target blend of debt and equity no matter how they might indeed be financed. Moreover,
by focusing just on ROE, managers may pass up good (wealth creating) projects that are safer than the
average assets of the firm because the return on the project would lower the firm’s ROE. Similarly,
managers may take on bad (wealth reducing) projects that are riskier than the average asset of the firm
most profitable year, had a return on assets that was over 11 %, but its cost of capital was almost 13 %.
Assuming their cost of capital remains at 13 %, accepting projects with risks similar to existing assets, but
with a return below 13 %, reduces shareholder value.
Another comparison to make is against earnings per share (EPS). In contrast to EVA, EPS tells
little about the cost of generating those profits. Since EPS is directly influenced by the amount of earnings
Education.

Chapter 20 – Management Compensation, Business Analysis, and Business Valuation
measures only the quantity of earnings, but the quality of earnings reflected in the price-to-earnings
multiple also matters.
Calculating EVA
In The Quest for Value (Harper Collins Publishers, 1991), G. Bennett Stewart calculates a firm’s
EVA in two ways: an Operating Approach, and a Financing Approach. The Financing Approach builds up
to the rate of return on capital from the standard return on equity in three steps: eliminating financial
leverage, eliminating financing distortions, and eliminating accounting distortions. As a result of the first
two steps, NOPAT is a sum of the returns attributable to all providers of funds to the company, and the
NOPAT return is completely unaffected by the financial composition of capital. What matters is simply
the productivity of capital employed in the business. The financial form in which the capital has been
obtained does not matter. Only the financial approach is presented here; for the development of the
operating approach, consult Stewart’s text.
Before developing the calculations for EVA it is important to first cover the concepts of the equity
equivalent adjustments, or EE’s.
Understanding / Use of Equity Equivalents
Equity equivalents, or ‘EE’s’, per Bennett Stewart’s book, are adjustments that turn a firm’s
accounting book value into “economic book value,” which is a truer measure of the cash that investors
have put at risk in the firm and upon which they expect to accrue some returns. In this way, capital-related
items are turned into a more accurate measure of capital that better reflects the financial base investors
expect to accrue their returns on. Also, revenue- and expense-related equity equivalent adjustments are
included in a NOPAT that is a more realistic measure of the actual cash yield generated for investors from
recurring business activities.
Stewart has identified a total of 164 equity equivalent reserve adjustments; however, only about
1.) Is it likely to have a material impact on EVA?
2.) Can the managers influence the outcome?
3.) Can the operating people readily grasp it?
4.) Is the required information relatively easy to track and derive?
R&D expenditures provide a good example of an equity equivalent adjustment. Under accounting
conventions, outlays for R&D are charged off to the income statement in the period when they are
incurred. These immediate charge-offs as operating expenses say there is no future value to be derived
from R&D. Thus, the firm’s profits are reduced and its capital is undervalued. For EVA purposes, all
reflect the costs and profit of a period. The portion of R&D expenditures that has future value should
appear as an asset. These equity equivalent adjustments are made in calculating EVA.
The following list of equity equivalents and their effect on capital and NOPAT is taken from
Stewart’s book. The asterisked items are equity equivalents in the OSI case. They are described further in
the paragraphs after the list.

Chapter 20 – Management Compensation, Business Analysis, and Business Valuation
Add to Capital: Equity Equivalents
Deferred income tax reserve*
LIFO reserve*
Cumulative goodwill amortization*
Unrecorded goodwill
(Net) capitalized intangibles
Full-cost reserve
Cumulative unusual loss (Gain) after tax
Other reserves, such as:
Bad debt reserve Inventory obsolescence reserve
Warranty reserve Deferred income reserve
Add to NOPAT: Increase in Equity Equivalents
Increase in deferred tax reserve*
Increase in LIFO reserve*
Goodwill amortization*
Increase in (net) capitalized intangibles
Increase in full-cost reserve
Unusual loss (gain) after tax
Increase in other reserves
Deferred Income Tax Reserve. Deferred taxes arise from a difference in timing when revenues
and expenses are recognized for financial reporting versus when they are reported for tax purposes. The
difference between the accounting provision for taxes and the tax amount paid is accumulated in the
reserve for deferred income taxes account. If long-term assets that give rise to tax deferrals are
replenished, a company’s deferred tax reserve increases, which constitutes the equivalent of permanent
equity. Adjusting NOPAT for the change in deferred tax reserve results in NOPAT being charged only
with the taxes actually paid instead of the accounting tax provision. This provides a clearer picture of the
true cash-on-cash yield actually being earned in the business. Action(s) to be taken:
Add to Capital: Amount of the deferred tax reserve
Add to (Deduct From) NOPAT: Amount of increase (decrease) in the deferred tax reserve
The LIFO Reserve. In periods of rising prices, firms save taxes by using a LIFO basis of
inventory costing. Under LIFO, recently acquired goods are expensed and the costs of prior periods are
accumulated in inventory, resulting in an understatement of inventory and equity. A LIFO reserve account
captures the difference between the LIFO and FIFO value of the inventory and indicates the extent that
the LIFO inventories are understated in value. Adding the LIFO reserve to capital as an equity equivalent
adjustment converts inventories from a LIFO to a FIFO basis of valuation, which is a better
approximation of current replacement cost. Also, adjusting NOPAT for the change in the LIFO reserve
brings into earnings the current period effect of unrealized gain attributable to holding inventories that
appreciated in value. Action(s) to be taken:
Add to Capital: Amount of the LIFO reserve
Add to (Deduct From) NOPAT: Amount of increase (decrease) in the LIFO reserve
Changes in the LIFO reserve can also be viewed as a difference between the LIFO and FIFO cost
of goods sold. Including this change in reported profits converts a LIFO cost of goods sold expense to
FIFO, but LIFO’s tax benefit is retained. The overall effect of treating a LIFO reserve as an equity
equivalent adjustment is to produce a FIFO balance sheet and income statement but preserve the LIFO tax
20-14

Chapter 20 – Management Compensation, Business Analysis, and Business Valuation
benefit.
Cumulative Goodwill Amortization. Goodwill arises when the acquisition of another firm is
recorded as a purchase and there is an excess of cost over the fair value of the net assets acquired. The
amount of the goodwill recorded can be amortized against earnings over a period not to exceed 40 years.
To make this non-cash, non-tax-deductible item the non-issue it really is, the amortized amount should be
added back to reported earnings. And, to be consistent, the cumulative goodwill that has been amortized
must be added back to equity capital and to goodwill remaining on the books. By un-amortizing goodwill
in this way, the rate of return will properly reflect the true cash-on-cash yield that is of interest to
shareholders. Action(s) to be taken:
Add to Capital: Amount of the cumulative goodwill amortization
Add to NOPAT: The amount of increase in goodwill amortization
An Overview of the Process Involved in Calculating EVA
The solution of the OSI case is in the attached Exhibits that have been prepared for OSI (TN-1
through TN-3).
The following is a list of the steps to be completed in calculating OSI’s EVA amounts:
1. Obtain a Balance Sheet and Income Statement for 2013
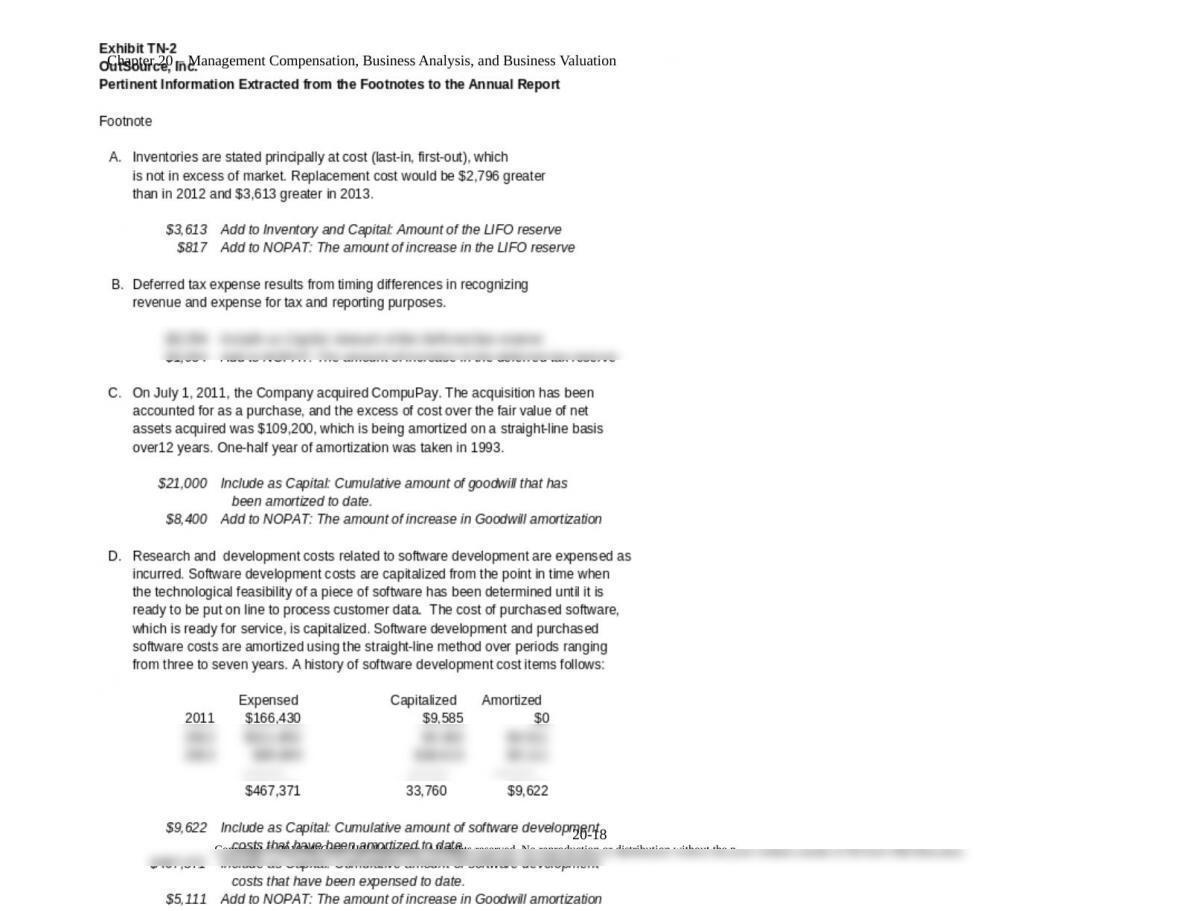
2. Obtain the footnotes to those financial statements;
3. Analyze the footnotes for information on equity equivalent adjustments;
4. Obtain information on the firm’s stock, debt and interest rates;
5. Determine equity equivalent adjustment amounts by analyzing the footnotes;
6. Calculate the firm’s weighted average cost of capital;
7. Prepare worksheets of EVA statements
8. Prepare final statements of EVA showing amounts calculated for RONA (Return on Net
Assets), and EVA
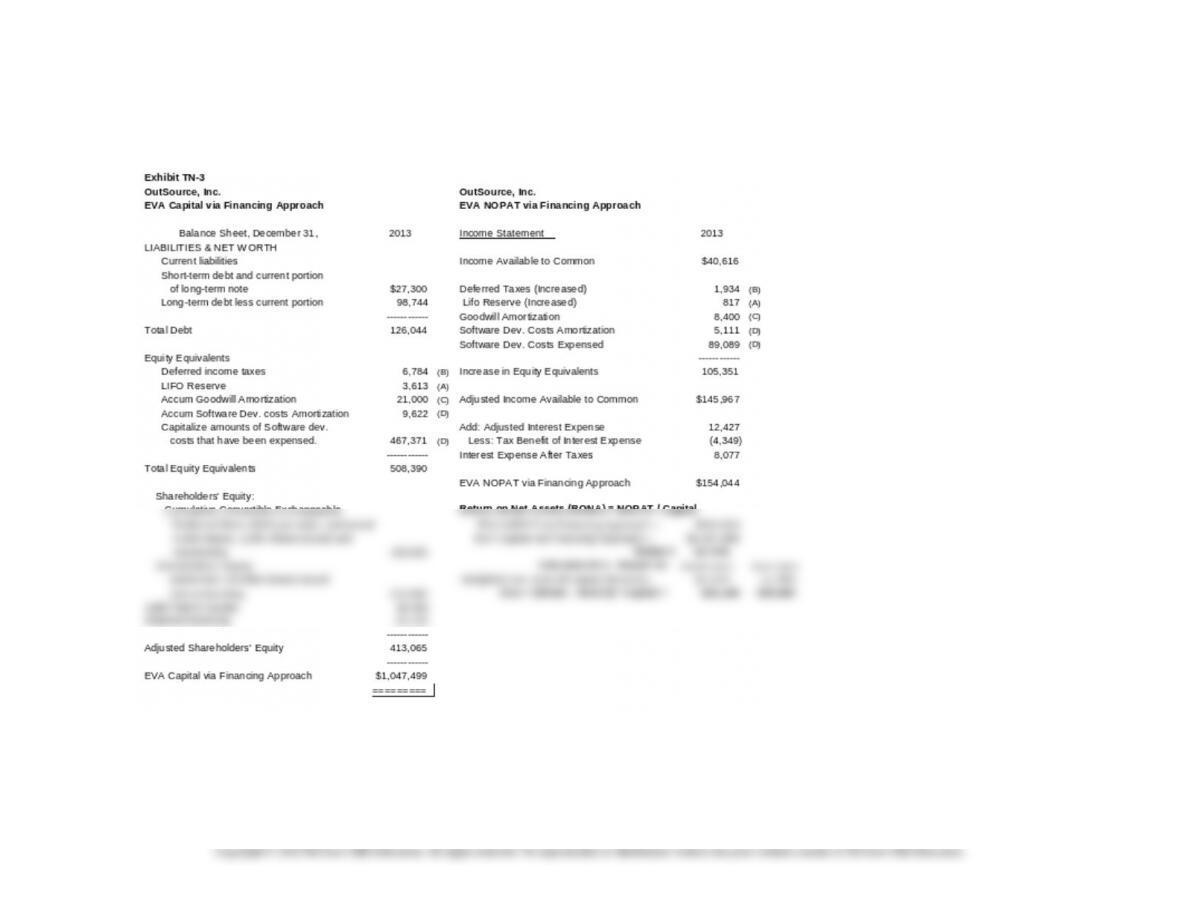
Calculating EVA
EVA calculations for OSI in 2013 using the Financing Approach are detailed in Exhibit TN-3.
Refer to Exhibits TN-1 and TN-2 for relevant information on the WACC and the equity equivalent
adjustment amounts involved in these calculations.
Note: This case situation focused primarily on EVA, but other valuation-based performance
metrics exist such as NPV, CFROI, and RI. CFROI (cash flow return on investment) is a rate of return
measure calculated by dividing inflation-adjusted cash flow from the investment by the inflation-adjusted
amount of the cash investment. While CFROI does adjust for inflation, it fails to account for risk and the
appropriate required return on the project. In a sense, CFROI is similar to the internal rate of return (IRR)
after including the EE adjustments, hence it measures the investment’s return as opposed to the wealth
created or destroyed by the investment.
2. Benefits / Advantages and Disadvantages of EVA
All managers basically have the same objective putting scarce capital to its most promising
uses. To increase their company’s stock price, managers must perform better than those with whom they
compete for capital. Then, once they get the capital, they must earn rates of return on it that exceed the
return offered by other, equally risky seekers of capital funds. If they accomplish this, value will have
is used and on the cash flow generated from it. It runs counter to the notion that long-term stock
appreciation comes from earnings.
20-15
Education.

Chapter 20 – Management Compensation, Business Analysis, and Business Valuation
Focusing on EVA growth provides two benefits: 1) management’s attention is focused more
toward its primary responsibility increasing investor wealth; and, 2) distortions caused by using
historical cost accounting data are reduced, or eliminated. As a result, managers spend their time finding
ways to increase EVA rather than debating the intricacies of the fluctuations in the earnings reported in
their traditional accounting statements.
EVA measures the amount of value a firm creates during a defined period through operating
decisions it makes to increase margins, improve working capital management, efficiently using its
production facilities, redeploying underutilized assets, etc. Thus, EVA can be used to hold management
accountable for all economic outlays, whether they appear in the income statement, on the balance sheet
or in the financial statement’s footnotes. EVA creates one financial statement that includes all the costs of
being in business, including the carrying cost of capital. The EVA financial statement gives managers a
complete picture of the connections among capital, margin and EVA. It makes managers conscious of
every dollar they spend, whether that dollar is spent on or off the income statement, or on operating costs
or the carrying cost of working capital and fixed assets.
Another very subtle benefit for a firm that adopts EVA is that it creates a common language for
making decisions, especially long-term decisions, resolving budgeting issues, evaluating the performance
of its organizational units and their managers, and measuring the value-creating potential of its strategic
options. An outgrowth of such an environment is that the quality of management also improves as
managers begin to think like owners and adopt a longer horizon view.
3. To this point, the emphasis has been on how focusing on EVA may help managers increase shareholder
wealth. However, for the metric to help in creating shareholder wealth, managers must behave in a
manner consistent with wealth creation. One powerful way to align managers’ interests with those of the
shareholders is to tie their compensation to output from the EVA metric. In fact, it is not just for
managers, but may be used for all employees. When implemented correctly, the basic notion of increasing
shareholder value will permeate the entire organization, and employees at all levels will then begin to act
in concert with upper levels of management.
Implementing an EVA-based incentive plan is fundamentally a process of empowerment
getting employees to be entrepreneurial, to think and act as owners, getting them to run the business as if
they owned it, and giving them a stake in the results they achieve.
The overall, firm-wide objective is to generate a persistent increase in EVA. To achieve that,
employees must understand the role they play in increasing a firm’s EVA. A key factor in sustaining a
continuing interest in EVA and in making it work is to revise the compensation system to focus on
creating value. It has been shown that one of the critical components in successfully using EVA to
improve a company’s MVA is tying it to bonuses and pay schemes. Designing an incentive compensation
system that pays people for sustainable improvements in EVA, in concert with an understanding of what
drives EVA, and what drives economic returns, is what transforms behavior within a company.
A good way to get started quickly is to increase insider ownership of the firm’s stock. One way to
do this is to turn old profit-sharing plans into employee stock-ownership plans.
If an incentive system is to work, it must have certain distinctive properties:
1. An objective measure of performance, which cannot be manipulated by one of the parties who
may benefit. For example, in many existing plans, the budget is a commonly used target for
performance, but the manager being evaluated is usually heavily involved in negotiating that
budget.
2. It must be simple so that even employees far down in the organization will understand how EVA
is tied to economic value and can follow it well.
3. Bonus amounts have to be significant enough in amount for employees to alter their behaviors.
20-16
Education.

Chapter 20 – Management Compensation, Business Analysis, and Business Valuation
20-17
Exhibit TN-1
Financial Data Input and Calculation of Interest Rates/Expense:
Calculate Weighted Ave. Cost of Capital – Based on Market:
Rate
Interest
Weights:
Pct of Total
Short-term Debt:
$8,889
8.00%
$711
Long-term Note Payable
$117,155
17.8%
Long-term Debt: Current portion
$18,411
10.00%
$1,841
Preferred Stock
Long-term Debt: Long-term portion
$98,744
10.00%
$9,874
Shares o/s
1,000
$117,155
Interest paid=
$12,427
Par value
$100
$100,000
15.2%
Common Stock
Risk-free rate (90 day T-bills)=
5.0%
Shares o/s
219,884
Return on the Market=
12.5%
Market value
$2.00
$439,768
66.9%
Beta Value of common stock=
1.2
—–—-
Tax Rate=
35.0%
$656,923
Price per share of common stock=
$2.00
Weighted Average Cost of Capital
For Debt=
1.159%
Calculated Cost of Equity Capital:
14.0%
For Preferred Stock=
1.674%
Common stock dividend/share paid last year=
0.111
per share
Common Stock=
9.372%
Total common stock dividend paid last year=
$24,429
——-
Calculated current dividend yield (last year)=
5.555%
12.206%
Expected growth rate of dividends=
8.000%
Future dividend yield (next year)=
5.999%
Calculate Weighted Ave. Cost of Capital – Based on Book Value:
Common stk dividend/sh. expected-next year=
0.120
Weights:
Pct of Total
Total common stock dividend to pay next year=
$26,383
Long-term Note Payable
$117,155
22.1%
Check: Calculated Future dividend yield (next year)=
5.999%
Preferred Stock
Preferred stock dividend/share paid last year=
$11.00
per share
Shares o/s
1,000
Total preferred stock dividend paid last year=
$11,000
Par value
$100
$100,000
18.9%
Total preferred stock dividend for next year=
$11,000
Common Stock
Share Book Value
$219,884
Paid-in capital
$32,056
59.0%
Retained earnings
$61,125
$313,065
————
$530,220
Weighted Average Cost of Capital
For Debt=
1.436%
For Preferred Stock=
2.075%
Common Stock=
8.266%
——-
11.777%
Chapter 20 – Management Compensation, Business Analysis, and Business Valuation
20-18
Chapter 20 – Management Compensation, Business Analysis, and Business Valuation
20-19

Chapter 20 – Management Compensation, Business Analysis, and Business Valuation
20-4 John Deere Case
Question 1: As discussed in the case, performance-evaluation and reward systems play a fundamental role in guiding employees’ actions and,
optimally, such systems should induce employees to engage in organizationally desirable behaviors. When entering into labor contracts,
employees and employers likely have differing objectives. On the one hand, employees want to maximize the benefits they extract from their
relationship with the organization. Employees likely desire to maximize their compensation, minimize their effort, and perform tasks that provide
the most intrinsic enjoyment (and future compensation). Employers (owners), on the other hand, hire employees to increase an organization’s
value. They want employees to exert high levels of effort towards projects with the greatest expected payoffs for the lowest possible cost.
Performance-evaluation and reward systems should dampen, if not mitigate, the conflicts of interest between employees and employers. To this
end, performance-evaluation and reward systems serve many vital functions in an organization (most of these are directly or indirectly discussed in
the case). First, such systems serve a motivational role whereby employees are enticed to exert high levels of effort (duration and intensity) on
organizational endeavors. In this regard, such systems not only need to compensate employees for hours spent at the firm site but also need to
reward employees for their productivity during working hours.
Second, performance-evaluation and reward systems serve a directing, or informational role. Employees typically perform several different tasks
Management could improve the effectiveness and efficiency of the production process, thereby reducing the cost, improving the speed, and/or
increasing the quality of production. Performance-evaluation and reward systems should make it profitable for employees to share their private
information with other members of the organization.
Finally, performance-evaluation and reward systems serve an attracting role. Such systems should entice employees with the requisite abilities and
skills desired by the organization to seek employment with the organization. Via employment contracts, organizations can attempt to sort or screen
20-20