Chapter 16 – Operational Performance Measurement: Further Analysis of Productivity and Sales
16-54 Market Size and Market Share Variances (15 min)
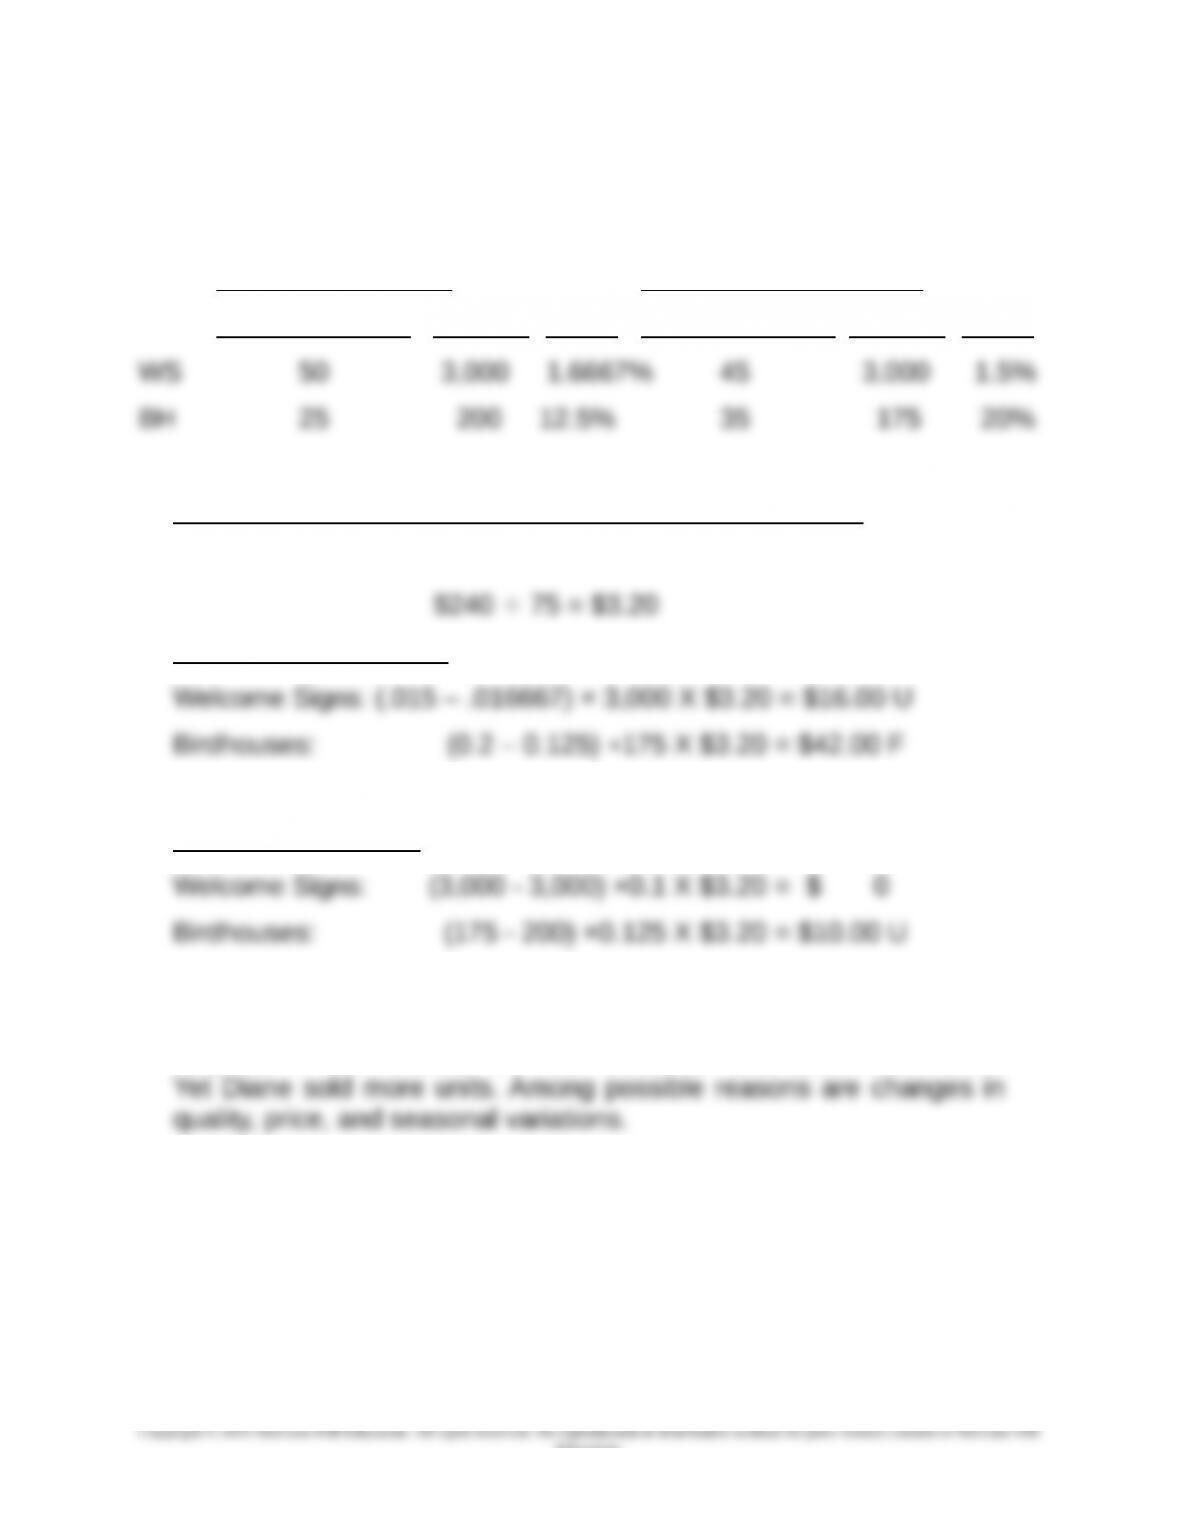
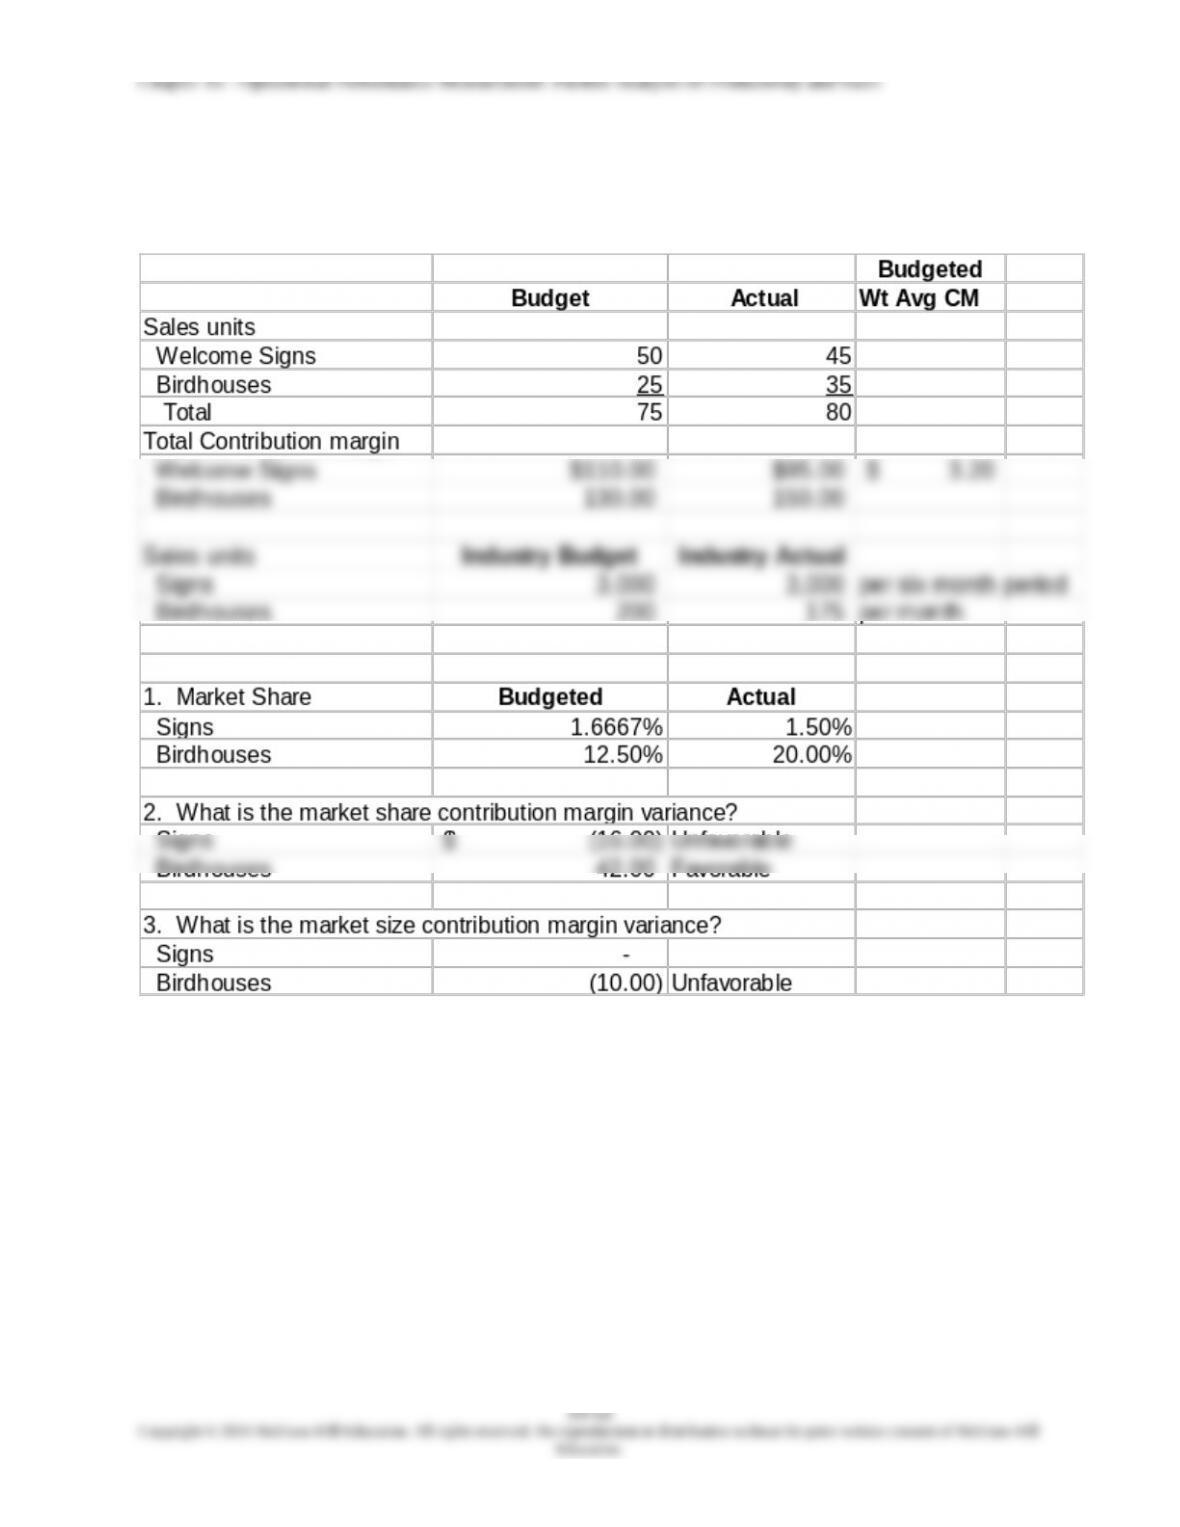
WS= Welcome Signs; BH= Birdhouses
1. Budget Actual (per month)____
Diane’s Designs Industry Share Diane’s Designs Industry Share
2. Weighted Average Budgeted Contribution Margin Per Unit:
Budgeted contribution margin per unit for both products:
Market Share Variance
3. Market size variance
4. Diane’s market share for Welcome Signs decreased while she did
very well for Birdhouses. The total market for Birdhouses decreased.
16-51
Education.
16.54 (continued -1)
The spreadsheet solution for 16-54 is shown below
Chapter 16 – Operational Performance Measurement: Further Analysis of Productivity and Sales
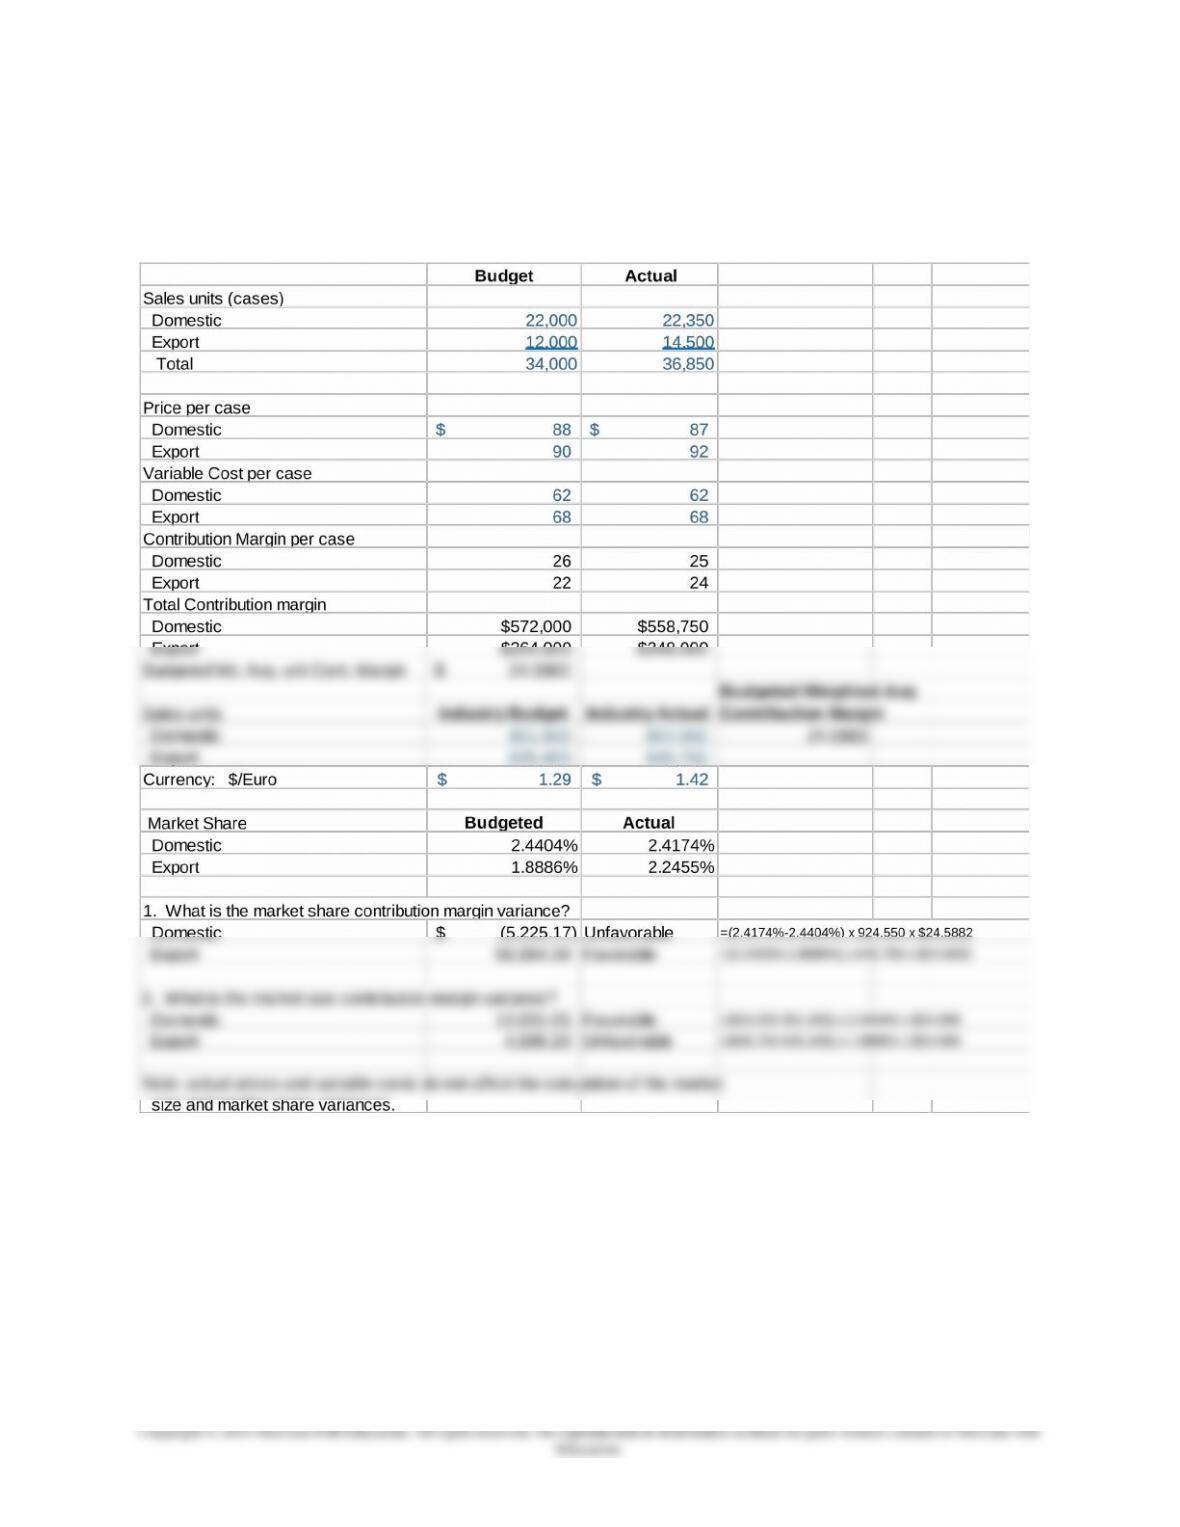
16-55 Market Size and Market Share Variances; Foreign Currency
Fluctuations (20 min)
1.,2.
16-53
Chapter 16 – Operational Performance Measurement: Further Analysis of Productivity and Sales
16-55 (continued -1)
3.
The unfavorable market share for the domestic market reflects the decline in
the company’s sales as the market increased; the unfavorable domestic
The large increase is due to the lower cost of the beer to Euro consumers,
plus an additional increase due perhaps to the Euro consumer becoming more
familiar with the Tall Pines brand. This is good news for TPB, as it could
mean that, when the dollar should rise again relative to the Euro, it may be
able to retain some of its new foreign customers.
16-54
Education.
Chapter 16 – Operational Performance Measurement: Further Analysis of Productivity and Sales
16-56 Comparative Income Statements and Sales Performance
Variances; Current to Prior Year (35 min)
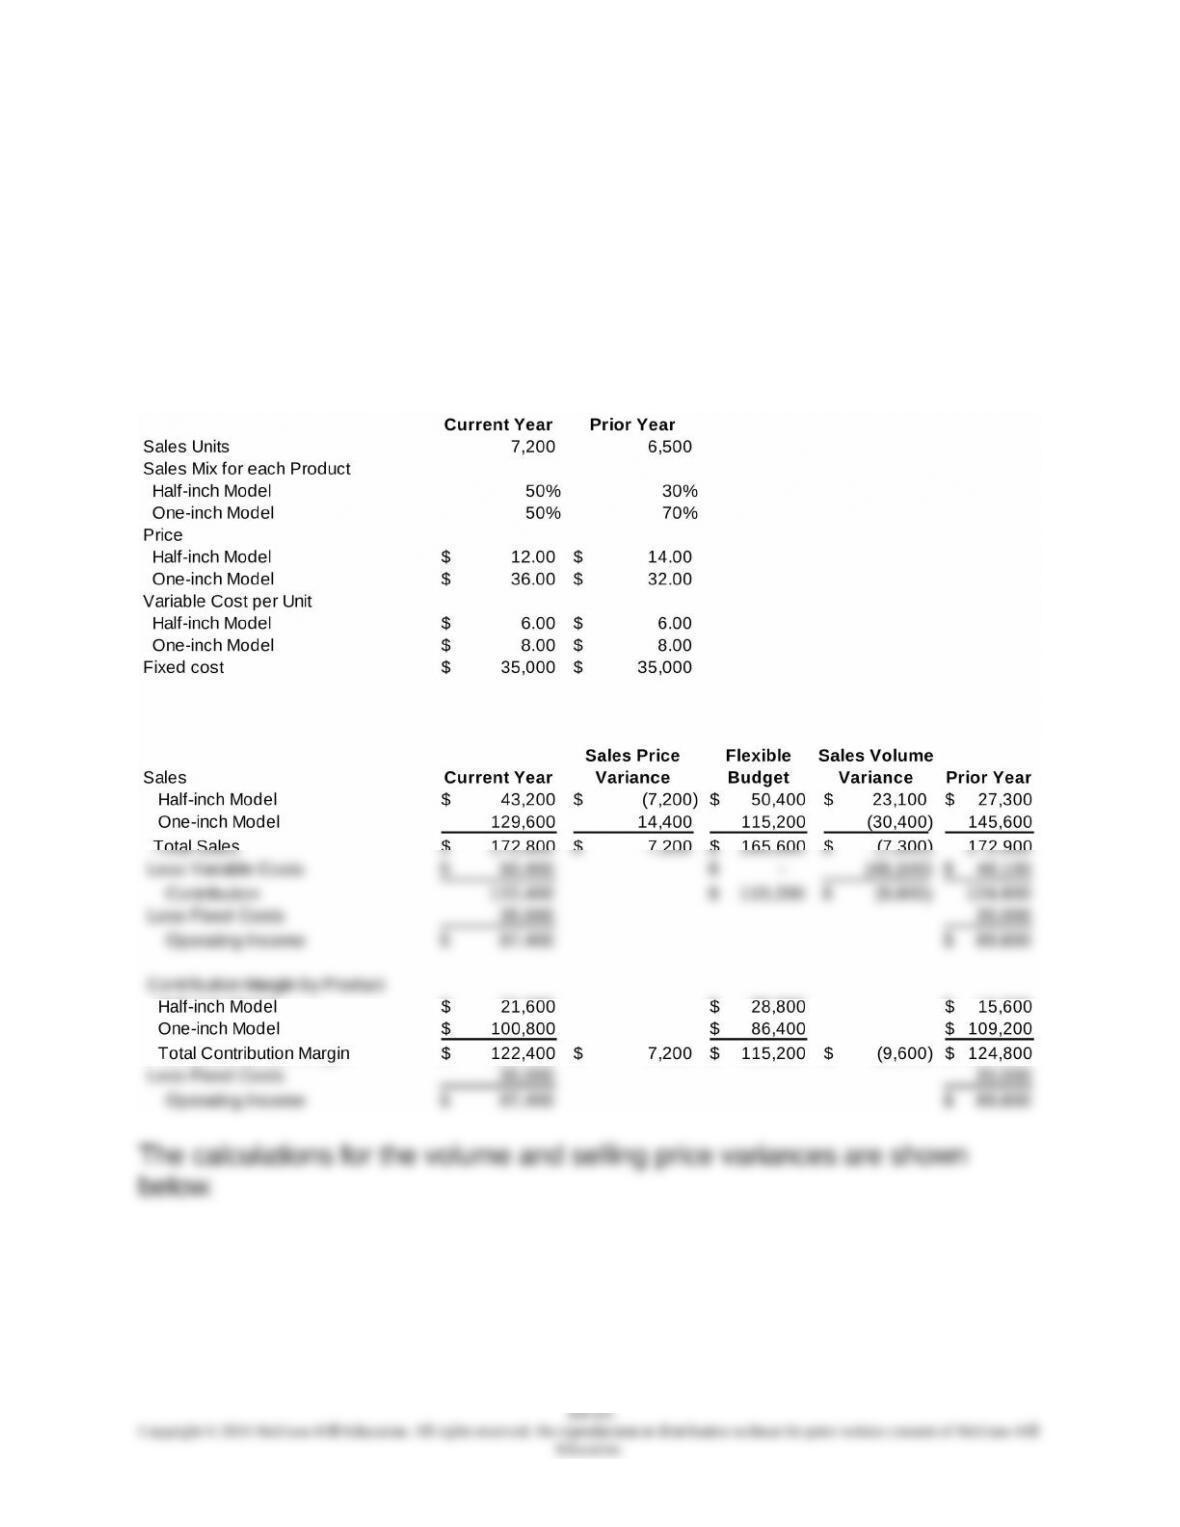
1. Comparative Income Statement for two years based on the flexible
budget (Exhibit 16.15)
Chapter 16 – Operational Performance Measurement: Further Analysis of Productivity and Sales
16-56 (continued -1)
The volume variances for each product:
Half Inch: $13,200 (F) = [(.3 x 6,500) – (.5 x 7,200)] x ($14-$6)
One Inch: $22,800 (U) = [(.7 x 6,500) – (.5 x 7,200)] x ($32-$8)
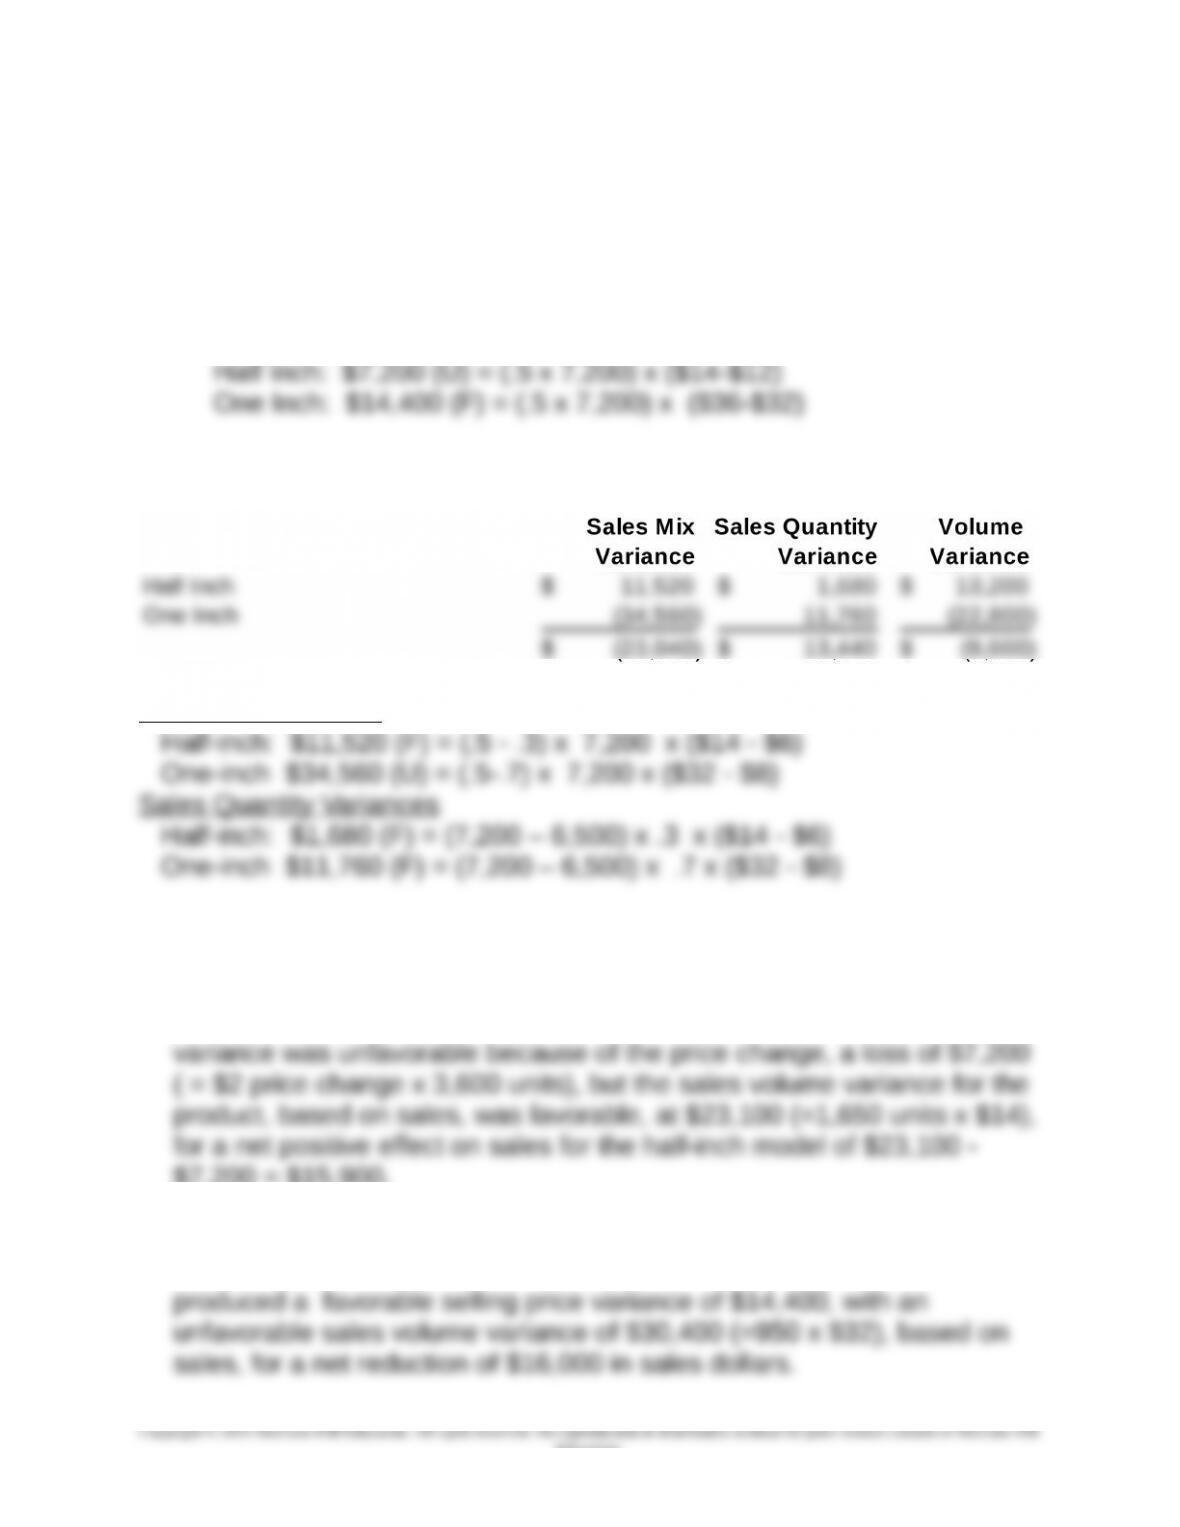
The selling price variances are as follows:
2. The sales mix and quantity variances based on contribution margin are
shown below.
Sales Mix Variances
3.
The sales strategy of decreasing price on the half-inch model was a
success in sales volume as sales units increased from 1,950 (.3 x 6,500)
to 3,600 (.5 x 7,200), an increase of 1,650 units. The selling price
$7,200 = $15,900.
The strategy of increasing price on the one-inch model could have
caused the fall in sales of 950 units (.7 x 6,500 – .5 x 7,200) but it
16-56
Education.
Chapter 16 – Operational Performance Measurement: Further Analysis of Productivity and Sales
16-56 (continued -2)
The cost of the increased sales volume on variable costs was $9,900 =
1,650 x $6 for the increased sales of the half inch model. The reduced
variable costs because of the reduced sales of the one-inch model was
950 x $8 = $7,600.
The net effect on operating income of the sales strategies was
16-57
Education.